City
All Cities
Aaronsburg
Abbottstown
Abell
Aberdeen
Abingdon
Abington
Absecon
Accident
Accokeek
Accomac
Adamstown
Addison
Adelphi
Afton
Airville
Akron
Alachua
Albright
Albrightsville
Alburtis
Aldan
Aldie
Alexandria
Alford
Aliquippa
Allensville
Allentown
Allenwood
Alloway
Allport
Altamonte Springs
Altoona
Alum Bank
Alva
Amberson
Ambler
Ambridge
Amelia Court House
Amherst
Amissville
Andalusia
Andreas
Anmoore
Annandale
Annapolis
Annville
Apollo Beach
Apopka
Aquasco
Arbovale
Arbutus
Arcadia
Archer
Ardmore
Arendtsville
Arlington
Arnold
Aroda
Arrington
Artemas
Asbury Park
Ashburn
Ashland
Ashton
Aspers
Astatula
Aston
Astor
Atco
Atglen
Atlantic City
Atlantic Highlands
Atlantis
Auburn
Auburndale
Audubon
Augusta
Aurora
Austin
Avalon
Avalon Boro
Avalon Manor
Ave Maria
Aventura
Avenue
Avis
Avon Park
Avondale
Aylett
Bainbridge
Baker
Bal Harbour
Bala Cynwyd
Baldwin
Ballard
Bally
Baltimore
Baltimore City
Bangor
Barboursville
Barclay
Barefoot Bay
Bargaintown
Barnegat
Barnegat Light
Barnesville
Barranquilla
Barrington
Barto
Barton
Bartow
Basinger
Baskerville
Basye
Bath
Bavaro
Bay Harbor Islands
Bayonne
Bayville
Beach Haven
Beach Lake
Beachwood
Bealeton
Beallsville
Bealsville
Bear
Bear Creek
Bear Creek Township
Beaufort
Beaver
Beaver Falls
Beaver Meadows
Beaver Springs
Beaverdam
Beavertown
Beccaria
Bechtelsville
Bedford
Bedminster
Beech Creek
Bel Air
Bel Alton
Belcamp
Belington
Bell
Belle Glade
Belle Haven
Belle Mead
Belle Vernon
Bellefonte
Belleplain
Belleview
Belleville
Bellevue
Bellmawr
Bellwood
Beltsville
Bendersville
Benedict
Bensalem
Benton
Bentonville
Bergenfield
Bergton
Berkeley Springs
Berlin
Berlin Borough
Bernville
Berrysburg
Berryville
Berwick
Berwyn
Berwyn Heights
Bethany Beach
Bethel
Bethel Park
Bethesda
Bethlehem
Betterton
Beverly
Beverly Hills
Big Pine Key
Big Pool
Bigler
Biglerville
Bird In Hand
Birdsboro
Biscayne Park
Bishopville
Bivalve
Blacksburg
Blackstone
Blackwood
Bladensburg
Blades
Blain
Blairs
Blairs Mills
Blakeslee
Bland
Blandburg
Blandon
Bloomery
Bloomington
Bloomsburg
Blossburg
Bloxom
Blue Anchor
Blue Bell
Blue Ridge Summit
Bluefield
Bluemont
Boalsburg
Boca Raton
Boiling Springs
Bokeelia
Bonifay
Bonita Springs
Boonsboro
Boothwyn
Bordentown
Bordentown Township
Boring
Boston
Boswell
Bound Brook
Bowie
Bowling Green
Boyce
Boyds
Boydton
Boyertown
Boynton Beach
Bozman
Bracey
Braddock
Braddock Heights
Bradenton
Bradford
Bradshaw
Brambleton
Branchburg
Branchdale
Brandon
Brandy Station
Brandywine
Branford
Breezewood
Breinigsville
Bremo Bluff
Brentwood
Brick
Brick Township
Bridgeport
Bridgeton
Bridgeville
Bridgewater
Brielle
Brigantine
Brightwood
Briny Breezes
Brisbin
Bristol
Bristow
Broad Run
Broadlands
Broadway
Brockton
Brodheadsville
Brogue
Bronson
Brookeville
Brookhaven
Brooklawn
Brooklyn
Brooklyn Park
Brookneal
Brooksville
Brookville
Broomall
Broomes Island
Browns Mills
Bruceton Mills
Bruington
Brunswick
Bryans Road
Bryantown
Bryn Athyn
Bryn Mawr
Buckeystown
Buckhannon
Buckingham
Buena
Buena Borough
Buena Vista Township
Buena Vista Twp
Bumpass
Bunker Hill
Bunnell
Burgess
Burke
Burkittsville
Burleigh
Burlington
Burlington Township
Burnham
Burnt Cabins
Burr Hill
Burtonsville
Bushkill
Bushnell
Bushwood
Butler
Byram Twp
Cabin John
Cabins
California
Callao
Callaway
Calvin
Cambridge
Cambridge Springs
Camden
Camden Wyoming
Camden-Wyoming
Camp Hill
Canadensis
Canal Point
Canonsburg
Canton
Cape Canaveral
Cape Charles
Cape Coral
Cape May
Cape May Court House
Cape May Point
Capitol Heights
Capon Bridge
Capon Springs
Carbondale
Caret
Carlisle
Carneys Point
Carneys Point Twp
Carrabelle
Cartagena
Carversville
Cascade
Cass
Casselberry
Cassville
Castleton
Catasauqua
Catawissa
Catharpin
Catlett
Catonsville
Cecilton
Cedar Key
Cedarville
Center
Center Cross
Center Valley
Central City
Centre Hall
Centreville
Chadds Ford
Chalfont
Chambersburg
Chance
Chantilly
Chaptico
Charles Town
Charlestown
Charlotte Court House
Charlotte Hall
Charlottesville
Charlton Heights
Chase
Chase City
Chatham
Chatsworth
Chattahoochee
Chelsea
Cheltenham
Cheriton
Cherry Hill
Chesapeake
Chesapeake Beach
Chesapeake City
Chesilhurst
Chester
Chester Gap
Chester Springs
Chesterbrook
Chesterfield
Chestertown
Chestnut Hill Cove
Cheswold
Cheverly
Chevy Chase
Chiefland
Chincoteague
Chincoteague Island
Chipley
Chokoloskee
Christiana
Christiansburg
Christmas
Church Creek
Church Hill
Churchton
Churchville
Cinnaminson
Cinnaminson Twp
Circleville
Citra
Citrus Springs
City of Mount Holly
Claiborne
Clarence
Clarksboro
Clarksburg
Clarksville
Claudville
Claymont
Claysburg
Clayton
Clear Brook
Clear Spring
Clearfield
Clearville
Clearwater
Clementon
Clements
Cleona
Clermont
Clewiston
Clifton
Clifton Forge
Clifton Heights
Clifton Township
Clinton
Cloud Lake
Coal Township
Coal Twp
Coaldale
Coalport
Coatesville
Cobb Island
Coburn
Cochranville
Cockeysville
Cocoa
Cocoa Beach
Coconut Creek
Coconut Grove
Coeburn
Cold Spring
Colebrook
College Park
Collegeville
Collingdale
Collings Lakes
Collingswood
Collingswood Borough
Colmar
Colonia
Colonial Beach
Colora
Coltons Point
Colts Neck
Columbia
Columbus
Commercial Township
Commodore
Conestoga
Conowingo
Conshohocken
Cookstown
Cooksville
Coolbaugh Township
Cooper City
Coopersburg
Copeland
Coplay
Coral Gables
Coral Springs
Corbin City
Cordova
Cornwall
Corriganville
Cottondale
Coudersport
Covington
Coxs Mills
Craigsville
Cranbury
Cranford
Crapo
Crawfordville
Cream Ridge
Cresaptown
Crescent
Crescent City
Cresco
Cresson
Cressona
Crestview
Crewe
Crisfield
Crofton
Cross Fork
Cross Junction
Crownsville
Croydon
Crozet
Crum Lynne
Crumpton
Crystal River
Cudjoe Key
Culpeper
Cumberland
Cumbola
Curtis Bay
Curwensville
Cutler Bay
Dade City
Dagsboro
Dallas
Dallastown
Dalmatia
Dalton
Damascus
Dameron
Dania Beach
Daniels
Danielsville
Danville
Darby
Darlington
Darnestown
Dauberville
Dauphin
Davenport
Davidsonville
Davie
Davis
Dayton
Daytona Beach
Daytona Beach Shores
Deal Island
Deale
Debary
Deepwater
Deer Park
Deerfield
Deerfield Beach
Defuniak Springs
Del Haven
Delanco
Delanco Twp
Deland
Delano
Delaplane
Delaware City
Delmar
Delmont
Delran
Delran Twp
Delray
Delray Beach
Delta
Deltaville
Deltona
Dennisville
Denton
Denver
Deptford
Deptford Township
Deptford Twp
Derwood
Devon
Devonshire
Dewey Beach
Diamond Beach
Dickerson
Dillsburg
Dillwyn
Dingmans Ferry
Disputanta
District Heights
Dividing Creek
Doral
Dorcas
Dorchester
Dorothy
Doswell
Douglass Twp
Douglassville
Dover
Downingtown
Doylestown
Drakes Branch
Drayden
Dresher
Drexel Hill
Driftwood
Druid
Drumore
Drums
Dry Fork
Dry Run
Du Bois
Dublin
Dubois
Duck Key
Dulles
Dumfries
Duncannon
Duncansville
Dundalk
Dunedin
Dunkirk
Dunmore
Dunn Loring
Dunnellon
Dunnsville
Durbin
Dushore
Eagle Lake
Eagleville
Earleville
Earlington
Earlysville
East Allen Twp
East Bangor
East Berlin
East Brunswick
East Earl
East Fallowfield
East Freedom
East Greenville
East Lansdowne
East New Market
East Norriton
East Orange
East Petersburg
East Stroudsburg
East Vineland
East Waterford
East Windsor
East Windsor Twp
Eastampton
Eastampton Twp
Easton
Eatontown
Eckhart Mines
Eddystone
Eden
Edgemere
Edgewater
Edgewater Park
Edgewater Park Twp
Edgewood
Edinburg
Edison
Effort
Egg Harbor
Egg Harbor City
Egg Harbor Township
Egg Harbor Twp
El Portal
Eldersburg
Eldora
Elizabeth
Elizabethtown
Elizabethville
Elk Garden
Elkins
Elkins Park
Elkridge
Elkton
Elkwood
Ellamore
Ellenboro
Ellendale
Ellerslie
Ellicott
Ellicott City
Elliottsburg
Ellwood City
Elmer
Elmhurst Twp
Elsmere
Elverson
Elwood
Elysburg
Emmaus
Emmitsburg
Emporia
Emporium
Englewood
Englishtown
Enhaut
Enola
Entriken
Ephrata
Equinunk
Erial
Erie
Erma
Erwinna
Essex
Essington
Estell Manor
Estero
Etlan
Etters
Evans City
Everett
Everglades City
Evesham
Evesham Twp
Ewell
Ewing
Ewing Township
Ewing Twp
Exeter
Exmore
Exton
Factoryville
Fairfax
Fairfax Station
Fairfield
Fairfield Township
Fairfield Twp
Fairless Hills
Fairmont
Fairmount Heights
Fairplay
Falling Waters
Falls Church
Fallsington
Fallston
Falmouth
Fancy Gap
Fannettsburg
Fanning Springs
Farmington
Farmville
Farnham
Faulkner
Fawn Grove
Fayetteville
Feasterville Trevose
Feasterville-Trevose
Federalsburg
Fellsmere
Felton
Fenwick Island
Fern Park
Fernandina Beach
Ferndale
Ferrum
Fieldsboro
Finksburg
Fishers Hill
Fishing Creek
Flagler Beach
Flagtown
Fleetwood
Fleming
Flemington
Flint Hill
Flinton
Flintstone
Florahome
Floral City
Florence
Florence Twp
Florida City
Flourtown
Fogelsville
Folcroft
Folsom
Folsom Borough
Forest Hill
Forked River
Forks Township
Forksville
Fort Ashby
Fort Belvoir
Fort Defiance
Fort Howard
Fort Lauderdale
Fort Littleton
Fort Loudon
Fort Mc Coy
Fort Mccoy
Fort Meade
Fort Myers
Fort Myers Beach
Fort Pierce
Fort Valley
Fort Washington
Fort White
Fortescue
Fountain
Fountain Hill
Fountainville
Frackville
Frankford
Franklin
Franklin Park
Franklin Twp
Franklintown
Franklinville
Frederica
Frederick
Fredericksburg
Free Union
Freeburg
Freedom
Freehold
Freeland
Frenchtown
Frenchville
Friedens
Friedensburg
Friendship
Friendsville
Front Royal
Frostburg
Frostproof
Fruitland
Fruitland Park
Fulks Run
Fulton
Funkstown
Furlong
Gainesville
Gaithersburg
Galena
Galestown
Galesville
Galeton
Galloway
Galloway Township
Galloway Twp
Gambrills
Gap
Gardners
Garnet Valley
Garrett Park
Garrison
Genesee
Georgetown
Germansville
Germantown
Gerrardstown
Gettysburg
Gibbsboro
Gibbstown
Gilberton
Gilbertsville
Girardville
Girdletree
Gladstone
Gladwyne
Gladys
Glassboro
Glassborough
Glen Allen
Glen Arm
Glen Burnie
Glen Daniel
Glen Gardner
Glen Mills
Glen Ridge
Glen Rock
Glenarden
Glendora
Glenelg
Glenmoore
Glenn Dale
Glenolden
Glenside
Glenville
Glenwood
Gloucester
Gloucester City
Gloucester Twp
Glyndon
Golden Beach
Goldsboro
Goldvein
Golts
Goode
Goodview
Gordon
Gordonsville
Gordonville
Gore
Goshen
Goulds
Gouldsboro
Graceville
Grant
Grant Valkaria
Grantsville
Grantville
Granville
Grasonville
Grassflat
Grassy Sound
Gratz
Great Cacapon
Great Falls
Great Mills
Grecia
Green Bay
Green Cove Springs
Green Creek
Green Lane
Green Spring
Greenacres
Greenbackville
Greenbelt
Greencastle
Greenfield Township
Greensboro
Greensborough
Greentown
Greenville
Greenwich
Greenwich Township
Greenwood
Gretna
Grottoes
Groveland
Guatemala
Gulf Stream
Gulfport
Gulph Mills
Gum Spring
Gwynedd Valley
Gwynn Oak
Haddon Heights
Haddon Township
Haddon Twp
Haddonfield
Hagerstown
Hague
Haines City
Hainesport
Halethorpe
Halifax
Hallam
Hallandale
Hallandale Beach
Hallwood
Hamburg
Hamilton
Hamilton Township
Hamilton Twp
Hammonton
Hampstead
Hampton
Hancock
Hancocks Bridge
Hanover
Hanover Township
Harbeson
Hardy
Hardyville
Harleysville
Harman
Harmans
Harpers Ferry
Harrington
Harrisburg
Harrisonburg
Harrisonville
Hartfield
Hartly
Hartwood
Harvey Cedars
Harveys Lake
Harwood
Hastings
Hatboro
Hatfield
Havana
Haverford
Haverhill
Havertown
Havre De Grace
Hawk Run
Hawley
Hawthorne
Hayes
Haymarket
Haywood
Hazelton
Hazle Township
Hazle Twp
Hazleton
Heathsville
Hebron
Hedgesville
Hegins
Hellam
Hellertown
Helmetta
Henderson
Hendricks
Henrico
Henry
Henryville
Hereford
Hermitage
Hernando
Herndon
Hershey
Hesston
Hialeah
Hialeah Gardens
High Bridge
High Springs
High View
Highland
Highland Beach
Highland Park
Highspire
Hightstown
Hilliard
Hillsboro
Hillsboro Beach
Hillsborough
Hillside
Hilltown
Hinton
Historic New Castle
Hobe Sound
Hockessin
Holland
Hollidaysburg
Holly Hill
Hollywood
Holmdel
Holmes
Holtwood
Homestead
Homosassa
Honesdale
Honey Brook
Honey Grove
Hood
Hopewell
Hopkins
Horntown
Horsham
Hot Springs
Houston
Houtzdale
Howard
Howell
Huddleston
Hudson
Hughesville
Hume
Hummelstown
Hunt Valley
Huntingdon
Huntingdon Valley
Huntingtown
Hurlock
Hurricane
Hurt
Hustle
Hustontown
Hutchinson Island
Hyattsville
Hyde
Hydes
Hyndman
Hypoluxo
Ickesburg
Idlewylde
Ijamsville
Imlaystown
Imler
Immokalee
Independence
Indialantic
Indian Harbour Beach
Indian Head
Indian Lake Estates
Indian River Shores
Indian Rocks Beach
Indiantown
Inglis
Intercourse
Interlachen
Inverness
Inwood
Irvington
Irvona
Iselin
Islamorada
Island Heights
Issue
Ivyland
Jackson
Jackson Township
Jacksonville
Jacobus
James Creek
Jamesburg
Jamison
Jamundi
Jarabacoa
Jarrettsville
Java
Jefferson
Jeffersonton
Jenkintown
Jennings
Jensen Beach
Jersey City
Jersey Shore
Jessup
Jim Thorpe
Jobstown
Johnsonburg
Johnstown
Jonestown
Joppa
Joppatowne
Julian
Junedale
Juno Beach
Jupiter
Jupiter Inlet Colony
Jupiter Island
Kane
Kathleen
Kearneysville
Keedysville
Kempton
Kenansville
Kenbridge
Kendall Park
Kennedyville
Kennett Square
Kensington
Kenton
Kents Store
Keswick
Key Biscayne
Key Colony Beach
Key Largo
Key West
Keymar
Keyser
Keystone Heights
Keysville
Kilmarnock
King And Queen Court House
King George
King Of Prussia
King William
Kingston
Kingsville
Kingwood
Kinsale
Kintnersville
Kinzers
Kirkwood
Kissimmee
Kitzmiller
Kleinfeltersville
Klingerstown
Knoxville
Kulpmont
Kunkletown
Kutztown
La Crosse
La Fortuna
La Plata
Labelle
Lackawaxen
Lady Lake
Lafayette Hill
Lahaska
Lake Alfred
Lake Ariel
Lake City
Lake Clarke Shores
Lake Frederick
Lake Harmony
Lake Mary
Lake Panasoffkee
Lake Park
Lake Placid
Lake Ridge
Lake Wales
Lake Worth
Lake Worth Beach
Lakehurst
Lakeland
Lakewood
Lamar
Lambertville
Lamott
Lampeter
Lancaster
Landenberg
Landingville
Landisburg
Landisville
Landover
Langhorne
Lanham
Lanoka Harbor
Lansdale
Lansdowne
Lansford
Lantana
Laplata
Largo
Latrobe
Lauderdale By The Sea
Lauderdale Lakes
Lauderhill
Laurel
Laurel Springs
Laureldale
Lavale
Lawnside
Lawrence
Lawrence Township
Lawrence Twp
Lawrenceville
Laytonsville
Lazy Lake
Lebanon
Lecanto
Lederach
Lee
Leeds Point
Leeper
Leesburg
Leesport
Lehigh Acres
Lehighton
Lehman
Leipsic
Lemont
Lemoyne
Lenhartsville
Leola
Leon
Leonardtown
Levels
Levittown
Lewes
Lewisberry
Lewisburg
Lewistown
Lexington
Lexington Park
Lighthouse Point
Lignum
Lilly
Limerick
Lincoln
Lincoln University
Linden
Lindenwold
Lindenwold Boro
Lindenwold Borough
Line Lexington
Lineboro Cpo
Linkwood
Linthicum
Linthicum Heights
Linwood
Lititz
Little Creek
Little Egg Harbor
Little Egg Harbor Township
Little Egg Harbor Twp
Little Orleans
Little Torch Key
Littlestown
Live Oak
Liverpool
Lock Haven
Locust Dale
Locust Gap
Locust Grove
Locust Hill
Locustdale
Logan Township
Loganton
Loganville
Lonaconing
Long Beach
Long Beach Township
Long Beach Twp
Long Branch
Long Key
Long Neck
Long Pond
Longboat Key
Longport
Lords Valley
Lorida
Lorton
Lost City
Lost Creek
Lost River
Lothian
Lottsburg
Louisa
Lovettsville
Loveville
Lovingston
Lower Chelsea
Lower Gwynedd
Lower Paxton
Lower Township
Lower Twp
Loxahatchee
Loxahatchee Groves
Loysville
Lumberton
Lumberville
Luray
Lusby
Lutherville
Lutherville Timonium
Lutz
Lykens
Lynch
Lynch Station
Lynchburg
Lynn Haven
Lyon Station
Macungie
Madera
Madison
Madison Heights
Madisonburg
Magnolia
Mahanoy City
Mahanoy Plane
Maidens
Maidsville
Maitland
Malabar
Malaga
Malvern
Manahawkin
Manakin Sabot
Manalapan
Manassas
Manassas Park
Manchester
Manchester Township
Manchester Twp
Mangonia Park
Manheim
Mannington
Manns Choice
Mansfield Twp
Mantua
Manville
Maple Glen
Maple Shade
Marathon
Marbury
Marco Island
Marcus Hook
Mardela Springs
Margate
Margate City
Marianna
Marietta
Marion
Marion Heights
Marion Station
Markham
Marlboro
Marlinton
Marlton
Marmora
Marriottsville
Marshall
Marshallville
Martins Creek
Martinsburg
Martinsville
Marydel
Maryland City
Marysville
Mascot
Mascotte
Masontown
Massey
Matawan
Mathias
Matlacha
Mattaponi
Maugansville
Maurertown
Maurice River Township
Maurice River Twp
Maxatawny
Mayo
Mays Landing
Maysville
Maytown
Mc Alisterville
Mc Alpin
Mc Clure
Mc Connellsburg
Mc Gaheysville
Mc Henry
Mc Kees Rocks
Mc Sherrystown
Mc Veytown
Mcclure
Mcconnellsburg
Mccoole
Mcdaniel
Mcgaheysville
Mchenry
Mckeesport
Mclean
Mcsherrystown
Mcveytown
Meadowbrook
Mechanicsburg
Mechanicsville
Medford
Medford Lakes
Media
Medley
Meherrin
Melbourne
Melbourne Beach
Melrose
Melrose Park
Mendota
Mercersburg
Merchantville
Merchantville Borough
Merion Station
Merritt Island
Mertztown
Miami
Miami Beach
Miami Gardens
Miami Lakes
Miami Shores
Miami Springs
Micco
Mickleton
Middle River
Middlebrook
Middleburg
Middlesex
Middletown
Midland
Midlothian
Mifflin
Mifflinburg
Mifflintown
Milam
Milesburg
Milford
Mill Creek
Mill Hall
Millboro
Millers
Millersburg
Millerstown
Millersville
Millerton
Millheim
Millington
Millmont
Millsboro
Millsborough
Millstone
Millstone Township
Millstone Twp
Milltown
Millville
Milmay
Milmont Park
Milroy
Milton
Mims
Mineral
Minersville
Minotola
Miramar
Mitchells
Mitchellville
Modena
Mohnton
Mohrsville
Monaca
Monessen
Moneta
Monkton
Monmouth Junction
Monroe
Monroe Township
Monroe Twp
Monroeton
Monroeville
Monrovia
Mont Alto
Mont Clare
Montchanin
Montclair
Montgomery Village
Montgomeryville
Montoursville
Montpelier
Montross
Montvale
Moore Haven
Moorefield
Moorestown
Morgantown
Morningside
Morris Twp
Morrisdale
Morriston
Morristown Township
Morrisville
Morton
Moseley
Moshannon
Mount Airy
Mount Bethel
Mount Carmel
Mount Crawford
Mount Dora
Mount Ephraim
Mount Gretna
Mount Holly
Mount Holly Springs
Mount Jackson
Mount Joy
Mount Laurel
Mount Nebo
Mount Pleasant Mills
Mount Pocono
Mount Rainier
Mount Royal
Mount Savage
Mount Storm
Mount Union
Mount Wolf
Mountain Lake Park
Mountain Top
Mountville
Mt Airy
Mt Carmel
Mt Crawford
Mt Gretna
Mt Holly
Mt Jackson
Mt Jewett
Mt Joy
Mt Lake Park
Mt Laurel
Mt Nebo
Mt Royal
Mt Savage
Mt Storm
Mt Union
Mt. Airy
Muhlenberg Township
Muir
Mulberry
Mullica Hill
Mullica Township
Muncy
Munson
Myerstown
Myersville
Mystic Island
Mystic Islands
N Bethesda
Nanjemoy
Nanticoke
Naples
Naranja
Narberth
Narvon
Nassawadox
Nathalie
National Harbor
National Park
Natural Bridge
Natural Bridge Station
Navarre
Nazareth
Neavitt
Needmore
Nellysford
Neptune
Neptune Beach
Neptune City
Nescopeck
Nesquehoning
New Berlin
New Bloomfield
New Britain
New Brunswick
New Carrollton
New Castle
New Castle City
New Church
New Columbia
New Creek
New Cumberland
New Egypt
New Freedom
New Gretna
New Holland
New Hope
New Kensington
New Market
New Milford
New Oxford
New Paris
New Park
New Philadelphia
New Port Richey
New Providence
New Ringgold
New Smyrna Beach
New Tripoli
New Windsor
Newark
Newberry
Newburg
Newfield
Newfoundland
Newmanstown
Newport
Newport News
Newportville
Newton Hamilton
Newtonville
Newtown
Newtown Square
Newville
Nokesville
Norfolk
Norristown
North
North Bay Village
North Beach
North Bend
North Bergen
North Bethany
North Bethesda
North Brentwood
North Brunswick
North Cape May
North Chesterfield
North East
North Fort Myers
North Lauderdale
North Miami
North Miami Beach
North Palm Beach
North Port
North Potomac
North Tazewell
North Versailles
North Wales
North Wildwood
Northampton
Northfield
Northumberland
Norwood
Not Provided
Nottingham
Noxen
O Brien
Oak Hill
Oakland
Oakland Park
Oaklyn
Oakpark
Oaks
Oakton
Oberlin
Ocala
Occoquan
Ocean Acres
Ocean Breeze
Ocean City
Ocean Gate
Ocean Pines
Ocean Pines - Berlin
Ocean Ridge
Ocean View
Ocklawaha
Odenton
Odessa
Okeechobee
Olanta
Old Fields
Old Town
Oldsmar
Oldtown
Oley
Olney
Olyphant
Onancock
Onley
Opa Locka
Orange
Orange City
Orbisonia
Orchard Beach
Orefield
Oreland
Orlando
Orlean
Ormond Beach
Orotina
Orrstown
Orrtanna
Orwigsburg
Osceola Mills
Osteen
Osterburg
Other
Ottsville
Out Of Country
Oviedo
Owings
Owings Mills
Oxford
Oxon Hill
Paeonian Springs
Pahokee
Painter
Paisley
Palatka
Palermo
Palm
Palm Bay
Palm Beach
Palm Beach Gardens
Palm Beach Shores
Palm City
Palm Coast
Palm Harbor
Palm Springs
Palmdale
Palmerton
Palmetto
Palmetto Bay
Palmira
Palmyra
Pamplin
Panacea
Panama City
Panama City Beach
Paoli
Paradise
Paris
Park Hall
Parkersburg
Parkesburg
Parkland
Parksley
Parkton
Parkville
Parlin
Parrish
Parsons
Parsonsburg
Partlow
Pasadena
Patton
Paulsboro
Paw Paw
Paxinos
Peach Bottom
Pearisburg
Pedricktown
Pemberton
Pembroke Park
Pembroke Pines
Pen Argyl
Penhook
Penllyn
Penn Laird
Penn Valley
Penndel
Pennington
Penns Grove
Penns Grove Borough
Pennsauken
Pennsauken Township
Pennsauken Twp
Pennsburg
Pennsville
Pennsville Township
Pennsylvania Furnace
Pensacola
Pequea
Perkasie
Perkiomenville
Perrine
Perry
Perry Hall
Perryville
Perth Amboy
Petersburg
Peterstown
Phenix
Philadelphia
Philadelphia Metro Area
Philipsburg
Phillipsburg
Phoenix
Phoenixville
Piedmont
Pikesville
Pilesgrove
Pilesgrove Township
Pilesgrove Twp
Pillow
Pine Beach
Pine Grove
Pine Grove Mills
Pine Hill
Pine Hill Borough
Pinecrest
Piney Point
Pioneer
Pipersville
Piscataway
Pitman
Pittsburgh
Pittsgrove
Pittsgrove Township
Pittsgrove Twp
Pittston
Pittsville
Placida
Plainfield
Plainsboro
Plantation
Plantation Key
Pleasant Gap
Pleasant Mount
Pleasantville
Plumsteadville
Plymouth
Plymouth Meeting
Pocomoke
Pocomoke City
Pocono Lake
Pocono Manor
Pocono Pines
Pocono Summit
Poinciana
Point Of Rocks
Point Pleasant
Point Pleasant Boro
Points
Polk City
Pomfret
Pomona
Pomona Park
Pompano Beach
Poolesville
Poquoson
Port Carbon
Port Charlotte
Port Deposit
Port Labelle
Port Matilda
Port Murray
Port Norris
Port Orange
Port Penn
Port Republic
Port Richey
Port Royal
Port Salerno
Port St. Lucie
Port Tobacco
Port Trevorton
Portage
Portsmouth
Potomac
Potomac Falls
Pottstown
Pottsville
Pounding Mill
Powhatan
Preston
Prince Frederick
Prince George
Princess Anne
Princeton
Princeton Junction
Prineton
Prospect Park
Pt Of Rocks
Pulaski
Punta Cana
Punta Gorda
Punxsutawney
Purcellville
Purgitsville
Pylesville
Quakake
Quakertown
Quantico
Quarryville
Queen Anne
Queenstown
Quicksburg
Quinby
Quincy
Radford
Radnor
Railroad
Ramey
Ramrod Key
Randallstown
Randolph
Ranshaw
Ranson
Raphine
Rapidan
Rappahannock Academy
Rawlings
Reading
Rebersburg
Red Hill
Red Lion
Reedsville
Reedville
Rehoboth Beach
Reinholds
Reisterstown
Remington
Renick
Reston
Reva
Reynoldsville
Rhoadesville
Rhodesdale
Richardsville
Richboro
Richfield
Richland
Richlands
Richlandtown
Richmond
Ridge
Ridgeley
Ridgely
Ridley Park
Riegelsville
Rileyville
Ringoes
Ringtown
Rio
Rio Grande
Rising Sun
Riva
Riverdale
Riverside
Riverton
Riverview
Riviera Beach
Rixeyville
Roanoke
Roaring Spring
Robbinsville
Robertsdale
Robesonia
Rochelle
Rock Hall
Rockaway
Rockhill Furnace
Rockingham
Rockledge
Rockville
Rocky Hill
Roebling
Rohrersville
Romney
Ronks
Roosevelt
Rose Valley
Rosedale
Roseland
Roselle Park
Rosemont
Rotonda West
Roulette
Round Hill
Royal Oak
Royal Palm Beach
Royersford
Ruckersville
Rumson
Runnemede
Ruskin
Ruther Glen
Ruxton
Rydal
Sabillasville
Sacramento
Saddle Brook
Sadsbury Twp
Saint Clair
Saint Georges
Saint Inigoes
Saint James
Saint Leonard
Saint Michaels
Saint Thomas
Salem
Salisbury
Saltillo
Saluda
San Jose
San Salvador
Sandy Level
Sandy Ridge
Sandy Spring
Sanford
Sanibel
Santa Marta
Santa Rosa Beach
Santiago De Los Caballeros
Santo Domingo
Sarasota
Sardinia
Satellite Beach
Satsuma
Savage
Savannah
Saxton
Saylorsburg
Sayreville
Schaefferstown
Schellsburg
Schenectady
Schnecksville
Schuyler
Schuylkill Haven
Schwenksville
Scotland
Scotrun
Scott Depot
Scottdale
Scottsburg
Scottsville
Scranton
Sea Isle City
Sea Ranch Lakes
Seabrook
Seaford
Seaside Heights
Seaside Park
Seaville
Sebastian
Sebring
Secane
Secretary
Selbyville
Selinsgrove
Sellersville
Sellingsgrove
Seltzer
Seminole
Seneca Rocks
Seven Valleys
Severn
Severna Park
Sewalls Point
Sewell
Sewickley
Shade Gap
Shady Side
Shamokin
Shamokin Dam
Shamong
Shamong Township
Shamong Twp
Shanks
Sharon Hill
Sharpsburg
Sharptown
Shartlesville
Shawsville
Sheffield
Shelby
Shenandoah
Shenandoah Junction
Shepherdstown
Sheppton
Shermans Dale
Sherwood
Shickshinny
Shillington
Shiloh
Ship Bottom
Shippensburg
Shiremanstown
Shirleysburg
Shoemakersville
Shohola
Showell
Shrewsbury
Shrewsbury Twp
Sicklerville
Silver Spring
Silver Springs
Silverdale
Singer Island
Sinking Spring
Sinnamahoning
Sioux Rapids
Six Mile Run
Skillman
Skippack
Skippack Twp
Slanesville
Slatedale
Slatington
Smithfield
Smithsburg
Smithville
Smyrna
Snow Hill
Snow Shoe
Solebury
Solomons
Somerdale
Somers Point
Somerset
Sorrento
Souderton
South Amboy
South Bay
South Bethany
South Boston
South Brunswick
South Chesterfield
South Dennis
South Hill
South Miami
South Mountain
South Palm Beach
South Plainfield
South River
South Seaville
South Sterling
South Williamsport
Southampton
Southampton Twp
Southwest Ranches
Sparks
Sparks Glencoe
Sparrows Point
Spencerville
Sperryville
Spotswood
Spotsylvania
Spring City
Spring Creek
Spring Glen
Spring Grove
Spring Hill
Spring House
Spring Mills
Spring Run
Springdale
Springfield
Springfield Twp
Springtown
St Albans
St Augustine
St Clair
St Cloud
St Inigoes
St James City
St Johns
St Leoanrd
St Leonard
St Michaels
St Petersburg
St Thomas
Stafford
Stafford Township
Stafford Twp
Stanardsville
Stanley
Star Tannery
Starke
State College
Staunton
Steelton
Stephens City
Stephenson
Sterling
Stevens
Stevensburg
Stevenson
Stevensville
Stewartstown
Stewartsville
Still Pond
Stock Island
Stockton
Stone Harbor
Stone Harbor Manor
Stoney Beach
Stowe
Strafford
Strasburg
Stratford
Strathmere
Street
Stroud Twp
Stroudsburg
Stuart
Stuarts Draft
Sudlersville
Suffolk
Sugar Grove
Sugar Notch
Sugarloaf
Sugarloaf Key
Suitland
Sumerduck
Summerdale
Summerfield
Summerland Key
Summersville
Summit Hill
Summit Point
Sumterville
Sun City Center
Sunbury
Sunderland
Sunny Isles Beach
Sunrise
Surf City
Surfside
Surry
Susquehanna
Swainton
Swan Point
Swanton
Swarthmore
Swedesboro
Sweet Valley
Sweetwater
Swiftwater
Sykesville
Tabernacle
Tabernacle Twp
Tafton
Takoma Park
Tall Timbers
Tallahassee
Talleyville
Tamaqua
Tamarac
Tampa
Taneytown
Tannersville
Tappahannock
Tarpon Springs
Tavares
Tavernier
Taylors Island
Teaneck
Telford
Temperanceville
Temple
Temple Hills
Tequesta
Terra Alta
The Acreage
The Plains
The Villages
Thomasville
Thompson
Thompsontown
Thorndale
Thornton
Thorofare
Three Springs
Thurmont
Tidioute
Tilghman
Timberville
Timblin
Timonium
Titusville
Toano
Tobyhanna
Todd
Toddville
Toms Brook
Toms River
Topton
Toughkenamon
Tower City
Town Bank
Townbank
Townsend
Towson
Tracys Landing
Trafford
Trainer
Trappe
Tremont
Trenton
Trevose
Triangle
Trinity
Trooper
Trout Run
Troxelville
Troy
Tuckahoe
Tuckerton
Tuckerton Borough
Tullytown
Tulum
Tunkhannock Twp
Turbotville
Turnersville
Tuscarora
Tyaskin
Tylerton
Tyrone
Tysons
Umatilla
Unincorporated
Union Bridge
Union Dale
Union Hall
Uniontown
Unionville
University Park
Unknown
Upper Bern Twp
Upper Black Eddy
Upper Chichester
Upper Chichester Twp
Upper Darby
Upper Deerfield Township
Upper Falls
Upper Gwynedd
Upper Gwynedd Twp
Upper Hill
Upper Holland
Upper Marlboro
Upper Township
Upper Tract
Upperco
Upperstrasburg
Upperville
Urbana
Urbanna
Va Beach
Valley Forge
Valley Lee
Valley View
Valrico
Vanderbilt
Venice
Venice Park
Ventnor
Ventnor City
Ventnor Heights
Venus
Vernon Hill
Vero Beach
Verona
Victoria
Vienna
Village Of Golf
Villanova
Villas
Vincentown
Vineland
Vinton
Viola
Virginia Beach
Virginia Gardens
Voorhees
Wachapreague
Waldo
Waldorf
Walkersville
Walkerton
Wall
Wallaceton
Wallingford
Wallops Island
Walnut Bottom
Walnutport
Wana
Wardensville
Waretown
Warfield
Warfordsburg
Warm Springs
Warminster
Warren
Warrenton
Warrington
Warriors Mark
Warsaw
Warwick
Warwick Twp
Washington
Washington Boro
Washington Crossing
Washington Grove
Washington Township
Waterfall
Waterford
Waterford Works
Watsontown
Wauchula
Waverly
Wayne
Waynesboro
Weatherly
Webster
Webster Springs
Weeki Wachee
Weems
Weirsdale
Welcome
Wellborn
Wellersburg
Wellington
Wellsboro
Wellsville
Wenonah
Wernersville
Wesley Chapel
West Atlantic City
West Berlin
West Brandywine
West Cape May
West Chester
West Collingswood
West Conshohocken
West Creek
West Deptford
West Deptford Township
West Deptford Twp
West Friendship
West Grove
West Hazleton
West Lawn
West Melbourne
West Miami
West Norriton
West Norriton Twp
West Ocean City
West Orange
West Palm Beach
West Park
West Pittston
West Reading
West River
West Trenton
West Wildwood
West Windsor
West Windsor Twp
West York
Westampton
Westampton Twp
Westernport
Westlake
Westminster
Westmont
Weston
Westover
Westville
Weyers Cave
Weymouth Township
Whaleyville
Wharton Park
Wheaton
White Hall
White Haven
White Marsh
White Plains
White Post
White Springs
White Stone
White Sulphur Springs
Whiteford
Whitehall
Whitesboro
Whiting
Wildwood
Wildwood Crest
Wiley Ford
Wilkes Barre
Wilkes-Barre
Willards
Williamsburg
Williamsport
Williamstown
Willingboro
Willingborough
Williston
Willow Grove
Willow Hill
Willow Street
Wilmimgton
Wilmington
Wilton Manors
Wimauma
Winburne
Winchester
Wind Gap
Windermere
Windsor
Windsor Mill
Winfield
Wingate
Winslow
Winslow Township
Winslow Twp
Winter Garden
Winter Haven
Winter Park
Winter Springs
Wintergreen
Wintergreen Resort
Wirtz
Wise
Wittman
Womelsdorf
Wood-Ridge
Woodbine
Woodbine Borough
Woodbridge
Woodbury
Woodbury Heights
Woodford
Woodland
Woodlawn
Woodlyn
Woodlynne
Woodsboro
Woodside
Woodstock
Woodstown
Woodville
Woolford
Woolwich Township
Woolwich Twp
Worcester
Wormleysburg
Worton
Wrightstown
Wrightsville
Wycombe
Wye Mills
Wyncote
Wyndmoor
Wynnewood
Wyoming
Wyomissing
Wyomissing Hills
Yalaha
Yardley
Yeadon
Yeagertown
Yellow Spring
Yoe
York
York Haven
York Springs
York Twp
Yorktown
Youngsville
Yulee
Zellwood
Zephyrhills
Zieglerville
Zion Grove
Zionsville
Zolfo Springs
Subdivision
All Subdivisions
Roney Palace
!Dnp!
"Collins Tract"
"Colwick"
"Meadows, The"
"None Available"
"None"
"Willows"
#
#Miami North
''''''Eagle Trace Sub (Pbi 17-34), Replat Of''''''
'''Hall, Carter & James''
'''Hall, Carter & James'''
'''Millstone Landing Pd Phase 4, 5 & 6'''
'''Pointes #2 Condo, The'''
'''Town Of Concord Condo, The'''
'Citrus Springs Village ''''E'''' Pd'
'Citrus Springs Village ''''F'''' Pd Phase Ii'
(None)
(See Remarks)
(Viking) Southern Colonization
*Approved Permits* 4 Plex 3 Bed 2 Bath
*Courtyards Of Broward Con
*Grand Marquis Condo Home
-
- Section 1
--
----
-0-
.
...
......
0.00
00
00-41-41-16-00-000-5990
000
0000
00000 Section Land
000000
0000000000000000000
0001
000379 - Citrus Springs U
000386 - Citrus Springs Un
000396 - Citrus Springs Unit 22
001474 - Plantation Pines
001888 - U. S. 19 3rd Addition
01053 Central Riverside Sc
014423c2024530390
01478 Fayetteville
02-44-26-04-00029.0110
02/04/00
0225 - Schindler Sub
03548 Lake Mandarin Unit 0
04023
05 57 39 N110ft Of E120ft
07430030067
08202
08210-1660
08260
08360
08361
08510
0X0
0he Carriage Club South C
0ural
1
1 53 41 Shores Ests
1 Hotel & Homes
1 Mi W Of Ephrata
1 Ocean Blvd. Condo
1 Ocean Boulevard Condo
1 Of Palm Springs 2 Condo
1 Royal Palm Way Condo
1 South Side Park
1 Southside Park
10
10 Acre Close To Krome
10 Acre Horse Farm
10 Minutes To The Ocean
10-43-40~ W 249.7 Ft Of E
100 Acre Woods
100 Hidden Bay Condo
100 Las Olas
100 Las Olas Condo
1000 Isl Blvd Williams Is
1000 Isl Blvd Williams Isl Condo
1000 Museum By Zaha Hadid
1000 Williams Island
10000 Plaza Condo-North T
10000 Plaza Condo-North To
10000 Plaza Condo-South T
1005 Meridian Condo
101 Lofts Condo
1010 Brickell Condo
1010 Mass
10210 Lanai Condo
10295 Collins Ave Resdnta
1060 Brickell
1060 Brickell Condo
1060 Brickell Condounit
10th Addn To Richmond Hei
11 53 40 Fla Fruit Land C
11 Of Palm Springs 2 Condo
11-43-40~ N 237.9 Ft Of S
11-43-40~ N 267.9 Ft Of S
11-43-41 E 1/2 Of Se 1/4 Of Nw 1/4 Of
11-43-41, W 1/2 Of Ne 1/4
1100 Millecento Condo
1100 Millecento Residence
1100 Millecento Residences Condo
1100 West Condo
1101 Condo
111 First Delray Condo
1115.000 - Orange Blossom
115 - Jamestowne
1189.00 - Lesiure Lakes Ti
12 53 40 .23 Ac M/L
12 Of Palm Springs 2 Cond
12 South
1200 Hillsboro Mile Condo
1211 Pennsylvania Condo
1218 Drexel Condo
123 Ocean
1231 Penn Inc Condo
1231-1233 Nw 9 Ave
1245 West Ave Condo
1251
12590 Coronado Towers Con
128 Bernardo De Irigoyen M
12th St Manors
13 53 41 N43ft Of S308ft
1300 Ponce Condo
1300 S Miami Avenue Condo
1300 South Miami Avenue Co
1314-16 Condo
1342 Drexel Condo
1390 Ocean
14-43-40~ E 209.6 Ft Of W
1431 Condominium Assoc
1446 Lenox Condo
1455 Michigan Ave Condo
1475 Terra Towers Condo
14th Street Corridor
14th Street Retirement Club
14th Street Townhomes Condo
150 Oceanside
1500 Condominiums
1500 Ocean Club Condo
1500 Ocean Drive Condo
1504 - Port Charlott
1510 Condo
1515 Flagler Condo
1523 West Condo
1525 - Port Charlotte Sub
1534 Port Charlotte Sub11
1535 Meridian Ave Condo
155 Sunrise Condo
1551 Condo
1570 - Port Charlotte Sub
15701 Collins Condo
1573- Port Charlotte Sub 26
1584 - Port Charlotte Sub
1585 - Port Charlotte Sub
1588 - Port Charlotte Sub
159 Ne 6th St Condo
159 Ne 6th Street Cond
159 Ne 6th Street Condo
16 Of Palm Springs 2 Cond
160 - Lynnhaven
160 Marina Bay
1600 Prince Street
1625 South Ocean Condo
16700 Condo
16th Street Heights
17 Ave Manor
17+ Acres
1750 James Apartments Con
1771-Port Charlotte Sub 45
17749 Collins Avenue Cond
1785-1795 Condo Inc
17gables Condo
17th Ave Manor 1st Addn
17th Ave Manor 2nd Addn
17th Terrace Condominium
18 - 34th Street
1800 Biscayne Plaza Condo
1800 Club Condo
1800 Meridian Condo
1800 Wilson
1818 Meridian House Condo
1820 James Ave Condo
18250
18555 Collins Avenue
18555 Collins Avenue Cond
18555 Collins Avenue Condo
18975 Collins Condo
18th Hole
18th Hole At Inverrary
18th Hole At Inverrary Co
18th Hole At Inverrary Condo
18th To 34th Street
19 Acres W Kennel,House,Et
19-43-37, Sw 1/4 Of Sw 1/4 (Less Sw 1/4 Of Sw 1/4
1925 Calais Drive A Condo
198 Terrace Plat
1]
1st Addn Biscayne Lawn
1st Addn Carol City Lake
1st Addn Granada Place
1st Addn Pinewood Pk
1st Addn To Lawndale
1st Addn To Magnolia Sub
1st Addn To Newton Height
1st Addn To Panuleta Gard
1st Addn To Pinewood Park
1st Addn To Robles Garden
1st Addn To Rotemi Estate
1st Addn To Royal Oaks
1st Addn To Town Of
1st Replat Lake Charles
1st Ward
1st Westmoreland Addn
2 Of Palm Springs 1 Condo
2 Of Palm Springs 2 Condo
2 Ward
20 Acre Woods
200 East
200 East Palmetto Park Condo
200 Leslie Condo
2000 Condo At Sloans Curve
2000 Isl Blvd
2000 Isl Blvd Williams Is
2000 Isl Blvd Williams Isl Condo
2000 Ocean Condo
2015 Kingswood
2020 Lofts Condo
2038.000 - Orange Villa
2072 Ne 169 St Corp Condo
208 Meridian Condo
2080 Ocean Drive Condo
216010 Savannah Rd N
21st Century Homes 2nd Se
21st Century Homes 3rd Se
21st Century Homes 4th Se
220 North
2200 Brickell
2200 Fort Lauderdale Beac
2200 Fort Lauderdale Beach
2201 Collins Ave Condo
225 District
227 Ne 2nd Street Condo
22nd Ave Heights
23 Biscayne Bay Condo
23-02 Wicomico Co Northeast
2300 Estates - 1 Acre
234 Estates
235 Antilla Condo
236 Fifth Avenue Condo
236 San Martin Depto:Meta
2399 Collins Avenue
24-45-38 Unplatted Acreage
2400 South
246 Ne 6th Avenue Condo
24e 31
250 Wynwood Condo
259 Worth Avenue Condo
2591 S State Rd 7
26 Edgewater Condo
26-42-40~ W 204.6 Ft Of E 4771.8 Ft Of N 243 Ft O
2600 Isl Blvd Williams
2600 Isl Blvd Williams Is
2655 South Bayshore Drive
2678 Tigertail Condo
2700 North Ocean Condo
2711 Hollywood Beach Cond
2711 Hollywood Beach Condo
2774 S. Ocean
28-49-42
2800 Isl Blvd Williams Is
2804 Mable Ave N Lehigh Ac
281 Prime Condo
29 Indian Creek
29 Indian Creek Drive
29 Santillane Avenue Cond
2901 Collins Condo
2nd
2nd Addn Essex Village
2nd Addn To Baracoa
2nd Addn To Calusa Club E
2nd Addn To Palm Springs
2nd Addn To Palm Springs V
2nd Ocean Front Sub
2nd Rev Pl Of Industrial
2nd Rev Pl Saratoga Heigh
3
3 Of Palm Springs 1 Condo
30 Thirty North Ocean
30 Thirty North Ocean Con
30 Thirty North Ocean Condo
300 Biscayne Blvd Way
300 Biscayne Blvd Way Cond
300 Collins Condo
3000 Isl Blvd Williams Is
3000 Waterside
3030 Aventura
3030 Aventura Condo
31 Ave
31 Of Palm Springs 3 Condo
31-42-41~ S 252.9 Ft Of N
31-42-41~ W 204.6 Ft Of E
3100 Ne 1st Avenue Condomi
31400 Monterey Rd
32 52 42 Biscayne Lawn Ex
3200 South Ocean A Seagate Condo
33 57 38 7.50 Ac
33 Intracoastal Condomini
33-48-42 W 50 Of E 385 O
33-48-42 W 50 Of E 435
33-48-42 W 50 Of E 550 Of S1/3 Of N3/5 Of Sw1/4 Of
330 Condos A Condo
3315 Tower Condo
34
3401 Midtown Condo
3408 61st St W
344 Meridian Ave Condo
35
350 Las Olas Place Condo
350 Meridian Condo
350 So Shore Dr At Villag
353 Sunset Las Olas Condo
3550 South Ocean Condo
36 Of Palm Springs 3 Cond
36 Of Palm Springs 3 Condo
36-42-40~ S 242.9 Ft Of N 4502.2
36-42-40~ S 272.9 Ft Of N 4016.4 Ft Of E 204.6 Ft
360 Condo
360 Condo A
360 Condo B
360 Condo C
3609 17th St W Lehigh Acre
3621 South Ocean Villas Condo
368 Park Lane
36th St Comm Center
3850 Federal
3881 West Flagler Condo
398 Ne 5th Street Condo
3er Lote De Este A Oeste
3rd Addn To Baracoa
3rd Addn To Pinehurst Vil
3rd Addn To Starlight
3rd Addn To Westbrooke Su
4 Of Palm Springs 2 Condo
4 Seasons
4 Seasons @ Millvill
4-46-43~ Nly 120 Ft Of Sly 148.52 Ft Of Wly 138.72
400 Sunny Isles Condo
400 Sunny Isles Condo Eas
400 Sunny Isles Condo East
400 Sunny Isles Condo Wes
400 Sunny Isles Condo West
400 Sunny Isles Marina Co
400 Sunny Isles Marina Con
400 Sunny Isles Marina Ul7
4000 Isl Blvd Williams Is
4001 North Ocean Condo
401 Blu Of North Beach Co
4010 South Ocean
4010 South Ocean Condo
4010 South Ocean Condo Ho
4100 Condo
4111 South Ocean Drive Co
4111 South Ocean Drive Condo
422 Corridor
4250 Biscayne Boulevard
4250 Biscayne Boulevard C
4250 Biscayne Boulevard Condo
434 21st Street Condo
45 Avenue Condo
45 Hendricks Condo
45 Ocean Condo
45 Street Village
450 Condo
4600 Duke
4620 North Park Ave
4701 North Meridian
4701 North Meridian Condo
4838.000 - Hidden Creek Vi
4841.00 - Orange Blossom
484742 - Mayflower Way Sec
494129ae2050
4mg | Homestead Revised Ma
4th Addn To Palm Springs
4th Addn To Royal Oaks
4th Avenue Extension To H
5 Acres And Indepe
5 Palms
50 Biscayne Condo
500 Brickell
500 Brickell East Condo
500 Brickell West Condo
5000 Bayview At Fisher Is
5000 North Ocean Condo
501 1st
501 1st Ave
501 First
501 First Residence
501 First Residences
501 First Residences Condo
501 Residences
501 Residences Condo Miami
503-508 75th Street Condo
505 Deerfield
505 Deerfield Condo
5050 Condo
5050 Condominium
50500 Fed Hwy Indian St To Hobe Sound
5100 Bayview At Fisher Is
51133 - Northumberland
5141-17-Ac-0070
51500 Kanner W Of 95
522 Business Park
525 Meridian Condo
5252 Paseo Condo
52nd Street
53 54 39 10.00 Ac
5300 Paseo
5300 Paseo Condo
530500- Outdoor Resorts Of Chokoloskee Island A Co
5350 Park Condo
54 St Bus Center Sub
5411 - Sugarmill Woods (Oak Village North)
544 Michigan Ave Inc
544-548 Fernwood Condo
55 Merrick Condo
551 Flb Condominium Hotel
551 Flb Condominium Resid
551 Flb Condominium Residential
551/557 Michigan Condo
5600 Condo
575 South Condos
580 72nd Street Condo
5838 Condominium
593845 Harbor Estates, St Lucie Sett
596 Fernwood
5ar
5th Addn To Bisc Yacht &
5th Addn To Richmond Hgts
5th Addn To Royal Oaks
5th Ward
6
6 Of Palm Springs 2 Condo
6-49-43 Par Of Land
60 Acre Reserve
60 Acres
6000 Indian Creek Condo
6080 Collins Condo
610 Clematis Condo
626 Condominium
62nd Street Heights
63 Nobe Condo
631 Euclid Avenue Condo
641 Espanola Way Inc Cond
644 Meridian Building Con
645 Michigan Ave Condo
650-700 Beach Road
6642022094711
665000 Stuart Woods Ranch Hosanah Ln
67300 Sunrise/Sunset Groves
6th Addn To Hialeah
6th Addn To Lawndale
6th Addn To Royal Oaks
70
7000 Isl Blvd Williams Is
7000 Isl Blvd Williams Isl Condo
701 Euclid Gardens Condo
713 Collins Condo
72 Park
72 Park Condo
72 Park Miami Beach
72 Park Residences
72park Residences
730081 Poinciana Gardens Nw Pocket
734 Michigan Condo
7400 Oceanside At Fisher
751 Collins Condo
760 Condo
7600 Oceanside At Fisher
7636 Abbott Avenue Condo
772800-Marco Beach Unit
78
7915 Byron Avenue Condo
7th Addn To Richmond Heig
7th Ave Highlands
7th Avenue Highlands
7th Ward
8 Of Palm Springs 2 Condo
800 North Fiske Condo Apts
800 Place Condo
8000 Condo
801 Meridian Ave Condo Ap
801 Sma Designer Suites C
801 Sma Residence Condo
801 Sma Residences
801 Sma Residences Condo
8101 Conn Ave
821 Jefferson Condo
835 Meridian Condo
87
8701 Collins Ave Condo
8705 Hampshire Dr Condo
8900 Interim-Await Specifi
8hundred North
8th Street Mews
8th Street Mews Condo
8th Ward
9 Of Palm Springs 2 Condo
900 Biscayne Bay
900 Biscayne Bay Condo
900 North Washington Street Condominiums
915 Bldg Inc Condo
918 Ocean Condo
918 Ocean Drive Condo
919 Michigan Condo
921 Jefferson Ave Condo
921 Meridian Ave Apts Condo
929 On Michigan Condo
9500 Oceans Condo
9674 Golfview Villas Cond
99
9900 West
9th Ward
: Cresthaven Villas
: Lake Clarke Gardens Condo 17 Cond Decl In
?
A 2.41 Acre Tract Out Of Ne 1/4 Of Se 1/4-Fully
A B At Tamiami Trail Phas
A Garden Walk
A H At Turnpike South
A H At Turnpike South Sec
A H Turnpike South
A J Bendle Sub
A J Bendles
A Melvin Lewis
A O Dille Farm
A Plat Of Beach House Estates
A Replat Of A Portion Of
A S C Tr
A W Gilchrists Sub
A. A. Berrys Plat
A.F. Merritt
A.H At Braddock
A.H. At Turnpike South Fi
A.H. At Turnpike South First Addition
A0
A12006646at Portofin
Aaron Lee's Map Of Fort Pierce
Aaronsburg
Aasfair Meadows
Ab At Tamiami Trail Phase
Abaco Village A Condo
Abaco Village F Condo
Abacoa Town Center 3
Abae Hotel
Abbey Downs
Abbey Lane
Abbey Park 1
Abbey Park Gardens I Cond
Abbey Park Gardens I Condo
Abbey Village
Abbeyville Manor
Abbington
Abbington Farms
Abbington Pud
Abbots Woods
Abbott By The Sea Condo
Abbott Commons
Abbott Forest
Abbott Gardens Condo
Abbotts Pond Acres
Abbottstown
Abel Homes At Keys Winds
Abel Lake Forest
Aberdeen
Aberdeen / Oxford Place
Aberdeen / Stratford
Aberdeen 12
Aberdeen 13
Aberdeen 14
Aberdeen 15
Aberdeen 16
Aberdeen 17
Aberdeen 18
Aberdeen 22
Aberdeen 24
Aberdeen 25
Aberdeen 26
Aberdeen 27
Aberdeen 3
Aberdeen 4
Aberdeen 7
Aberdeen 8
Aberdeen Arms
Aberdeen Arms Condo
Aberdeen Cambridge
Aberdeen Country Club
Aberdeen East / Harbours
Aberdeen Estates
Aberdeen Hamptons
Aberdeen Hills
Aberdeen Overlook
Aberdeen/ Addison Green
Aberdeen/ Stratford Condo
Abidjan Estates
Abingdon
Abingdon Estates
Abingdon Row
Abington
Abington Woods
Abitare Villas Condo
Abram's Chase
Abrams
Abrams Crossing
Abrams Pointe
Absecon
Absecon City
Absecon Est
Absecon Hlds
Absecon Shores
Abyssinia Park
Acacia Groves
Acacia Villa
Academy
Academy Acres
Academy Award Homes Secti
Academy Award Sec 4 Repla
Academy Ct
Academy Gardens
Academy Heights
Academy Hill
Academy Hills
Academy House
Academy Manor
Academy Street
Academy Woods
Acadia
Acadia Landing
Acadia Sub
Acapulco Sub
Accident
Accokeek
Accokeek Acres
Accomack
According
Accotink Bluff Estates
Accotink Heights
Achey Lane
Achsah Acres
Ackerman Tract
Ackley Subd
Acme Gulfair
Acme Gulfair 1st Addn
Acme Gulfair 2nd Addn
Acorn Farms
Acosta
Acqualina Ocean Residence
Acqualina Ocean Residences &
Acreag0002
Acreage
Acreage & Unrec
Acreage & Unrec (Juno Beach)
Acreage & Unrec (The Acreage)
Acreage & Wildwood
Acreage Header
Acreage Loxahatchee
Acreage Not Classified Ag
Acreage Of Royal Palm Beach
Acreage/Loxahatchee
Acrehome Park
Acrehome Park First Add
Acrehome Park Second Add
Acrehome Park Third Add
Acres Lake Estates
Acreslee
Acropolis
Acton
Acton Village
Actons Landing Condos
Adagio
Adagio 1st Addn
Adagio At Central Park Co
Adagio Fort Lauderdale Be
Adagio On The Bay Condo
Adagio Sub
Adams
Adams Commerce Center
Adams County
Adams Court
Adams Crossing
Adams Farm
Adams Lakeside Ind Park
Adams Landing
Adams Morgan
Adams Subdivision
Adams Walk
Adamstown Commons
Add To Buckhead Ridge Sub
Addilyn - Kingfisher Estates
Addington Reserve
Addis Ababa
Addison
Addison Court
Addison Heights
Addison On The Ocean
Addison On The Ocean In B
Addison On The Ocean In Boca Raton Condo
Addison Pointe At Boca Raton All Ages
Addison Pointe At Boca Ra
Addison Pointe At Boca Raton Condo
Addison Reserve
Addison Reserve Pars 1 And 2
Addison Reserve Pars 7 And 8
Addison Woods
Addison Woods Plat 1
Addison Woods Plat 2
Adelphi
Adelphi Knolls
Adelphi Terrace
Ademar Park Amd Pl
Adj Andrews
Admiral
Admiral At Jupiter Yacht Club Condo
Admiral Condo Apartments Inc
Admiral Farragut Condo
Admiral Heights
Admiral Towers Condo
Admiral's Landing
Admirals Cove
Admirals Cove Par C
Admirals Landing
Admirals Point
Admirals Port Condo
Admirals Port Condo - East Bldg
Admirals Port Condo - West
Admirals Port Condo East
Admirals Port Condo West
Admirals Port Condo West Bldg
Admirals Port Condo-East
Admirals Ridge
Admirals Square
Admirals View
Admirals Walk
Admiralty Towers
Admiralty Towers Condomin
Admiralty Towers Condominium
Admore
Adnell Sub-Plat Five>
Adnell Woods
Adobe Casa Court
Adriaguado Sub
Adventure Farms
Adventure Homes
Advocate Hill Farms
Aegean
Aero Acres
Aero Club
Aesthatic Apartments
Aesthetic Apartments Condo
Aesthetic Apts Condo
Afro-American Subdivision
Afton
Afton Crest
Ag Nonsub
Agri/Residentia10.22 Acres
Agricopia
Agricultural Fair
Agricultural Residential District
Agua Dulce Condo
Aguirres At Westwood Lake
Aibonito
Aigburth
Ainslie At Century Village Condo
Airage Village
Airi Acres
Airmont
Airport Additon
Airville
Airville/Delta
Aisling
Ajauela, Costa Rica
Akai Estates
Akoya
Akoya Condo
Akron Borough
Al Andalus
Al Barari
Alabama
Alabama Grove Terrace
Aladdin City
Alamanda Vista Revised Pl
Alamanda Vista Subdivision
Alameda
Alameda By The Lake
Alameda Jardins Condo
Alameda Tower 2 Condo
Alana Bay Harbor Dr
Alana Condo
Alaqua Condo
Alba
Alba Palm Beach
Alba Subdivision
Alban Park
Albemarle Square
Albert Courts
Albert Lakes Garden
Albert Lakes Garden Unrec
Albidale
Albin Estates
Albin Village
Albion
Albrightsville
Albury Heights
Alcala Plaza Condo
Alcazar Villas Condo
Alcova Heights
Aldan
Aldea Zama
Aldea Zama A Tulum
Alden Manor
Alden Park
Alden Place
Aldens Sub
Alderleaf Meadows
Alderwood Run
Aldie
Aldie Estates
Aldino Stepney
Alegria Village Condo.
Alexander Towers Condo
Alexander's Crossing
Alexanders Chase
Alexandra Village / Platina
Alexandra Estates
Alexandra Viilage / Platina
Alexandra Village / Platina
Alexandra Village Condo
Alexandra Village Condo Platina
Alexandra Village Condo/Platina
Alexandras Grove At Belmont
Alexandria
Alexandria House
Alexandria Knolls
Alexandria Square
Alfred E Wilson Unrec Sub
Algonquin
Alhambra At Pembroke Pines
Alhambra Courts Condo
Alhambra Heights
Alhambra Heights Sec 2
Alhambra Place Condo
Alico
Aliki Tower Condo
Alina 210 Boca Raton Condo
Alina 220 Boca Raton Condo
Alina Boca Raton
Alina Boca Raton Condo
Alina Residences
Alison's Ridge
Allapattah Gdns
Allapattah Highlands Add
Allapattah Sch Sub
Allapattah Sch Sub 1st Ad
Allapattah View
Allard Sub P B In
Allegany Highland Estates
Allegany Station
Allegheny
Allegheny Mountain Reserve
Allegheny West
Allen Et Al 500 Acre Tract
Allen Glen
Allen Ridge
Allendale
Allendale Sub Db 943-562
Allentown
Allentown Borough
Allentown City
Allentown Estates
Allentown Farms
Allenwood
Allenwood Acres
Allenwood Add No 2
Allenwood Estates
Alligator Sub
Allington Towers Condo
Allington Towers North Co
Allington Towers North Condo
Allison Hill
Allnutt Farms Estates
Alloway Lake
Allport
Alluvium
Alluvium Woods
Allview Estates
Allwodd Manor
Allwood
Allwood Manor
Alma Smith
Almar Estates Resub
Almar Sub 1st Addn
Almendares
Almeria Gardens Condo
Almost Heaven Acres
Aloha Gardens Condo
Alora Luxury Condo Association
Alpha At Indian Spring
Alphaville Condo
Alphaville Townhomes
Alpine
Alpine Acres
Alpine Heights
Alpine Lake Resort
Alpine Shores
Alpine Village
Alpine Woods Estates No Ii
Alpine Woods Villa No V C
Alta Terra
Alta Vista
Alta Vista Condo
Alta Vista Terrace
Altaloma Heights
Altamira
Altamira / Lagos
Altamira At N Hutchinson Island, A Condominium
Altamira By Lennar
Altamira Malaga
Altamira/ Lagos
Altamont Gardens
Altavista Park Sec 1
Altessa At Wilton Manors
Alton
Alton Beach 1st Sub
Alton Beach Bay Front Re-
Alton Beach Realty Co Sub
Alton Neighborhood
Alton Neighborhood 1
Alton Neighborhood 2
Alton Neighborhood 3
Alton Neighborhood 4
Alton Star Condo
Altoona
Altoona Beach
Altos De Miami Condo
Altos Del Mar #6
Altos Del Mar 05
Altos Del Mar No 1
Altos Del Mar No 3
Altos Del Mar No 4
Altos Del Mar No 5
Altos Del Mar No 6
Altos Del Mar No. 5
Alva
Amalfi In The Gables Cond
Amalyn
Amanda Estates
Amanda Place
Amani Village
Amara
Amaretto
Ambar Residences
Ambassador
Ambassador I Condo
Ambassador Ii Corp
Ambassador North Co-Op
Ambassador Park
Ambassador Place Condo
Ambassador South Co-Op
Ambassador South Dev Corp
Ambassador Square Condo
Ambassadors
Ambassadors East
Ambassadors V North Condo
Amber Bay
Amber Fields
Amber Hill
Amber Meadows
Amber Oaks
Amber Pointe
Amber Ridge
Amber Spring Condominiums
Amber Woode
Amber Woods
Amber-Ruby Cove Plat
Amberfield
Amberlea At South Riding
Amberleigh
Amberleigh At The Ar
Amberleigh Farms
Amberley
Amberly
Amberson
Amberson Valley
Amberson Valley Estates
Ambertowne
Amberwood
Amberwood Unit 3
Amblebrook
Ambler
Ambleside
Amcelle Acres
Amd Edgewater Manors
Amd Miami Suburban Ac
Amd Pl Adele Heights
Amd Pl Bay Ridge
Amd Pl Biscayne Pines
Amd Pl Griffing Biscayne
Amd Pl Miami Shores Sec 5
Amd Pl Of 2nd Addn Of Pin
Amd Pl Of 2nd Ocean Front
Amd Pl Of 2nd Ocean Front Sub
Amd Pl Of Belmar
Amd Pl Of Browns Sub
Amd Pl Of First Ocean Fro
Amd Pl Of Journeys End
Amd Pl Of Miami Sub Acres
Amd Pl Of Summerland
Amd Pl Of Tamiami Groves
Amd Plat Of High Pines
Amd Plat Of Mia Suburban
Amd Plat Of Sunset Lake S
Amd Plat Of Tropics
Amelia National
Amelia Park Condo
Amelia Planation Sub
Amelia Square
Amelung Estates
Amend Plt El Prado Countr
Amend Plt-Lakes By The Ba
Amended & Extended Plat O
Amended Plat Of Blks 12 13 & 14
Amended Plat Of Flagler G
Amended Plat Of Flagler T
Amended Plat Of Flagler Terr
Amended Plat Of Jennings Cove Subdivision
Amended Plat Of Stouder's Subdivision
Amended Plat Of Sumters Add
Amended Sub Of 17-50-42 1
Amera Trail
American Express Tract
American Gardens Condo
American Homes
American Homes 1st Add
American Homes 1st Addn
American Homes At Boca Ra
American Homes At Boca Raton
American Homes At Boca Raton 3
American Homes At Boca Raton 4
American Homes At Boca Raton 9
American University Park
American Way
Americana Centre
Americana Finmark
Americana Village Condo
Americas At Miller
Americas On The Park Condo
Ameritrail Section Iii
Ameritrail Section Two
Ameritrail Section Two 151
Ames Court
Amesbury
Amesbury Circle At Greenview Shores
Amherst
Amidon
Amissville
Amitie 2
Amity Gardens
Amnd Miami Suburban Acres
Amnd Plat Of Miami Sub Ac
Amnd Plat Of Miami Suburb
Amrit Ocean
Amrit Ocean Resort & Residences
Amrit Ocean Resort 2 Condo
Amrit Ocean Resort Condo
Amyclae Estates
Amyclae Village
An Unrecorded Subdivision
Anaco South Estates
Anacostia
Anacostia Historic District
Anastasia Coral Gables Co
Anchor Bay Club
Anchor Bay Club Condo
Anchor Condominium
Anchor Point
Anchorage
Anchorage At Miami Lakes
Anchorage East At Jonathans Landing Condo
Anchorage North At Jonathans Landing Condo
Anchorage On The St Lucie A Condo
Anchorage On The St Lucie, A Condominium
Anchorage Poynte
Anchors Run
Ancient Oak
Ancient Oak South
Ancient Oaks
Ancient Oaks R V Residenc
Ancient Oaks Rv Residence
Ancient Oaks Rv Resort No Ii
Ancient Oaks Rv Resort No V
Ancient Oaks Rv Resort No.
Ancient Oaks Rv Resort No. 1
Ancient Oaks Rv Resort No. Iv
Ancient Tree
Ancora Residences
Andalucia
Andalucia Pud Plat 4
Andalucia Pud Plat 6
Andalusia
Andalusia Condo Residence
Andare
Andare By Pininfarina
Anderson Heights
Anderson Villas
Anderson's Green
Andersons Sub-Sub Of Trac
Andes Condo
Andor Plaza Condo
Andoric
Andoric Apts Co-Op
Andorick Acres
Andorra
Andorra Woods
Andover
Andover 1st Addn
Andover 3rd Addn
Andover At Wycliffe Condo
Andover At Wycliffe Golf And Country Club
Andover Condos
Andover Heights
Andover Heights Condo I
Andover Sec 2
Andrade Sub
Andre Park
Andres
Andrew Hills
Andrews And Richards Subdivision
Andrews Avenue Townhomes
Andrews Lake Ests
Andrews Manor
Andrews Park
Andrews Park 2nd Sec Amd
Andros Isle
Andros Isle Par B
Andros Isle Par C
Andros Isle Par D-1
Andros Isle Par E-2 1
Andros Isle Par E-2 2
Andros Isle Par F
Andros Isles
Andros Village
Andros Village A Condo
Andros Village B Condo
Andros Village C Condo
Andros Village E Condo
Anfield At Malvern
Angelica Gardens At Lakes
Angelica Woods
Angelina Mia Estates
Anglers At Sombrero
Anglers Cove
Anglers Cove Condo
Anglers Nest
Anglers Park
Anglers Park Shores
Anglers Reef
Anglo-American Plat One
Anglo-American Plat Two
Angola Beach
Angola By The Bay
Angola Crest Ii
Angola Estates
Angola Neck Park
Ann Acres
Anna Coves
Anna Woods Estates
Annalee Heights
Annandale
Annandale Acres
Annandale Gardens
Annapolis
Annapolis Overlook
Annapolis Preserve
Annapolis Roads
Annapolis Towne Centre
Annapolis Woods
Anne Arundel
Annemessex Ridge
Annen Woods
Annendale
Annesley By The Bay
Anni Venti Condo
Annville
Annville Historic Dist.
Ansaya At Aldea
Anscroft
Anselma
Ansonia Gardens
Ant Hill
Anthem Park Ph 3a
Anthony Groves Ph 1
Anthony Groves Ph 2
Anthonyville
Antietam Acres
Antietam Commons
Antietam Manor
Antietam Watch
Antigua And Barbuda
Antigua At Cntry Clubof M
Antigua At Oasis
Antigua Cove
Antigua Point
Antigua Village I A Condo
Antigua Village I B Condo
Antigua Village I C Condo
Antigua Village I D Condo
Antigua Village I E Condo
Antigua Village Ii A Cond
Antigua Village Ii B Condo
Antigua Village Ii C Condo
Antigua Village Ii D Condo
Antigua Village Ii E Condo
Antillia
Antillia Hoa
Antioqua
Antique Row
Anton Farms
Anton North
Antrim
Antrim Crossing
Antrim Twp
Anvil Hills
Anvil Park
Ao-330
Apartments At Timberlake
Apartments At Timberlake Condo
Apartments Enchante Condo
Apex
Apex At Avenir
Apex At Park Central
Apex At Park Central Cond
Apl Red Hill Farms Unit A
Apl Red Hill Farms Unit C
Apogee Beach Condominium
Apple Creek
Apple Creek Farms
Apple Glen Estates
Apple Greene
Apple Grove
Apple Harvest
Apple Hill
Apple Knolls
Apple Mt Lake
Apple Mt Lake West
Apple Pie Hill
Apple Ridge
Apple Tree Corner
Apple Valley
Apple Wood
Appleby Sub
Applecross
Applegate Condo
Applegate North
Applegreen
Applegreen Condo Apts 1
Applegreen Condo Apts 3
Applegreen Sub
Applegreen Subdivision
Appletown Estates
Appletree Hill
Appleview Estates
Appleville East
Appleville West
Applewalk
Applewalk Condo
Applewood
Applewood 2
Applewood Village
Applewood Village 2
Applewood Village I-A Condo
Applewood Village I-C Con
Applewood Village Ii
Applewood Village Ii-D Condo
Applewood Village Ii-E
Applewood Village Ii-E Condo
Applewood Village Ii-F Co
Applewood Village Ii-F Condo
Applewood Village Iii-B Condo
Applewood Village Iv
Applewood Village Iv-A Co
Applewood Village Iv-B Condo
Applewood Village Iv-E Condo
April Mist Condo
April Song Condo
Aqua At Allison Island
Aqua Bella
Aqua Bonita Park Sec
Aqua Lofts
Aqua Marine
Aquabella North
Aquabella North Rep
Aquabella North Replat
Aquabella Section One
Aquabella Section Two
Aquablu
Aquablu Fort Lauderdale C
Aquablu Fort Lauderdale Condo
Aqualuna Las Olas Condo
Aquamar Las Olas
Aquamar Las Olas Condo
Aquanique Ocean Club, A Condominium
Aquarius
Aquarius At Bel Pre
Aquarius Condo
Aquarius Condominium
Aquasol Condo
Aquavilla
Aquazul Condo
Aquetong
Aquia Creek
Aquia Harbour
Aquia Hills
Aquia Overlook
Arabella Reserve
Aragon Bellagio Villas
Aragon Condo
Aragon Phase 1a Condo
Aragon Plaza Condo
Aragon Sec One
Aravale
Arbela
Arbor Coconut Grove
Arbor Courts
Arbor Estates
Arbor Gate
Arbor Gate Retirement Com
Arbor Glen 1
Arbor Green
Arbor Greene
Arbor Hills
Arbor Keys Condo
Arbor Meadows
Arbor Parc / Me
Arbor Point
Arbor Reserve
Arbor Walk
Arbor-Lyn
Arbordayle
Arbordeau
Arbore Apartamentos
Arboretum
Arboretum At Davie
Arboretum In The Grove Co
Arborgate
Arborlea
Arbors At Monroe
Arbors At Providen
Arbors Condo
Arbors Of Arlington
Arborview
Arbory
Arbory Condo Phase Six-R
Arbour Manor
Arbours
Arbours At Eagle Point
Arbours At Morgan Cr
Arbours Ii Of Palm Beach
Arbours Ii Of The Palm Beaches Condo
Arbours Of The Palm Beach
Arbours Of The Palm Beaches
Arbours Of The Palm Beaches Condo
Arbre Park
Arbuckle Branch Ranchettes
Arbutus
Arc 3409
Arcadia
Arcadia Shores
Arcadia Springs
Arcadia Station
Arcadia Subdivision - Phase 1
Arcadia Village
Arcadia-Beverly Hills Historic District
Arcanum
Arch Creek Ests
Arch Creek Highlands
Arch Creek Landing Condo
Arch Creek Pines
Arch Creeks Estates
Arch Greek Estates
Archers Glen-Plat 1>
Archers Rock
Archertown
Archipelago
Archwood Amd Plat
Archwood-Amd Plat
Arcola Gardens
Arcola Town Center Condo
Arcona
Arden
Arden District
Arden On The Severn
Arden Post
Arden Pud Pod A East & Pod B East
Arden Pud Pod A West & Pod B West
Arden Pud Pod C North
Arden Pud Pod C North Lt 213
Arden Pud Pod C South
Arden Pud Pod D Southeast
Arden Pud Pod D Southwest
Arden Pud Pod E South
Arden Pud Pod F East
Arden Pud Pod G North
Arden Pud Pod G South
Arden Pud Pod H North
Arden Pud Pod H South
Arden Pud Pod I North
Arden Pud Pod I South
Arden Pud Pod J
Arden Pud Pod K
Ardencroft
Ardmore
Ardmore Crossing
Ardmore Estates
Ardmore Park
Ardmore Terrace
Ardrossan
Ardsley Sub
Ardsley West
Arelauquen Country Club
Arenal Sub
Arendtsville
Arendtsville Borough
Areta Estates Sec 1
Areta Estates Sec 4
Areta Ests Sec 6
Argentina
Argyle Club Estates
Argyle Hills
Argyle Terrace
Aria At Las Olas Condo
Aria On The Bay
Aria On The Bay Condo
Aria Park
Aria Reserve
Aria Reserve Condo
Aria Reserve Miami
Aria Reserve North
Aria Reserve North Condo
Aria Reserve North Tower
Aria Reserve South
Aria Reserve South Condo
Aria Reserve South, A Condominium
Arielle View
Aris
Arissa Place Condo
Arista Park Condo
Aristocrat
Aristocrat Ocean
Aristocrat Ocean And
Aristocrat Ocean And Lakeview Condominium
Aristotle Sub Phase Iv
Ark Haven
Arlen Beach Condo
Arlen House Condo
Arlen House East
Arlen House East Condo
Arlen House West Condo
Arlington
Arlington Court
Arlington East Unit 02
Arlington Forest
Arlington Heights
Arlington Hills
Arlington Oaks
Arlington Park
Arlington Park 11-52 B
Arlington Place Wpb In
Arlington Ridge
Arlington Run
Arlington View
Arlington Village
Arlingwood
Armagh
Armani Beach Residences
Armani Casa
Armfield Estates
Armiger
Armistead Gardens
Armitage Place No 1a Condo
Armitage Place No 3 Condo
Arnell Creek
Arnold
Arnold Acres
Arnold Ridge
Arnolds Park Auditor's Pla
Aronimink
Aronimink Estates
Aroowhead Lakes
Arora Hills
Arpina Valley
Arrayanes
Arrington Heights South
Arrington Woods
Arrow B Ranch
Arrowhead
Arrowhead Lakes
Arrowhead Condo No I
Arrowhead Condo No Ii
Arrowhead Condo No Iii
Arrowhead Condo No Iv
Arrowhead Condo No Iv Unit 307
Arrowhead Condo No V
Arrowhead Condo No Vii
Arrowhead Condo No Viii
Arrowhead Estates
Arrowhead Golf & Tennis
Arrowhead Golf & Tennis C
Arrowhead Golf & Tennis Club
Arrowhead Golf And Tennis
Arrowhead Lake
Arrowhead Lakes
Arrowood
Arrowwood Condo
Art Museum Area
Artbilt Homes
Arte Surfside
Artech
Artech Residences At Aven
Artech Residences At Avent
Artech Residences At Aventura Condo
Artecity Governor Condo
Artepark North Condo
Artepark South Condo
Artesia
Arthur Lusby Estates
Artillery Ridge
Artiste
Artistry
Artistry Palm Beach
Artistry Replat
Artists Walk
Arts District Hyattsville
Aruba Village A Condo
Aruba Village E Condo
Aruba's Atlantic 360
Arundel
Arundel Forest
Arundel Mobile Village
Arundel On The Bay
Arundel Village
Arvilla Condo
Asbury Meadows
Asbury Park
Asbury Pointe
Asbury Woods
Ascot Park
Ash Grove
Ashberry
Ashbourne Hills
Ashbourne Meadows
Ashbrook
Ashbrook Place
Ashbrook Village
Ashbrooke
Ashburn Farm
Ashburn Knolls
Ashburn Station
Ashburn Village
Ashburton
Ashburton Historic District
Ashbury House
Ashbury House East
Ashby
Ashby A Condo
Ashby C Condo
Ashby Commons
Ashby D Condo
Ashby Heights
Ashby Mt. Jackson
Ashbys Place
Ashcombe Farms
Ashcombe Farms West
Ashdale-Birchdale
Asher Park
Ashford
Ashford Glen
Ashford Grande
Ashford Oaks
Ashford Plat 1
Ashland
Ashland A Condo
Ashland C Condo
Ashland Glen
Ashland Meadows
Ashland Terrace
Ashland Village
Ashlar Hill
Ashlawn Hill
Ashleigh
Ashleigh House Condo
Ashleigh Park
Ashley
Ashley Apartments Condomi
Ashley Arms Condo
Ashley B Condo
Ashley Crossing
Ashley Green
Ashley Hall Condo
Ashley Lakes North
Ashley Lakes Subdivision
Ashley Manor
Ashley Ridge
Ashley Ridge Iii
Ashley Run
Ashmans Hope
Ashmont
Ashmont Condominium
Ashmont Condominium E
Ashmont Condominium F
Ashmont Condominium G
Ashmont Condominium I
Ashmore At Germanown Community
Ashton
Ashton Condo
Ashton Heights
Ashton Leas
Ashton Pond
Ashton Village
Ashton Woods
Ashworth
Asia Condo
Asoka Condo
Aspen
Aspen At Pr. Meadows
Aspen At Princeton M
Aspen East
Aspen Estates West
Aspen Forest Ii
Aspen Glen
Aspen Glen Condo
Aspen Green
Aspen Greens
Aspen Hill
Aspen Hill Farms
Aspen Hill Park
Aspen Hills
Aspen Knolls
Aspen Lake Linganore
Aspen Meadows
Aspen North At Lake Linganore
Aspen Park
Aspen Ridge
Aspen Run
Aspen Woods
Aspenwood
Aspers
Assateague Pt Resort
Assembly Point Sub
Assessor's Map Of N Part
Assessor's Map Of N Part Of Fort Pierce
Asten Woods
Aston Martin
Aston Martin Condo
Aston Martin Res
Aston Martin Residence
Aston Martin Residences
Aston Mills
Astonia North
Astor Condo
Astor Creek
Astor Creek Golf
Astor Creek Golf & Country Club
Astor Forest Campsites
Astoria Condominium
Astoria Hill
Astra Condo
At The Reserve Willow Pines West At Pga Village
Atco
Athena Condo
Athena Square
Athens
Athens Addn
Athens Realty Co
Athlone Hills
Athol
Athol Sub
Atlanta Estates
Atlantic 360 Residences
Atlantic Ave
Atlantic City
Atlantic Cloisters Condo
Atlantic Commons Pl 5
Atlantic Commons Pl 5 / Tuscany
Atlantic East Plat
Atlantic Gardens
Atlantic Gardens Delray
Atlantic Grove
Atlantic Grove Condo
Atlantic Heights
Atlantic Hills
Atlantic Hotel Condo
Atlantic I At The Point C
Atlantic Ii At The Point
Atlantic Iii At The Point
Atlantic Island
Atlantic Lakes
Atlantic National/Lacuna /Fairfields Lacuna 1-A
Atlantic Palace
Atlantic Palms Condo
Atlantic Park Gardens Delray
Atlantic Pines
Atlantic Riviera Plat
Atlantic Shores Condo
Atlantic Shores Dixie Hig
Atlantic Shores Dixie Highway
Atlantic Springs Condo
Atlantic Towers
Atlantic Towers Co-Op
Atlantic View Beach Club Condominium No 1
Atlantica
Atlantica Delray
Atlantis
Atlantis At Oasis
Atlantis City Of
Atlantis City Of 14a
Atlantis City Of 16-B
Atlantis Condominium Building A
Atlantis Country Club
Atlantis Iii By The Sea A Condo
Atlantis Iii By The Sea, A Condominium
Atlantis On Brickell Cond
Atlantis Regency Condo
Atlantis Regency Garden Apts Condo
Atlantis Sherbrooke Villas Condo
Atlantis Sherbrooke Villas East Condo
Atlantis Subdivision
Atlas District
Atlee Ridge
Atoka Chase
Atrium
Atrium At Palm Beach Shores
Atrium Condo
Atrium Condo S 1/2 Of Lt 1, All Lts 2,7 And 8
Atrium Condominium
Atrium I Office
Atriums Of Palm Beach Condo
Attache Garden Apartments
Atwater
Au Soleil
Auberge
Auberge Beach
Auberge Beach Residences
Auberge Residence And Spa
Auberge Residences
Aubrey Place
Auburn
Auburn Chase
Auburn Heights
Auburn Hgts
Auburn Meadows
Auburn Village
Auburndale
Auburndale Amd
Auburndale Tamiami Trail
Auchentoroly Terrace
Auchentoroly Terrace Historic District
Audubon Cluster West
Audubon Estates
Audubon Manor
Audubon Ridge
Audubon Square
Audubon Terrace Villas
Aughwick Creek
Augusta
Augusta Greens Condo
Augusta Subdivision
Augustine At The Glens
Augustine Creek
Augustine North
Aumar Heights
Aura
Aurora
Aurora At Grand Palms
Aurora Condo
Aurora Condominium
Aurora Heights
Aurora Hills
Aurora Residences
Aurora Subdivision
Austin Heights
Austin Ridge
Austins Acre
Auth Village
Autumn Chase
Autumn Glen
Autumn Hills
Autumn Hills Estates
Autumn Oaks
Autumn Oaks Estates
Autumn Park
Autumn Ridge
Autumn Rise
Autumn Run
Autumn Wood Ridge
Autumn Woods
Autumndale
Autumnwood
Av. Barcel
Av.Barcelo
Avacado Park
Avalon
Avalon Beach
Avalon Beach Club, A Condominium
Avalon Beach Pud
Avalon Boro
Avalon By The Sea
Avalon Crossing
Avalon Crossing Phase Ii
Avalon Estates
Avalon Ests
Avalon Garden Estates
Avalon Park
Avalon Park Village 5
Avalon Park West Parcel E
Avalon Shores
Avalon Sqprinceton Commons
Avalon Square
Avalon Sub
Avalon Subdivision
Avalon Trails
Avalon Trails At Villages Of Oriole Pud
Avalong Estates
Avandale
Avandale West
Avant Garde
Avant Garde Condo
Ave Maria Unit 7 Liberty Park
Avendale Woodland Grove
Avenel
Avenida Circunvalar
Avenida Miguel Yunez -Zona
Avenir
Avenir Regency
Avenir - Coral Isles
Avenir - Regency
Avenir Apex
Avenir Pod
Avenir Pod 16
Avenir Pod 20
Avenir Pod/Apex At Avenir
Avenir Site Plan 1 Pod
Avenir Site Plan 1 Pod 4
Avenir Site Plan 2 Pod
Avenir Site Plan 2 Pod 5
Avenir Site Plan 3 Pod 6
Avenir Site Plan 3 Pod 8
Avenmar
Aventi At Aventura
Aventi At Aventura Condo
Aventine At Miramar Condo
Aventura
Aventura 9th Addn
Aventura Bay Townhomes
Aventura Bay Townhomes Co
Aventura Beach Club
Aventura El Dorado Condo
Aventura Eldorado Condo
Aventura Estates
Aventura Lakes - Phase Ii
Aventura Lakes Phase 1
Aventura Marina
Aventura Marina Condo Num
Aventura Marina Condo Number One
Aventura Marina Condo Two
Aventura Marina Ii
Aventura Marina No I Cond
Aventura Parksquare Medic
Aventura Parksquare Resid
Aventura Parksquare Residences Condo
Aventura Pointe
Aventura Village
Aventura-El Dorado Condo
Aventura-Eldorado Condo
Avenue Foch
Avenue Lofts Condo Five
Avenue Lofts Condo One
Avenue Lofts Condo Two
Avenue Of The Arts
Avenues
Aviation Business Center
Aviation Country Club 1st
Avila Condo
Avila South Condo
Avocado Land Co Sub
Avocado Park
Avocado Villas
Avon Area
Avon Estates Blvd
Avon Heights
Avon Isles
Avon Park 1st Add 51-45 B
Avon Park Est Unit 1
Avon Park Est Unit 2
Avon Park Estates
Avon Park Lake
Avon Park Lakes
Avon Village
Avon-Mohr
Avondale
Avondale Acres
Avondale At Avenir
Avondale Condominium
Avondale Estates
Avondale Farms
Avondale Springs
Avonlea
Avonwood
Awesome Ranch/Ancient Oaks
Axis On Brickell
Axis On Brickell Cond
Axis On Brickell Ii Condo
Aydelotte Estates
Ayersworth Glen
Ayr Hill Heights
Ayrdale Crescent
Ayrlawn
Azalea
Azalea Woods
Aztec Plat
Aztec Rv Resort
Aztec Rv Resort Land Cond
Aztec Rv Resort Land Condo
Azul At Kimberly Lake Con
Azul At Kimberly Lake Condo
Azul Condominium
Azur Resort
Azura
Azure
Azure Condo
Azure Lake Condo
Azzura
Azzure
Azzure At Coral Golf Resor
B & R S/D Unit 1
B P Myers
B S Harris Subdivision
B&R S/D Unit 1
B-R Sub
Babbs Mountain
Babco Heights
Babco Manors
Babco Park
Babcock Ranch
Baccarat
Baccarat Hotel & Residence
Bachman Run
Back Bay Beach
Back Bay Cove
Back Creek
Back Creek Landing
Backbone Mountain
Backbone Ridge
Backlick Professional Village
Baederwood
Baer Avenue
Bagattelle Condo
Baggett Tract
Bahama
Bahama Beach
Bahama Heights 3
Bahama House South Condo
Bahama Terrace
Bahama Village Condo
Bahamas Beach
Bahia At Delray Condo
Bahia Mar Condo Of Key Bi
Bahia Mar Ests
Bahia Minitas, Casa De Campo, Dominican Republic
Bahia Sound
Bahia Vista Condo
Bahia Vista Sub
Baia Kristal
Baildon
Bailes Commons Second Add
Baileys Crossroads
Baileys Neck
Baileys Sub 5
Baileys Sub Of Tr 5
Baileyville Sub
Bainbridge
Baker Farm
Baker Park
Baker Park Estates
Baker Towers Condo
Bakers Bay Condominiums
Bakers Choice
Bal Harbour
Bal Harbour 101 Condo
Bal Harbour 1st Add
Bal Harbour 1st Add 43-9
Bal Harbour 40-47 B
Bal Harbour Center Condo
Bal Harbour North South C
Bal Harbour North South Co
Bal Harbour North South Condo
Bal Harbour Res Sec
Bal Harbour Residential S
Bala
Balaban Villa Condo
Balani Sub
Balboa Point Boca Golf & Tennis Club
Bald Eagle
Baldwin
Baldwin Estates
Baldwin Grove
Baldwin Manor
Baldwin Ridge
Baldwin Station
Bali Hi
Balk Hill Village
Ballantine & Moore
Ballantrae Estates
Ballantrae Farms
Ballantrae Highland Glen
Ballantrae- Clubside
Ballantrae-Clubside Villas At Ballantrae A Condo
Ballantraye
Ballard Gardens
Ballard Green
Ballenger Creek
Ballenger Creek Center Pond
Ballenger Creek Meadows
Ballenger Crossing
Ballenger Point Condos
Ballenger Pointe
Ballenger Run
Ballenger Woods
Ballenisles
Ballenisles Pod 16b
Ballenisles Pod 24
Ballinahinch
Ballsford
Ballston
Ballston Mews I
Ballston Park
Ballymeade
Balmacara
Balmoral
Balmoral Condo
Balmoral Country Club Lac
Balmoral Country Club Lacuna Pod B
Balmoral Country Club Lacuna Pod C
Balmoral Estates Phase 1
Balmoral Greens
Balmoral Sub Phase I
Balmoral Sub Phase Iii
Balneario El Tesoro
Balnearios Del Sur:Faro
Baltimore
Baltimore City
Baltimore County
Baltimore County Rosedale
Baltimore East - South Clifton Park Hist. District
Baltimore Highlands
Baltimore Highlands English Counsel
Baltimore Washington Industrial Park
Baltray
Baltus House
Baltus House.4250 Biscayne
Bamber
Bamboo Gardens
Bamboo Gardens Condo
Banbury Cross Reserve
Bancroft
Bancroft Meadowcroft
Bancroft Park Historic District
Bancroft Village
Bangor
Banker's Row At Osshad
Bankers Sub #1
Banks Acres
Banks Harbor Retreat
Banner Heights
Banner Lake (Aka Cottages At Hobe Sound)
Bannerwood
Banning Beach Sub
Bannister
Bannockburn
Bannockburn Estates
Banov/Orcutt (A Of E)
Bantry
Banyan 2020
Banyan Bay
Banyan Bay Condo
Banyan Bay Pud Ph 2c
Banyan Bay Pud Phase 2a &
Banyan Bay Pud Phase 2a & 2b
Banyan Bay Pud Phase 2c
Banyan Cay Resort
Banyan Cay Resort Community Plat
Banyan Cay Resort Replat L1
Banyan Cay Resort Replat Of Tract
Banyan Cay Resort Replat Of Tract L1
Banyan Club
Banyan Condo
Banyan Court
Banyan Courts Condo
Banyan Estates
Banyan Gardens C0ndo
Banyan Groves At Hobe Sound
Banyan House Condo
Banyan Lakes
Banyan Oakridge Commercia
Banyan Oakridge Commercial Plat
Banyan Oakridge Commerica
Banyan Oakridge Plat
Banyan Place Amd & Extens
Banyan Point
Banyan Springs
Banyan Terrace Cottages
Banyan Trails
Banyan Tree Condo #11
Banyan Tree Condo #9
Banyan Tree Condo 8
Banyan Tree Eleven Condo
Banyan Tree Estates
Banyan Tree Seven Condo
Banyan Tree Six Condo
Banyan Tree Two Condo
Banyan Village
Banyan Village (400800.01)
Banyan Villages
Banyans
Banyans Of Arvida Country Club
Banyans Of South Miami Co
Baptist Towers Condo
Bar Harbour Condo
Bar Kess Heights
Barakat Court
Barama Park
Barbados At Oasis
Barbara Heights
Barbella Sub 1st Addn
Barber 09-17-34
Barber Homes
Barberville
Barbican
Barbizon Beach Club
Barbs Farm
Barcelona (Teia)
Barcelona Condo North
Barcelona Condo North Bld
Barcelona Condo North Bldg 300
Barcelona Condo North Bldg 400
Barcelona Condo North Bldg 500
Barcelona Court Condo
Barcelona Gardens Condo Bldg 200
Barcelona Gardens Condo Bldg 300
Barcelona Isle
Barcelona North
Barclay
Barclay - Greenmount
Barclay At Hamptons West
Barclay At Poinciana Place Condo
Barclay Beach Club
Barclay Beach Club Phase 1, A Condominium
Barclay Club
Barclay Club At Pga Natl
Barclay Condo
Barclay Farms
Barclay Hill
Barclay Ridge
Barclay Square Condo
Barclay Towers
Barcroft
Barcroft Hills
Barcroft Mews
Barcroft Woods
Barden
Bardolino
Bare Hills
Barefoot Bay
Barefoot Bay Unit 1
Barefoot Bay Unit 2 Part 10
Barefoot Bay Unit 2 Part 11
Barefoot Bay Unit 2 Part 12
Barefoot Bay Unit 2 Part 13
Barefoot Cove Townhomes
Barger Estates
Bari Subdivision
Barker Hill
Barklay Estates
Barkley Condo
Barksdale Crossing
Barley Acres
Barley Manor Estates
Barley Mill Court
Barley Woods
Barlow
Barnaby Manor Oaks
Barnaby Village
Barnaby Woods
Barnegat
Barnegat Light
Barnegat Twp
Barnesville
Barnesville Outside
Barnetts S/D
Barnsgate
Barnside
Barnsleigh East
Baron Run
Barr Terrace
Barr Terrace Condo
Barranca Este, Casa De Campo, Dominican Republic
Barranca, Casa De Campo, Dominican Republic
Barrcrest
Barre Circle Historic District
Barrett Farm
Barrington
Barrington At Poinciana Condo
Barrington Estates Ph 1
Barrington Gardens
Barrington Oaks
Barrio Chipre
Barrio El Paraiso
Barrio El Recuerdo
Barrio Jardin
Barrio Laureles
Barrio Pinares
Barrio Progreso
Barrio San Ignacio
Barrio San Martin
Barrison Point
Barron Plat
Barrow Island At Jonathans Landing
Barrton Apts Inc Condo
Barry Farms
Barryman's Branch
Bartestree
Barto
Barton Heights
Barton Hill
Barton Place
Barton Run
Bartram Manor
Barwal 4th Sec
Barwick Ranch
Barwood
Barwood Condo
Basil Court
Baskin Add To Briny Breezes
Bass Lake Estates
Bassinger
Bassler
Basswood
Basswood Estates
Basswood Estates Un 02
Basswood Inc
Basswood Inc Un #5
Basswood Inc Un 02
Basswood Incorporated
Basswood Un 01
Basswood Un 05
Basswoods Estates
Batson Creek Estates
Battersea On The Bay
Battery Heights
Battery Park
Battery Ridge
Battle Creek Forest
Battle Grove
Battle Mountian
Battle Park Estates
Battle Run Farm
Battlefield Estates
Battlefield Green
Battlefield Station
Battletown
Bausman
Bavaretto Ocean Club
Bavaro
Bavaro Dom Rep El Cortecit
Bay Berry Acres Tylerton
Bay Breeze
Bay Breeze Estates
Bay Breeze Residences Con
Bay Bridge Cove
Bay Bridge Marina
Bay City
Bay Cliff Estates
Bay Colony
Bay Colony Club
Bay Colony Club Condo
Bay Colony Condo
Bay Colony Marina Condo
Bay Colony Of Stuart
Bay Colony Section Of The
Bay Country
Bay Country Club Condo
Bay Country Estates
Bay Crest
Bay Crest Se Point Lot
Bay Crest Sec 2
Bay Crest Sec 3
Bay Crossing
Bay Forest
Bay Forest Club
Bay Gardens
Bay Harbor
Bay Harbor Club Condo
Bay Harbor Estates
Bay Harbor Island
Bay Harbor Islands
Bay Harbor Islands, Florid
Bay Harbor One Condo
Bay Harbor Towers
Bay Harbour Estates
Bay Harbour Island
Bay Harbour Islands
Bay Haven Condo
Bay Haven Sec 1
Bay Haven Sec 2
Bay Head Shores
Bay Heights
Bay Heights 1st Addn
Bay Highlands
Bay Hill
Bay Hill Estates
Bay Hill Estates - Stonewall Estates
Bay Hills Tanglewood Ii
Bay Hollow Estates
Bay Homes Sub Db 338-23
Bay House Miami Condo
Bay House Tower Condo
Bay Knolls
Bay Lure
Bay Oaks
Bay Park Towers Condo
Bay Patio Homes
Bay Place Condo
Bay Plaza Condo
Bay Point
Bay Point Plantation
Bay Point Trailer Park 1st Add
Bay Pointe
Bay Pointe Estates
Bay Quarter Shores
Bay Reach
Bay Reach Condo
Bay Ridge
Bay Ridge Estates
Bay Ridge Ests
Bay Shores
Bay Tree
Bay Tree Patio Homes Cond
Bay Tree Patio Homes Condo
Bay View
Bay View Condo
Bay View Estates
Bay View Lofts Miami Beach
Bay View Sub
Bay View Terr
Bay Vista
Bay Vista Park
Bay Vista Park Amd
Bay Vista Park Amd Pl
Bay Watch
Bay Winds 3
Bay Yacht Club
Bay Yacht Club Condo
Bayard Ests @ Lgwd
Bayard Square
Bayberry
Bayberry Cove
Bayberry Estates
Bayberry Hill
Bayberry On The Magothy
Bayclay At Wycliffe Golf And Country Club
Baycourt Towers Condo
Bayfront At Rehoboth
Bayfront Of Boynton Beach Condo
Bayhill Estates
Bayly
Bayly Road
Bayport At Lakesbay
Bayport Village
Bayport Village A Condo
Bayport Village B Condo
Bayport Village C Condo
Bayport Village D Condo
Bayshore
Bayshore A
Bayshore Amd
Bayshore Cm
Bayshore Embassy Condo
Bayshore Estates
Bayshore Gardens
Bayshore Heights
Bayshore Mhp
Bayshore Place Condo
Bayshore Plaza
Bayshore Plaza Unit 5
Bayshore Plaza Unit No 3
Bayshore Plaza Unit No 6
Bayshore Terrace Condo
Bayshore Towers
Bayshore Treasure
Bayshore Treasure Condo
Bayshore Unit 02
Bayshore Unit 3
Bayshore Unit No 2
Bayshore Yacht & Tennis
Bayshore Yacht & Tennis C
Bayshore Ysabella Condo
Bayshore Ysabella Condomin
Bayshores
Bayside
Bayside At Bethany Lakes
Bayside Beach
Bayside Keys
Bayside Marina
Bayside Ocean City
Bayside Terrace Condo
Bayside Village Condo
Bayside Village East
Bayswater Court Condo
Baytowne At Jonathans Landing
Bayview
Bayview Acres
Bayview Addition To St. An
Bayview At Fisher Island
Bayview At Indian River P
Bayview At Kent Narrows
Bayview Condo At North Ba
Bayview Estates
Bayview Fisher Isl Condo
Bayview Hgts
Bayview Hills
Bayview Irp Condo
Bayview Landing
Bayview Manor Estates
Bayview Manor Ii
Bayview Palms Condo
Bayview Park
Bayview Plaza Condo
Bayview Point North Condo
Bayview Point South Condo
Bayview Terr Condo
Bayview Terrace Condo
Bayview Towers
Bayview Towers Condo Nort
Bayview Towers Condo Sout
Bayview Towers Condo South
Bayview Trailer Park
Bayview Village B Condo
Bayville
Bayville - Berkeley Shores
Bayville - Cedar Creek
Bayville - Holly Park
Bayville - Pinewald
Bayville Shores
Baywinds
Baywinds - Windjammer Cove
Baywinds At Cozumel
Baywinds Of Abaco
Baywinds Of Barbados
Baywinds Of Dominica
Baywinds Of Dominica And
Baywinds Of Dominica And Eleuthera
Baywinds Of Flores
Baywinds Of Galapagos
Baywinds Of Galapagos Fir
Baywinds Of Hatteras
Baywinds Of Hatteras Repl
Baywinds Of Hatteras Repla
Baywinds Of Ibiza
Baywinds Pod H
Baywinds Rpd 01
Baywinds Rpd 1
Baywinds Rpd 10
Baywinds Rpd 11
Baywinds Rpd 2
Baywinds Rpd 3
Baywinds Rpd 4
Baywinds/Harbour Cove
Baywinds/Windjammer Cove Condo
Baywood
Baywood Ii
Baywood Village I-A Condo
Baywood Village I-B Condo
Baywood Village Ii-A Condo
Baywood Village Ii-B Condo
Baywood Village Ii-D Cond
Baywood Village Ii-D Condo
Baywood Village Iii-A Con
Baywood Village Iii-A Condo
Baywood Village Iii-B Con
Baywoods Of Annapolis
Bbb Ranches
Be Hillsboro
Beach Club Apts Condo
Beach Club Colony
Beach Club Condo
Beach Club Condominium
Beach Club I
Beach Club Ii
Beach Club Iii
Beach Club Three Condo
Beach Club Two
Beach Club Two Condo
Beach Club Villas Condo
Beach Colony Condo
Beach Estates
Beach Front
Beach Gardens Condo
Beach Gate Condos
Beach Harbor
Beach Haven
Beach Haven - Leh Yacht
Beach Haven Crest
Beach Haven Estates
Beach Haven Gardens
Beach Haven Park
Beach Haven Park - Sounds Edge
Beach Haven Terrace
Beach Haven West
Beach Heights
Beach Lake
Beach Lots Delray
Beach Point Condo
Beach Run
Beach Shore Apts Co-Op
Beach Shore Apts. Co-Op
Beach Shores
Beach Terrace Resort Cond
Beach Terrace Resort Condo
Beach View Addition
Beach View Addn
Beach View Sub
Beach Way Heights Unit
Beachaven
Beachblock
Beachcomber Condo
Beachcomber Of Nobe Condo
Beachcomber Phase Ii
Beachfront - Bahia, Brazil
Beachfront At Juno Beach
Beachfront North
Beachgardens Condo
Beachside Apts Co-Op
Beachside Townhome
Beachtree I Cluster, A Co
Beachtree Ii Cluster, A Condominium
Beachtree Preserve
Beachview
Beachwalk
Beachwalk Condo
Beachwalk Condominium
Beachway Estates
Beachway Manor
Beachwood
Beachwood Estates
Beachwood Heights
Beachwood Villas Condo
Beacom Manor
Beacon 21 Condo
Beacon 21 Condo Sailfish Village
Beacon At Doral
Beacon Hallandale Commerc
Beacon Heights
Beacon Hill
Beacon Hill Condo
Beacon House Condo
Beacon Lakes Condo
Beacon Light Estates
Beacon Manor
Beacon Meadows
Beacon Park Phase 3
Beacon Place Condo
Beacon Point
Beacon Square
Beacon View
Beacon Village
Beagle Club
Beaglin Park Plaza
Beallair
Bealls
Bealls Addition
Bealls Manor
Beallsville
Beantown Park
Bear
Bear Bay Hills Unit One
Bear Claw Estates
Bear Creek
Bear Creek Village
Bear Island
Bear Lakes Estates North
Bear Trap
Bear Wallow Knolls
Bear's Den
Bearings South
Bearington Estates
Bears Club
Bears Club Addn Pud
Bears Club Golf Villas Condo
Bears Club Pud
Bears Club Repl Pud
Beatty Subd
Beau Monde Estates
Beau Ridge
Beau Ridge Estates
Beau Rivage
Beau Rivage Estates
Beaufort Park
Beaulieu
Beaumont
Beaumont Square
Beaupre
Beauregard Heights
Beautiful Indian River
Beautiful Indian River Drive
Beautiful Indian River Drive Ocean Bay
Beautiful Lakefront Corner
Beautiful Waterfront Community Ird
Beauvois On The Lake Condo
Beauvue East
Beaver Brook
Beaver Brook Crest
Beaver Creek
Beaver Creek Crossing Unit 2
Beaver Dam Acres
Beaver Dam Estates-South
Beaver Dam Heights
Beaver Hill
Beaver Lodge
Beaver Meadows
Beaver Plaza
Beaver Run
Beaverbrook
Beavers
Becker Road Area
Beckett Green
Beckford Manor
Becks Landing
Becks Woods
Bedford
Bedford Borough
Bedford Condo
Bedford Mews At Wellington
Bedford Park
Bedford Towne Condo
Bedford Township
Bedford Twp
Bedminster
Bedminster Hunt
Bedminster Square
Beech Mountain
Beech Mt Lakes
Beech Tree East Village
Beech Tree North Village
Beech Tree South Village
Beech Tree West Village
Beechfield
Beechfield Manors
Beechs Roost Subdivision
Beechtree
Beechtree Estates
Beechwood
Beechwood Acres
Beechwood On The Burley
Beginning Run
Begonia Gardens Condo Inc
Beidler Knoll
Bel Air
Bel Air Acres
Bel Air Heights
Bel Air South
Bel Aire
Bel Aire Sec 10
Bel Aire Sec 13
Bel Aire Sec 16
Bel Aire Sec 17
Bel Aire Sec 3
Bel Aire Sec 4
Bel Aire Sec 5
Bel Alton Estates
Bel Forest
Bel Highland
Bel Lido
Bel Lido Estates Condo
Bel Marra
Bel Marra Condo
Bel Plains Estates
Bel Pre Manor
Bel Pre Woods
Bel-Air
Bel-Air 32-10 B
Bel-Air Isle
Bel-Air Isle 40-43 B
Bel-Aire On The Ocean Con
Bel-Aire Sec 1
Bel-Aire Sec 2
Bel-Aire Sec 23
Bel-Aire Section Four Condo
Bel-Aire Section One Cond
Bel-Aire Section Six Cond
Bel-Aire Section Three Condo
Belair
Belair Estates
Belair Gardens
Belair Town
Belair Wpb
Belair-Edison
Belaire
Belaire Estates
Belardly
Belasera At Pine Island C
Belasera At Pine Island Condo
Belcoville
Belcrest
Belden
Belevedere Square
Belford-Carr Sub
Belfort Condominium
Belfort Condominium E
Belfort Condominium F
Belfort Condominium G
Belfort Condominium H
Belfort Condominium J
Belfort Condominium K
Belfort Condominium L
Belfort Condominium N
Belfort Condominium O
Belfort Condominium Q
Belfort Kings Point
Belgrove Villas
Belinda Gardens Condo
Belize
Bell Air Estates
Bell Creek
Bell Forest
Bell Gardens
Bell Manor Estates
Bell Shoals Gardens
Bella Colina Condo
Bella Delray
Bella Grand Condo
Bella Luna Condo
Bella Mar A Condo
Bella Mar Condo
Bella Rosa
Bella Terra
Bella Terra Pud 1
Bella Terra Pud 4
Bella Venezia Condo
Bella Verde Condo
Bella Villaggio
Bella Villas Condo
Bella Vista
Bella Vista Condo Phases Ii Iii And Iv
Bella Vista Condominium
Bella Vista Homes 201 Con
Bella Vista Isles
Bella Vista Mid Rise Nort
Bella Vista Mid Rise North
Bella Vista Palace Condo
Bella Vita Senior Condos
Bellaggio
Bellaggio, Towne Park
Bellagio
Bellagio At Vizcaya
Bellagio Villas
Bellaire Sub
Bellalago Ph 3
Bellamare @ Williams Isla
Bellamy Heights Boynton
Bellaria Condo
Bellaride
Bellavida Ph 2c
Bellavista Village Condo
Bellaviva
Bellaviva Ph 2
Bellcamp Manor
Belle Air Townhomes
Belle Ami Condo-Phase 1>
Belle Ayre
Belle Farm Estates
Belle Flora Estates
Belle Haven
Belle Haven Estates
Belle Haven Terrace
Belle Isle
Belle Isle Condo
Belle Isle Villas
Belle Mead
Belle Meade
Belle Meade 1st Addn
Belle Meade Island
Belle Meade Of Mia Sec 1
Belle Meade Place Condo
Belle Meade Rev Pl
Belle Parc
Belle Plains
Belle Plaza Condo
Belle Point Farm
Belle Rive
Belle Terre
Belle Towers Condo
Belle View
Belle View Condominiums
Belle View Court
Belle Vista
Bellefonte
Bellefonte Borough
Bellehaven Unit A
Bellemead
Bellemoor
Belleview Heights Estates
Belleview Sub - A Resub
Belleview Villas Condo No
Belleville
Belleville Farm
Bellevue
Bellevue Biscayne
Bellevue Farms
Bellevue Forest
Bellevue Hills
Bellevue Park
Bellini At Williams Islan
Bellini Condo
Bellmeade
Bello Horizonte
Bello Lido
Bello Lido Resub
Bello Monte Estates Ii
Bellona-Gittings Historic District
Bells Corner
Bells Hill
Bells Lake
Bells Senior Living
Bellsford Landing
Bellvale
Bellview Heights
Bellview Mnr
Bellwood Park
Bellwood Sub Rev
Bellwoode
Belmar
Belmar 2-22 B
Belmar Amended
Belmont
Belmont At Carmel Church
Belmont At North Lauderda
Belmont At North Lauderdale
Belmont Bay
Belmont Center
Belmont Country Club
Belmont Crest
Belmont Estates
Belmont Farm
Belmont Forest
Belmont Greene
Belmont Greene Condo
Belmont Hills
Belmont Hills Unit 1
Belmont Lakes At Davie
Belmont Land Bay
Belmont Overlook
Belmont Park
Belmont Park Estates
Belmont Ridge
Belmont Ridge Ii
Belmont South
Belmont Station
Belmont/Pk Central Condo
Belotti Villas 57-41 B
Belterra
Belterra Phase 1 Plat 1
Belterra Phase 1 Plat 2
Belterra Phase 1 Plat 3
Belts Landing
Beltsville
Beltsville Heights
Belvedere
Belvedere Beach/Harmony
Belvedere Court 4
Belvedere Estates
Belvedere Glen
Belvedere Heights
Belvedere Isles Condo No
Belvedere Isles Condo No 1
Belvedere Park
Belvedere South 2
Belvedere Square
Belvidere Park
Bembe Beach
Ben Ash Plat
Bendle Investment Company
Benedict Plantation
Benjamin Hogg's Addition
Benjamins Claim
Bennett Park
Bennett Run
Benning Heights
Bennington
Bennington Farms
Bensalem Vil
Benson
Benson House
Benson Manor
Benson Park 1st Addn
Bensville
Bent Creek
Bent Creek Country Club
Bent Creek Crossing
Bent Creek Tract A-1
Bent Creek Tract B-1
Bent Creek Tract B-2
Bent Cypress
Bent Palm Apts Condo
Bent Pine Villas Condo Unit I
Bent Tree Center Pb 108-82
Bent Tree Gardens West Condo
Bent Tree Lake Central
Bent Tree Parcel Six Cond
Bent Tree Ph 2
Bent Tree Sec One
Bent Tree South
Bent Tree Villas East Condo
Bent Tree Villas West Condo
Bentalou
Bentley Hay
Bentley Park
Bentley Place
Bentley Residences
Bentley Ridge
Bentley Square
Bentley Village
Bentley Woods
Benton Terrace
Benton's Crossing
Bentons Pleasure
Bentonville
Benvenue Farms
Berea-Biddle Street Historic District
Beresford Condo
Bergantino Est
Bergen County
Bergen Square
Bergenfield Boro
Berkeley
Berkeley County
Berkeley Court
Berkeley Diplomat Co-Op
Berkeley Manor
Berkeley Manor Condo
Berkeley Manor Sec 1
Berkeley Manor Sec 2
Berkeley Ridge
Berkeley Springs
Berkeley Square
Berkeley Station
Berkeley Village
Berkfield
Berkley
Berkley Beach
Berkley Crossing
Berkley House Of Carriage
Berkley House West
Berkley South
Berkley South Condo
Berks County
Berkshire
Berkshire A Condo
Berkshire A Thru K Condos
Berkshire B Condo
Berkshire Estates
Berkshire Gardens
Berkshire Hills
Berkshire House Condo
Berkshire Oakwood
Berkshire West Sub Sec 1
Berkshire Woods
Berlin Park
Bermuda Bay Oceanside
Bermuda Cay
Bermuda Club
Bermuda Club Five Condo
Bermuda Club Four Condo
Bermuda Club Nine Condo
Bermuda Club One Condo
Bermuda Club Pud
Bermuda Club Seven Condo
Bermuda Club Six Condo
Bermuda Club Three Condo
Bermuda Club Two Condo
Bermuda High West One And Two Condo
Bermuda House Condominium
Bermuda Shores Amd
Bermuda Square Sec B
Bermuda Village B Condo
Bermuda Village C Condo
Bermuda Village D Condo
Bermuda-Riviera Sub Of Ga
Bermuda-Riviera Sub Of Gal
Bermuda-Riviera Sub Of Galt
Berna-Gilda Addn
Bernard Village
Berrett
Berrien City
Berry
Berry Hill
Berry Hill Manor
Berry Valley
Berryhill
Berryman's Branch
Berryman's Grant
Berryville
Berts Bayshore Manor
Berwick
Berwick Pl
Berwick Township
Berwyn
Berwyn Addn
Berwyn Downs
Berwyn Heights
Besilu Ii Sub
Best Division
Bet-Her Acres
Bethal Township
Bethany Bay
Bethany Glen
Bethany Grand
Bethany Meadows
Bethany Shores
Bethany West
Bethayres
Bethel Academy
Bethel By The Sea
Bethel Isle Unit 2 Replat Lot 22 & Lot
Bethel Of Elk Forest
Bethel Springs
Bethel Township
Bethel Twp
Bethelen Woods
Bethesda
Bethesda Outside
Bethesda Park
Bethesda Park Condo
Bethlehem Area
Bethlehem City
Bethlehem Township
Bethune Homesites
Bethune/Westwood/Broward
Better Waverly Historic District
Betterton
Betty Lu Homesites
Betz Landing
Beulah Heights
Beulah Pentecostal
Beulaland
Bevan Subdivision
Bevans Orchard
Beverley Beach
Beverley Hills
Beverly
Beverly Estates
Beverly Gardens
Beverly Heights
Beverly Hills
Beverly Hills Add 3
Beverly Hills Condo
Beverly Hills Condo #1
Beverly Hills Condo 12
Beverly Hills Condo Numbe
Beverly Hills Condo Number
Beverly Hills Condo Number Five
Beverly Hills Condo Number Four
Beverly Hills Condo Number Nine
Beverly Hills Condo Number Seven
Beverly Hills Condo Number Six
Beverly Hills Condo Number Two
Beverly Park
Beverly Park No 2
Beverly Shores 30-27 B
Bewley Estates
Bexhill Farms
Bexley
Bexley Park
Bh Bal Harbour Bldg 3
Biarritz Sub Phase One
Bible Conference Estates
Biddison
Biddle Street
Bien Venue
Bienvenue
Big Bass Lake
Big Bass Lodge Rv Park + F
Big Boulder Lake
Big O R V Park
Big O Rv Park
Big O Rv Resort
Big Pine Estates
Big Pine Key Inc
Big Pine Key Inc (31.0)
Big Sky North Residential
Big Sky Plat
Big Sky Plat - Keystone Lk
Big Spring Farm
Big Spring Terrace
Big Tree Campsites
Big Tree Campsites Sec. C
Big Tree Lakes
Biglerville
Biglerville Borough
Bilbao Estates
Billgsly Forest
Billingsley Park
Billingsport
Billows
Biltmore Beach
Biltmore Estates
Biltmore Ii Condo
Biltmore Parc Condo
Biltmore Park
Biltmore Pk
Biltmore Sub
Biltmore Terrace
Biltmore Villas Sec 111
Bimini At The Oasis
Bimini Bay
Bimini Bay Resort
Bimini Cove And Marina
Bimini Village A Condo
Bimini Village B Condo
Bimini Village D Condo
Bimini Village Wynmoor
Binks Forest Of The Landi
Binks Forest Of The Landings At Wellington 3
Binks Forest Of The Landings At Wellington 4
Binks Pointe
Binns
Binstocks Sub
Birch Creek
Birch Crest Apartments Inc
Birch Grove
Birch Hollow
Birch Hollow Hamlet
Birch Pointe Condo
Birch Run
Birch Square Condo
Birchdale
Birches
Birches West
Birchfield
Birchfield Woods
Birchwood
Birchwood At Brambleton
Birchwood City
Birchwood Lakes
Birchwood Manor
Birchwood Park
Bird Estates
Bird Key
Bird Lake Townhouse Sec 2
Bird Lakes North Sec 3
Bird Lakes South Sec 2
Bird Lakes South Sec 4
Bird Lawn
Bird Rd Farmsites
Bird Rd Highlands
Bird River
Bird River Beach
Bird River Rd
Bird Road Area
Bird Road Condo
Bird Road Farmsites
Bird Road Highlands
Bird Road Terrace
Bird Villas Sub 2nd Addn
Birdland
Birdsong Village
Birkdale Condo Apts Decl
Birkwood Estates
Birmingham Terrace
Birnham Wood
Bisc Gardens Sec A
Bisc Gardens Sec B
Bisc Gardens Sec C
Bisc Gardens Sec D
Bisc Gardens Sec F Pt 1
Bisc Gardens Sec H Part 1
Bisc Gardens Sec H Part 2
Bisc Lake Gardens Condo N
Bisc Lake Gardens No 2 Bld
Bisc Lake Gardens No 2 Bldg F
Bisc Shores Corr Plat
Biscado Ests Sec 1
Biscaya Iii Condo
Biscaya Iv Condo
Biscayne Ave Tract
Biscayne Bay
Biscayne Bch Sub
Biscayne Beach
Biscayne Beach Club Condo
Biscayne Beach Condo
Biscayne Beach Condo Podiu
Biscayne Beach-2nd Addn
Biscayne Beach-3rd Addn
Biscayne Best
Biscayne Blvd Park
Biscayne Condo Miami North
Biscayne Court
Biscayne Drive Estates
Biscayne Entrada 2nd Rev
Biscayne Gardens Sec A Re
Biscayne Gardens Sec D Re
Biscayne Gardens Sec E Pa
Biscayne Gardens Sec E Pt
Biscayne Gardens Sec F Pa
Biscayne Gardens Sec F Part 2
Biscayne Gardens Sec F Pt
Biscayne Gardens Sec F Pt1
Biscayne Gardens Sec G
Biscayne Gardens Sec H Pa
Biscayne Gdns Sec C
Biscayne Gdns Sec E Part
Biscayne Heights
Biscayne Highlands
Biscayne Isl
Biscayne Key Estates
Biscayne Key Estates Sub
Biscayne Lake Gdn Bldg A
Biscayne Lawn Amd Plat
Biscayne Park Estates
Biscayne Park Ests Amd
Biscayne Park Kings Resub
Biscayne Park Terrace Con
Biscayne Patio Homes
Biscayne Point
Biscayne Point Condo
Biscayne Point Resub
Biscayne Point South
Biscayne Realty Cos
Biscayne River Gardens
Biscayne River Gardens No
Biscayne River Heights
Biscayne Shores
Biscayne Shores Corr Plat
Biscayne Shores Unit 4
Biscayne Village Heights
Biscayne Woods
Bishop Woods
Bishop's Crest
Bishops Grant
Bishops Head
Bishops Landing
Bishops Meadow
Bittersville
Bittersweet
Bittinger
Bk 11 Lt 10 Key Largo Trai
Black Creek Cove
Black Creek Estates
Black Creek Villas
Black Diamond
Black Diamond Ph 1
Black Diamond Ph 2
Black Horse
Black Horse Run
Black Oak
Black Oak Creek
Black Riffles Estates
Black Rock Estates
Black Thorn
Black Water Landing
Blackbird
Blackburn
Blackston Cove
Blackthorn
Blackthorn Mountain Estates
Blackwater Crossing
Blackwater Landing
Blackwater Village
Blackwell Park Rev Pl
Blackwood
Blackwood Estates
Blackwood Terrace
Bladensburg
Bladenwoods
Blain
Blair
Blair House Condo - West
Blair House Condo A
Blair Village
Blair Woods
Blairs Downtown Condo
Blairs Pond Ests
Blake Courtyard Estates
Blake Sub
Blakely
Blakely Subdivision
Blanche Ely
Blandemar Farm Estates
Blandon Meadows
Blank On Property Appraiser's Website
Blason Woods
Blaze Mill
Blazing Trail Plat
Bldg 130 Of Country Club
Bldg 7 Of Country Club Ap
Bldg 8 Of Country Club Ap
Bldg 9 Of Country Club Ap
Bleau Fontaine Condo #2
Bleau Fontaine Condo #One
Bleau Grotto Condo
Blenheim Forest
Bloch Grandis
Bloomfield
Bloomfields
Blooming Glen
Bloomingdale
Bloomingdale Sec P Q
Bloomingdale Section A
Blooms Crossing
Blooms Mill
Bloomsbury
Bloomsdale Gdns
Blossom Hill
Blossom Trail
Blount Bros Pompano Beach
Blounts N S
Blowing Rocks
Bloxom
Blue Anchor
Blue Ball Village
Blue Bay Tower Condo
Blue Bell
Blue Bell Cc
Blue Bell Hill
Blue Bell Mobile Home Park
Blue Bell Springs
Blue Bell Woods
Blue Condo
Blue Coral Condo
Blue Cypress
Blue Cypress At Palm Beach Polo & Country Club
Blue Cypress Golf & Rv Re
Blue Cypress Golf & Rv Resort
Blue Cypress Golf And Rv Resort
Blue Cypress Repl At Palm Beach Polo
Blue Cypress Repl At Palm Beach Polo & Country Clu
Blue Cypress Single Family Homes Of
Blue Diamond 2 Parking
Blue Diamond Condo
Blue Heaven Landing
Blue Heron
Blue Heron Beach Resort Tower 1 Condo
Blue Heron Country Club
Blue Heron Golf And Country
Blue Heron Mobile Home Park Co-Op
Blue Heron Park 1
Blue Heron Park 4
Blue Heron Pine
Blue Heron Pines
Blue Inlet
Blue Inlet - Lake Rodgers
Blue Jordan Forest
Blue Knob
Blue Knob All Seasons Resort
Blue Lagoon Condo
Blue Lagoon Condominium
Blue Lake Apts Condo
Blue Lake Townhomes
Blue Lake Townhouses Cond
Blue Lake Townhouses Condo
Blue Meadow Farms
Blue Mountain
Blue Mountain Lake
Blue Mountain/Shen. Farm
Blue Mt.View Park
Blue Ridge
Blue Ridge Acres
Blue Ridge At Lansdowne Woods
Blue Ridge Glen
Blue Ridge Heights
Blue Ridge Manor
Blue Ridge Mountain Estates
Blue Ridge Shadows
Blue Ridge Shores
Blue Ridge Summit
Blue Ridge Terrace
Blue Ridge Twenty One
Blue Ridge Village
Blue Shadows
Blue Spring Enclave
Blue Stone Hills
Blue Stream
Blue Water
Blue Water Beach
Blue Waters Tr Village Se
Bluebell Farms
Blueberry Hill
Blueberry Hill I Condo
Blueberry Hill Ii Condo
Blueberry Hill Iii Condo
Blueberry Hill Iv Condo
Blueberry Manor
Bluelick Commons
Bluemont
Bluenest
Bluenest Homes
Blueridge Manor
Bluestone Creek
Bluewater
Bluewater Condo
Bluewaters Subdivision
Bluff Point
Bluff Point On Severn
Bluffs At Deep Creek
Bluffs Marina Condo
Bluffs Of The Potomac
Bluffs Of Wolf Trap
Bluffs On The Potomac
Bluffwood Estates
Blum Pl
Blunt Commons
Blv Briarwood Vlg
Blvd Add
Blvd Addn
Blvd Flats At National Harbor
Blvd Hts Shopping Center
Blvd Park
Blythedale
Bo Malezaalta Aguadilla Pr
Boalsburg
Boardwalk Area
Boardwalk At Vizcaya Cond
Boat House Condominium
Boathouse Of Hendricks Is
Bob White Farms
Bob-Ann Estates
Bobbys Run
Boca Azul Ph 4 And 5
Boca Barwood
Boca Bay Colony
Boca Bayou
Boca Bayou Condo
Boca Bayou Condominium
Boca Bayou Ph 1, 2 Thru 5 & 7 Condos
Boca Beach Residences Con
Boca Beach Residences Condo
Boca Bella Condo
Boca Bend
Boca Bridges
Boca Capri Condo Apts Sly
Boca Casa
Boca Century Village
Boca Chase
Boca Chase Greenbriar
Boca Chase Sec 1
Boca Chase Sec 2
Boca Chase Sec 3
Boca Chase Tr 4
Boca Chase Tr 9 B
Boca Chase Tr 9 D
Boca Chica
Boca Club Condo
Boca Condo
Boca Cove Condo
Boca Deer
Boca Del Mar 1
Boca Delray
Boca Delray Country Club
Boca Delray I-Iii Condo
Boca Delray I-Iii Condo S Filed In Or3857p483,4
Boca Dunes Pud
Boca Entrada
Boca Falls Par M
Boca Falls Par S
Boca Falls Par T
Boca Flores
Boca Flores Condo
Boca Fontana Tr E
Boca Gardens
Boca Glades Condo A Thru D
Boca Golfview Condo
Boca Granada West Inc
Boca Grand Condo
Boca Grande
Boca Greens 1
Boca Greens 2
Boca Greens 3
Boca Greens 4
Boca Greens 5
Boca Greens 7
Boca Greens 8
Boca Grove
Boca Grove Plantation
Boca Harbour 3rd Sec
Boca Harbour 6th Sec
Boca Harbour Island Sec
Boca Hills Condo
Boca House
Boca House Condo
Boca Inlet
Boca Inlet Condo
Boca Islands Sec 1
Boca Islands Sec 1 In
Boca Islands Sec 2
Boca Isle Condo
Boca Isles South Ph 5a
Boca Isles South Ph 5c
Boca Isles South Ph 5d
Boca Isles South Ph 5e
Boca Keys
Boca Lago
Boca Lago Fairways
Boca Lago Vistas
Boca Lakes Condo
Boca Landings
Boca Landings North
Boca Linda Condo
Boca Linda East Condo
Boca Linda West Condo
Boca Madera Unit 1
Boca Madera Unit 3
Boca Marina
Boca Palms Condo I Thru I
Boca Palms Condo I Thru Iv
Boca Palms Condo Tr B
Boca Park
Boca Park Condo
Boca Patio Vlg
Boca Pinar Condo
Boca Pines Of Verde Trail
Boca Preserve
Boca Quay
Boca Rancho I
Boca Raton
Boca Raton Bath & Tennis Club
Boca Raton Golf Course
Boca Raton Golf Course Pu
Boca Raton Golf Course Pud
Boca Raton Hills
Boca Raton Hills Sec 2
Boca Raton Hills Sec 3
Boca Raton Por La Mar
Boca Raton Riviera
Boca Raton Riviera Unit A
Boca Raton Riviera Unit A In
Boca Raton Riviera Unit B
Boca Raton Riviera Unit D
Boca Raton Square 16
Boca Raton Square 9
Boca Raton Square Unit 1
Boca Raton Square Unit 19
Boca Raton Square Unit 2
Boca Raton Square Unit 3
Boca Raton Square Unit 4
Boca Raton Square Unit 8
Boca Ratone Co Inlet
Boca Ratone Colet
Boca Ratone Por La Mar
Boca Ratone Por La Mar Lt
Boca Real Villas
Boca Reef Condo
Boca Reserve Pud
Boca Ridge Glen
Boca Ridge Park Condo
Boca Rio North
Boca Royal Apts Cond Bldg B
Boca Sailing And Racquet Club
Boca Springs
Boca Square
Boca Teeca
Boca Teeca Condo 10
Boca Teeca Condo 2
Boca Teeca Condo 3
Boca Teeca Condo 4
Boca Teeca Condo 5
Boca Teeca Condo 6
Boca Teeca Condo 8
Boca Teeca Condo 9
Boca Teeca Condo Unit 03
Boca Teeca Condominium Unit Three S1/2 Of Lt 3 All
Boca Terrace Cond Phase I & Ii
Boca Terrace Condo Ph I And Ii Or261
Boca Towers Condo
Boca Towers Condo Portion
Boca Towne Centre Condo
Boca Trails
Boca Trails 1
Boca Verde Condo
Boca Verde East Condo
Boca View
Boca View Condo
Boca Village Ph I Condo
Boca Village Ph I-A Condo
Boca Villas
Boca Villas Heights
Boca Villas Sec B
Boca Villas Sec C
Boca Vista
Boca West Country Club
Boca Winds Par D-1
Boca Woods
Boca Woods Country Club
Boca Woods Country Club 10
Boca Woods Country Club 4
Boca Woods Country Club 6
Boca Woods Country Club 8
Boca Woods Country Club Ph 1
Boca Woods Country Club Ph 2
Boca Woods Country Club Ph 3a
Boca Woods Country Club Ph 3b
Bocagrande
Bocaire Country Club
Bocaire Golf Club
Bocaire Golf Club 1
Bocaire Golf Club 2
Bocaire Golf Club 3
Bocaire Golf Club No 2
Bocaire Golf Club No 7 Pud
Bocar Condo
Bogart
Boggans Subdivision
Boheme Condo
Bohemia Mill Pond
Boies
Bolivar
Bolivar Corp
Bolling
Bolling Brook
Bolton Hill Historic District
Bombay Woods
Bon Air
Bon Air Beach
Bon Aire
Bon Aire Desire
Bon Aire Village
Bon Ayre
Bon Bini
Bon Bini Condo
Bon-Aire
Bonair Hill Sub No. 2
Bonaire
Bonaire At Woodmont
Bonaire At Woodmont No 1-
Bonaire At Woodmont No 3
Bonaire At Woodmont No 4
Bonaire At Woodmont No 5-
Bonaire At Woodmont No 5-B
Bonaire Village At Woodmo
Bonaire Village At Woodmont
Bonanza Buildable Land
Bonanza Ranch
Bonanza Ranch Estate
Bonanza Ranch Estates
Bonanza Ranchos
Bonanza Rhos
Bonanza Villas Park
Bonaventure
Bonaventure - La Costa
Bonaventure At Coconuts
Bonaventure Lakes
Bonaventure Lakes 3rd Addition
Bonaventure Lakes Add 1
Bonaventure Lakes Add 2
Bonaventure Townhouses Co
Bonavida Condo
Bonavillas
Bonavista Condo
Boney Rd
Bonie Villas Sec One 57-2
Boniello Gardens 1 Add
Bonifant Woods
Bonisle At Woodbine
Bonita
Bonita Del Sol
Bonita Golf View Townvill
Bonita Grand Estates Sout
Bonita Grand Estates South
Bonita Villas Condo
Boniwood
Boniwood Plat 3
Boniwood Plat 7
Bonna Bella Place
Bonne Vie Condo
Bonnette Hunt Club
Bonney Brae Farms
Bonney Shores
Bonnie Brook
Bonnie Loch
Bonnie Loch Sec 1
Bonnie Loch Sec 2
Bonniecrest
Bonniecrest Sub
Bonnymeade Farm
Bonterra
Booker Homesites
Booker Park
Booker T Homes
Boone's Mobile Estates
Boones Estates
Boonsboro
Booth Corner
Booth-Boyd
Boothhurst
Borens Shore
Boring
Boro Of Arendstville
Boro Of Camp Hill
Boro Of Carroll Valley
Boro Of Marysville
Borough
Borough Of Carlisle
Borough Of Gettysburg
Borough Of Kulpmont
Borough Of Littlestown
Borough Of Mcsherrystown
Borough Of Middleburg
Borough Of Newburg
Borough Of Newville
Borough Of Palmyra
Borough Of Shippensburg
Boscoble
Bosques Del Pinar
Bossert Estates
Boston
Boston Plaza Condo
Boston Ridge
Botanica
Botanica Lakes
Botts
Bougainvilla
Bougainvilla Heights
Bougainvillea Place
Bouganvillea Villas Condo
Boulan South Beach Condo
Boulder Ridge
Boulevard Acres
Boulevard Del Atlantico
Boulevard East
Boulevard Estates
Boulevard Estates Amen
Boulevard Garden
Boulevard Gardens
Boulevard Gardens First A
Boulevard Heights
Boulevard Heights Sec
Boulevard Heights Sec 1
Boulevard Heights Sec 11
Boulevard Heights Sec 12
Boulevard Heights Sec 3
Boulevard Heights Sec 4
Boulevard Heights Sec 5
Boulevard Heights Sec 6
Boulevard Heights Sec 7
Boulevard Heights Sec 8
Boulevard Heights Sec 9
Boulevard Heights Sec Nin
Boulevard Heights Sec Ten
Boulevard Heights Section
Boulevard Manor
Boulevard North
Boulevard Park
Boulevard Park Isles Sec
Boulevard Park Isles Sec 1
Boulevard Park Isles Sec 4
Boulevard Park Isles Sec 5
Boulevard Vi Towns
Boulevard Village & Tennis Club
Boulevard Villas Courtside Condominium
Boulevard West
Boulevard Woods North
Boulevard Woods South
Boulevard Woods West Sec
Boundary Creek
Boundary Run
Boundbrook Condo
Boundbrook Condo S
Bowdens Waterfront Estates
Bowe Gardens Sec J 2
Bowen Estates
Bowen Manor
Bowens Add Riviera Villag
Bowers Beach
Bowers Park
Bowers View Ests
Bowie
Bowie Forest
Bowie Towers
Bowie/Mitchellville
Bowleys Quarters
Bowling Brook Farms
Bowling Green
Bowling Green Extension
Bowmans
Bowtie Subdivision
Box Hill
Box Hill North
Box Hill South
Box Ranch Groves
Boxer Hill Park
Boxley Farms
Boxwood
Boxwood Village
Boyds Crossing
Boyds Mill
Boyers Ridge
Boyertown
Boynton Beach Leisureville
Boynton Beach Park
Boynton Heights
Boynton Heights Add 1
Boynton Hills
Boynton Lakes 1
Boynton Lakes 2
Boynton Lakes 3
Boynton Lakes 3-C
Boynton Lakes 4
Boynton Lakes 5
Boynton Lakes 6-A
Boynton Landings Condo
Boynton Oasis Condo
Boynton Ridge
Boynton Sub
Boynton Sub.
Boynton Town Of
Boynton Waters West 1
Boynton Waters West 2
Bozman
Bpnaire At Woodmont
Bracey Estates
Brackenville Woods
Brackin Estates
Bradbury
Bradbury Heights
Bradbury Park
Bradbury Point
Braddock Heights
Braddock Hills Estates
Braddock Place
Braddock Run
Braddock Woods
Braddocks Subdivision Replat Lots 10 To 18
Bradfield
Bradford Estates
Bradford Farms
Bradford Run
Bradford Square
Bradford Village
Bradley Acres
Bradley Estates
Bradley Farms
Bradley Forest
Bradley Hall Condo
Bradley Heights
Bradley Hills
Bradley Hills Grove
Bradley House
Bradley Manor 3rd Addn
Bradley Manor 4th Addn
Bradley Park
Bradley Square
Bradmoor
Brady Estates
Brae Burn Heights
Brae Burn Park
Brae Burn Sub
Braemar
Braemar Estates
Braemar Isle
Braemar Isle Condo
Braemar-Tartan Village
Braewood
Bragg Hill
Bramalea Unicorp Boca Raton
Brambleton
Brambleton Landbay
Brambleton Landbay 2
Brambleton Town Center
Brambleton West Park
Brampton Hills
Branch South
Branchdale
Branchester Lakes
Branda Vista Sub Unit
Brandermill
Brandon
Brandon Farms
Brandon Park Sec A
Brandon Valley Subdivision
Brandon Village
Brandonville
Brandy Oaks
Brandy Station
Brandywine
Brandywine @ Thorn
Brandywine Chase
Brandywine Country
Brandywine Crossng
Brandywine Ct
Brandywine Estates
Brandywine Farms
Brandywine Forest
Brandywine Glen
Brandywine Greene
Brandywine Heights
Brandywine Hills
Brandywine Hundred
Brandywine Hunt
Brandywine Iii A Plat Of At Heritage Ridge
Brandywine Manor
Brandywine Park
Brandywine Station
Brandywine Village
Brandywine Walk
Brandywood
Brandywood Estate
Brandywoods
Branford Village
Branson Cove
Brant Beach
Branwell Park
Bravura I Condo
Bravura I Condominiuns
Bravura Ii Condo
Brawner's Estates
Braxton
Bray Run
Bray School
Braycen Pines
Brazilian Court Hotel And Condo
Brazilian Court Hotel And Condominium
Brazilian Of Pb Condo Lt 4 Blk E Royal Park
Brdgton
Breakaway Trails Phase 3 Unit 3a
Breakers Condominium
Breakers Landing, A Condo
Breakers Landing, A Condominium
Breakers West
Breakers West 13
Breakers West 14
Breakers West 16
Breakers West 5
Breakwater
Breakwater Beach
Breakwater Estates
Breakwater Towers
Breakwater Towers Co-Op
Breakwater Villas Condo
Breakwaters Of The Palm B
Breakwaters Of The Palm Be
Breakwaters Of The Palm Beaches Cond Decl Filed 12
Breakwaters Of The Palm Beaches Condo
Breckenridge
Breckenridge A Condo
Breckenridge Estates
Brecknock Twp
Breeding Property
Breeze At Galloway
Breeze Condo
Breeze Haven No 2
Breeze Hill Resort Mobile Home Park
Breeze Of Galloway Condo
Breezes At Palm Aire Condo
Breezeswept Beach Ests
Breezeswept Estates
Breezeswept Estates 1st A
Breezeswept Estates 2nd A
Breezeswept Park Estates
Breezeview Manors
Breezewood
Breezewood Forest
Breezewood Forest East
Breezewood Park Association
Breezewood Subdivision
Breezy Acres
Breezy Heights Sunkist
Breezy Manor Amended
Breezy Oaks
Breezy Park
Breezy Pines Rv Estates C
Breezy Point
Breezyway Manor Add
Breezyway Manor Sec
Breiner Bros
Bren Mar Park
Bren Pointe
Brenda Estates
Brendale Heights
Brendon Village
Brendwood
Brenford Station
Brenford Woods
Brennan Estates
Brenton
Brentwood
Brentwood Condo
Brentwood Lakes Pud Ph Iv
Brentwood Manor
Brentwood Of Boca Ph 2
Brentwood Of Boca Ph 3
Brentwood Of Boca Ph I
Brentwood Park
Brentwood Rev Pl
Brentwood Terrace
Brentwood Townhouse 2
Brentwood Twnhms Ph 1
Breton Bay
Breton Bay/Society Hill
Breton Hill
Breton Park At Davie
Brewers Hill
Brewers Hill Historic District
Brewerytown
Breyer Estates
Breyer Woods
Brian Manors
Briar Bay Twnhs Estates
Briar Bay Urban Park Sec
Briar Bay Urban Park Sec 1
Briar Cliff On The Severn
Briar Creek
Briar Estates
Briar House
Briar Lake
Briar Park
Briar Ridge
Briar Village
Briar Village Plat 1
Briarcliff
Briarcliff At Pga Village
Briarcliff At Woodfield Country Club
Briarcliff Manor
Briarcliffe
Briarcrest
Briarfield
Briargate
Briarridge 1
Briarwood
Briarwood At Indian Springs
Briarwood At Indian Springs Condo
Briarwood Club Condo 1
Briarwood Club Condo 2
Briarwood Club Condo 3
Briarwood Club Condo 4
Briarwood Commons
Briarwood Condo
Briarwood Condo - Eastpointe
Briarwood Court
Briarwood Estates
Briarwood Golf Course
Briarwood South
Briarwood Trace
Briarwood Unit 1
Briary Farms Townhomes
Briary Ridge
Brice Manor
Brick Hill Ridge
Brick House Farm
Brick Mill Farm
Brick Yard Station
Brickell
Brickell 25 Condo
Brickell Bay Club Condo
Brickell Bay Tower Condo
Brickell Biscayne Condo
Brickell Biscayne Marina
Brickell Eight
Brickell Estates
Brickell Flagler
Brickell Flagler Pb 5-44
Brickell Flatiron
Brickell Flatiron Condo
Brickell Forest Condo
Brickell Hammock Un 1
Brickell Hammock Unit No
Brickell Harbour Condo
Brickell Heights
Brickell Heights East
Brickell Heights East Con
Brickell Heights East Cond
Brickell Heights East Condo
Brickell Heights West
Brickell Heights West Con
Brickell House
Brickell House Condo
Brickell Key
Brickell Key Ii
Brickell Key Ii Condo
Brickell Key One Condo
Brickell On The River N
Brickell On The River N T
Brickell On The River S T
Brickell On The River S Twr Condo
Brickell Onthe River North
Brickell Park Condo
Brickell Park I Condo
Brickell Place Condo
Brickell Place Marina
Brickell Place Phase Ii
Brickell Place Phase Ii C
Brickell Point
Brickell Riverview
Brickell Riverview/Lawrenc
Brickell Roads Ii Townhou
Brickell Shores Condo
Brickell Ten
Brickell Ten Condo
Brickell Terrace Condo
Brickell Townhouse Condo
Brickell View West Condo
Brickell Vista Condo
Brickell Way Condo
Brickellhouse
Brickellhouse Condo
Brickells Estates
Brickells Flagler
Bricker
Bridesburg
Bridge Pointe
Bridge Valley At Fur
Bridgepointe
Bridgepointe Subdivision
Bridgeport
Bridgeport Condo Phase 2
Bridges
Bridges Mizner Pud Bridge
Bridges Mizner Pud Bridges S
Bridges Mizner Pud Bridges South Plat Seven
Bridges Mizner Pud Bridges South Plat Six
Bridges Mizner Pud Bridges South Plat Three
Bridges Pl 1
Bridges Pl 3
Bridges Pl 4
Bridges Pl 7
Bridgestone
Bridgeton
Bridgeton City
Bridgeview
Bridgeview - Greenlawn
Bridgeview Cond
Bridgeview Condo
Bridgeville Chase
Bridgewater
Bridgewater At Plantation
Bridgewater Condo
Bridgewater Preserve
Bridgewood Estates
Bridgewood Townhouse
Bridgewood Townhouse Cond
Bridgton
Bridle Creek
Bridle Lake Estates
Bridle Path
Bridle Path Of P B Polo & Country Club
Bridleridge Woods
Bridlewood
Bridlewood Ranches
Briella 1 Condo
Briella 2 Condo
Brier Crest Woods
Briercrest Heights
Brigadoon
Brigadoon Condo
Brigantine
Brigantine Beach
Brigantine North
Briger Pars B, E & F
Briger Pars B, E And F
Briger Pars G, H And J
Briggs And Hoopers
Bright Oaks
Brightfield Farms
Brighton
Brighton -Hamlet 4
Brighton At Barnegat
Brighton At Century Villa
Brighton At Century Village Condo
Brighton Beach
Brighton By The Bay
Brighton East
Brighton Estates
Brighton Lakes
Brighton Lakes Ph 1 Parcel C
Brighton Manor
Brighton Park
Brighton Pines
Brighton Place
Brighton Towers
Brighton Woods
Brightons Meadow Landings
Brightons Meadow Trace
Brightwater
Brightwood
Brightwood Acres
Brightwood Acres East
Brilyn Park
Brimington
Brimington Farm
Bringamosa
Brinkley Manor
Brinkley Overlook
Brinkley Terrace
Brinkley Towns
Brinton Lake Estates
Brinton Woods
Briny Breezes Inc
Briny Breezes Inc.
Briny Breezes, Inc
Brisas Bavaro
Brisas De Punta Cana
Brisas Del Lago Condo
Brisas Del Mar Condo
Briscoe
Briskel Pointe
Bristoe Station
Bristol
Bristol Club At Pga National
Bristol Club At Pga Natl
Bristol Condo
Bristol Court Condo
Bristol Green
Bristol Hall Condo
Bristol House
Bristol Park
Bristol Place
Bristol Pointe
Bristol Reserve
Bristol Springs
Bristol Square
Bristol Tower Condo
Bristol Towers Condo
Bristow
Bristow Manor Estates
Britan Add Amended Plat
Britannia At Quadomain Co
Britannia At Quadomain Condo
Britannia Condo
Britanny
Britford
Brittany
Brittany Commons
Brittany Court
Brittany Court Condo
Brittany Estates
Brittany Farms
Brittany Farms At
Brittany Hills
Brittany Ii
Brittany Manor
Brittany Quarters
Brittany Townhomes
Brittany Woods
Brittingham
Britton Place
Broad Acres
Broad Creek
Broad Creek Landing
Broad Marsh
Broad Run
Broad Run Estates
Broad Run Farms
Broad Run Oaks
Broad Street Park
Broad View Farms
Broaddus
Broadfield At Wilton Farm
Broadhurst
Broadhurst Acres
Broadkill Beach
Broadlands
Broadlands South
Broadmoor
Broadmoor Amd
Broadmoor Manor
Broadmoor Plaza Rev Pl
Broadmoor Sec 1
Broadmoor Sec 2
Broadmoor Sec 4
Broadmoor West
Broadview
Broadview Acres
Broadview Condo
Broadview Country Club
Broadview Country Club Es
Broadview Country Club Estates
Broadview Manor
Broadview Park
Broadview Park Sec 2 Amen
Broadview Park Sec 3
Broadview Park Sec 4
Broadwater Beach
Broadwater Beach Arms I C
Broadway
Broadway Condominiums
Broadway East
Broadway Section Of St Lucie Estates Subdivision
Brock Bridge Townhomes
Brock Hall
Brock Hall Manor
Brock's Subdivision
Brockie
Brockie Green
Brockwood
Broening Manor
Broken Sound Par 13-B
Bromley Estates
Bromley Place
Bromptons At Courthouse
Bromptons At Monument Place
Bronson Heights 4 Add
Bronsons Ridge Replat
Brook Haven Condo
Brook Haven Of Boca Raton
Brook Hill Estates
Brook Hills Estate
Brook Holland Estates
Brook Hollow
Brook Villas
Brookdale
Brooke
Brooke Farm
Brooke Grove
Brooke Jane Manor
Brooke Manor
Brooke Manor Estates
Brooke Meadow
Brooke Point Estates
Brooke Ridge
Brooke-Jane Manor
Brookefield
Brookeside
Brookesmill Estates
Brookeville
Brookeville Knolls
Brookfield
Brookfield (Salem Fields)
Brookfield At Regent's Glen
Brookfield At Trillium Phase B
Brookfield Gardens
Brookfield Gardens North
Brookfield Gardens North No 1
Brookfield On The Magothy
Brookfield On The Potomac
Brookfield Sec 1
Brookfield Square Condo
Brookhaven
Brookhaven Mhp
Brookhill Farms
Brookhurst
Brooking Court Garden
Brookins Mnr
Brookland
Brookland Farm
Brookland Manor
Brookland Mews
Brookland Terrace
Brooklandville
Brooklawn
Brookleigh
Brookline
Brooklyn
Brooklyn Heights
Brooklyn Mh Park
Brooklyn Park
Brookmead Farms
Brookmill Condominiums
Brookmont
Brookneill
Brookridge
Brooks Knolls
Brookshire
Brookshire Estates
Brookshire Manor Sd
Brookside
Brookside 1
Brookside 1 / Golf Brook
Brookside 139-3 B
Brookside 2 / Golf Brook
Brookside Estates
Brookside Farms
Brookside Heights
Brookside Mobile Home Pk
Brookside Park
Brookside Park Condominiums
Brookside Townhomes
Brooksquare Condo
Brookstone
Brookstone Trace
Brooksview
Brookthorpe Hills
Brookview
Brookview Condo
Brookville Knolls
Brookwood
Brookwood Estates
Brookwood Ests
Brookwood Gardens
Brookwood Run
Broomgrass
Brotherton Acres
Broward 2nd Add Amen
Broward Estates Sec 2
Broward Gardens
Broward Manor
Broward Park
Broward Park 25-49 B
Browardale
Browardale 2nd Add Amen P
Browardale 2nd Add Amen Plat
Brown
Brown & Campbell
Brown & Hooff
Brown Sam Jr
Browning Manor
Brownings
Browns Add To Re-Rev Map Of Indian Beach
Browns Mills
Browns Woods
Brownstone Co-Op Apts Inc
Brownstone Manor
Brownstones At Brambleton
Brownstones At Vf
Browntown
Broyhill Crest
Broyhill Forest
Broyhill Glen Gary Park
Broyhill Heights
Broyhill Langley Estates
Broyhill Park
Broyhills Mclean Estates
Brubachers
Bruce Terrace
Brummel Manor
Bruno Estates
Brunswick
Brunswick Crossing
Bruschi Prop 180-105 B
Bruschi Property
Brush Creek Township
Bryan
Bryan Field
Bryan H Edwards-Replat
Bryan Park
Bryan Sub
Bryans Grace
Bryans Green
Bryans Mill
Bryans Village
Bryansville
Bryant Gardens
Bryant Park
Bryant Woods
Bryantown
Bryantown Estates
Bryce Mountain Resort
Bryce Lakeside
Bryce Mountain
Bryce Mountain Resort
Bryce Resort
Bryce Sun Air
Bryn Athyn
Bryn Erin
Bryn Mawr
Bryn Mawr Ocean Towers, A Condominium
Bryn Mawr West Fairmount
Brynwood Square
Brysa Park
Bryson At Woodland Park
Brystol At Wydler
Brystol At Wylder
Bubb H Properties
Buccaneer Estates
Buccaneer Pt (Largo Sound
Buccaneer Pt (Largo Sound Tarpon Basin)
Buchanan Center
Buchert Ridge
Buck Hill Acres
Buck Hill Development
Buckelew Addition
Buckeye Park
Buckhead
Buckhead Ridge
Buckhead Ridge Sub
Buckhead Ridge-5th Add
Buckhill Farms
Buckhorn Crk
Buckhorn Hills Unit No 1
Buckingham
Buckingham At Belair
Buckingham At Century Vil
Buckingham At Century Village
Buckingham At Loudoun Valley
Buckingham Chase
Buckingham Condo
Buckingham East At Centur
Buckingham East At Century
Buckingham Estates
Buckingham Forest
Buckingham Manor
Buckingham Park
Buckingham Park.
Buckingham Place
Buckingham Preserve
Buckingham Springs
Buckingham Station
Buckingham View
Buckingham Village
Buckinghammock
Buckland Oaks
Buckland Valley Fa
Bucklers
Buckley
Buckley Downs
Buckley Towers Condo
Buckley Towers Condo - Ea
Buckley Towers Condo - East Bldg
Buckley Towers Condo - We
Buckleys Reserve
Bucknell Heights
Bucknell Manor
Bucks Cty Countryc
Buckskin Ridge
Bucktown
Bucktown Crossing
Buddys Paradise
Buena Vida
Buena Vista
Buena Vista Drive
Buena Vista Est
Buena Vista Gardens
Buena Vista Heights Addn
Buena Vista Heights Exten
Buena Vista Park
Buena Vista Twp
Buena Vista West
Buffalo Park
Buffalo Township
Bugatti Residences
Building 1a Of Country Club Apts
Building 1b Of Country Cl
Building 1b Of Country Club Apts
Building Eight Of Racquet
Building Eight Of Racquet Club
Building Five Of Racquet
Building Four Of Racquet
Building Nine Of Racquet
Building Seven Of Racquet
Building Six Of Racquet C
Building Three Of Country Club
Building Two Of Racquet C
Bulgari Lighthouse
Bull Run Condo
Bull Run Estates
Bull Run Mobile Park
Bull Run Mountain
Bull Run Mountain Estate
Bull Run/Paradise
Bull Run/Sentry
Bullards
Bulle Rock
Bunche Park
Bunche Park 1 Addn
Bunchville
Bungalow East
Bungalow Park Add
Bunker Hill
Bunker Hill Add 2 To Wpb
Bunker Hill Heights
Bunnell Dev Co
Burdick Park
Burgess
Burgoyne Forest West
Burgundy Hills
Burgundy Place
Burgundy Village
Burholme
Burke Centre
Burke Centre Conservancy
Burke Cove
Burke Lake Cluster
Burke Lake Meadow
Burke Meadows
Burke Professonal Center
Burke Ridge Cluster
Burke Station Square
Burkhead Estates
Burkleigh Square
Burleigh House Condo
Burleigh Manor
Burleith
Burleith - Leighton
Burlington Gardens
Burlington Heights
Burma
Burnham Woods
Burning Knolls
Burning Tree
Burning Tree Estates
Burning Tree Manor
Burning Tree Valley
Burning Tree View
Burns Property
Burnside Reserve
Burnt Branch Acres
Burnt Mills Gar-Vill
Burnt Mills Hills
Burnt Mills Knolls
Burnt Mills Manor
Burnt Store
Burnt Store Isles
Burnt Store Lakes
Burnt Store Meadows
Burnup And Sims Estates
Burnup And Sims Estates 2
Burrell Property
Burton Acres
Burton Point Condo
Burtonsville
Burtonwood Village
Burwood Farms
Bush Addition
Bush Hill Woods
Bush River
Bush River Manor
Bushfield
Bustleton
Butchers Hill
Butler Estates
Butler Farms Sec Two
Butler Farms Section Two
Butler Park Condo
Butler Twp
Butler's Village
Butler/Falls Rd
Butler/Glyndon
Butlers Bridge
Butlers Landing
Butterfield
Buttons Subd Amended Plat
Buttonwood
Buttonwood 1
Buttonwood 2
Buttonwood Bay Club Condo
Buttonwood Estates
Buttonwood Farms
Buttonwood Shores Add
Buttonwood West
Buttonwoods
Buttonwoods Acres
Bvaro
Bvarro
Byan Park
Byant Park
Byers Station
Bynum Ridge
Byram
Byrne Lofts
Byrneley View
Byron Bay Condo
Byron East Condo
Byron Gardens Condo
Byron Park Condo
Byron Towers Condo
Bywood
C & F Subdivision
C & S Subdivision
C B Palms
C G Riviera Sec 12
C Gab Country Club Sec 5
C Gab Country Club Sec 6
C Gab Douglas Sec
C Gab Granada Sec Rev
C Gab Riviera Sec 10
C Gab Riviera Sec Pt 1 Re
C Gab Riviera Sec Pt 2 Re
C Gables Country Club Sec
C Gables Granada Sec Rev
C Gables Riviera Sec 10
C Gables Riviera Sec 12
C H E Acres
C J C Sub
C M Lockhart
C P Adams
C.G.B. Subdivision
C3
Ca` Della Serenita
Cabana Bay Village Condo
Cabana City
Cabbage Hill
Cabbage Wood Ranches
Cabbage Woods
Cabbage Woods Ranches
Cabeza De Toro
Cabin At Capon Bridge
Cabin Branch
Cabin Branch Farm
Cabin John
Cabin John Park
Cabin Point
Cabin Point / Glebe Harbor
Cabin Point-Montross
Cabo Rio Rv Resort
Cabo Rio, Rv Resort
Cabots Point
Cabrera
Cabrera Hills
Cacapon
Cacapon East
Cacapon Rapids
Cacapon Retreat
Cacapon River Colony
Cacapon River Meadows
Cacapon River Rapids
Cacapon South
Cacapon View
Cacique
Cadeca Estates
Cadence
Cadence At Lansdowne
Cadence At Tradition
Cadence Phase 1
Cadence Phase B1
Cadence Phase I
Cadence Phase Ii
Cadence Wg5d Phase 1
Cadwalader Heights
Cadwalader Terrace
Cagan Crossing East
Caine Harbor Mile
Caine Keys Ii
Caine Keys Ii Ext
Caine Woods
Caines Creek
Caisson Crossing
Cajuiles, Casa De Campo, Dominican Republic
Calabria Ii Condo
Calais @ Longridge
Calais Condo
Calais Drum Bay
Calcutta First Addition
Calderon
Caldwell Martin Townhomes
Caldwells Add Ocala
Caledon Crossing
Caledonia
Calenzano
Caleton Estate
Cali Greens
Caliban
Caliban Ridge
California Courts Condo
California Hills
California Mansions
California Village
California, Lima - Peru
Californian
Calistoga Villas
Caliza Townhouse
Caliza Townhouses
Callao
Callapatscink
Callaway
Callaway-Garrison
Calle Conde De Penalver
Callowhill
Calm Retreat
Calmes Neck Estates
Caln Crest
Caln Twp
Calnshire Estates
Caloosa
Caloosa Cove
Caloosa Hammock
Caloosa Lakes Ph 1
Caloosa Shores
Calossa Cove
Caltor Manor
Caltor Meadows
Calusa Campground
Calusa Club Estates
Calusa Club Estates 5th A
Calusa Club Estates 6th A
Calusa Club Estates Pt 1
Calusa Club Vil Condo Bld
Calusa Club Vilg Bldg D S
Calusa Club Vilg Bldg D So Condo
Calusa Club Village Condo
Calusa Point
Calusa Village
Calvarese Farms
Calvert
Calvert Beach Estates
Calvert Beach Park
Calvert Hills
Calvert Homes
Calverton
Calverton Heights
Calypso Cay Condo
Cambria At Hammock Dunes
Cambria Square
Cambria Village
Cambrian Hills
Cambridge
Cambridge At Abacoa
Cambridge At Aberdeen
Cambridge At Century
Cambridge At Century Vill
Cambridge At Century Villa
Cambridge At Century Village
Cambridge At Heritage Ridge
Cambridge B Condo
Cambridge C Condo
Cambridge Chase
Cambridge Commons
Cambridge Condo
Cambridge Crossing
Cambridge D Condo
Cambridge Estates First A
Cambridge F Condo
Cambridge Farms
Cambridge Green
Cambridge Hall
Cambridge Heights
Cambridge Historic District
Cambridge House East
Cambridge House West
Cambridge Knoll
Cambridge Lawns
Cambridge Lawns In Pb 20-
Cambridge Park
Cambridge Station
Cambridge Towers Condo
Cambridge West
Camden
Camden B Condos
Camden Commons
Camden Condos
Camden Crossing
Camden House At Oak Harbor
Camelback Village
Camellia Park
Camelot
Camelot Estates
Camelot Gardens Ph 1 Thru 11
Camelot Gardens Phases 1 Thru 11
Camelot Meadows
Camelot Mhp
Camelot Square
Camelot Three Condo
Camelot Two Condo
Camelot Village
Camelot Village Sec 1
Camelot Village Sec 2
Camelot Village Sec 3
Camelot Village Sec 4
Cameo Village
Cameron Circle
Cameron Grove
Cameron Grove Condo 1>
Cameron Grove Condo Iii>
Cameron Grove Condo Iv>
Cameron Heights
Cameron Hills
Cameron Lake
Cameron Park
Cameron Station
Cameron Village
Cameron Woods
Camesta Sub
Camille Gardens
Camino Circle Condo
Camino Gardens
Camino Gardens Sec 1
Camino Gardens Sec 3
Camino Gardens Villas
Camino North Condo
Camino Real Estates 1st A
Camino Real Village Condo
Camner Estates 1st Addn
Camner Gables
Camner Gables 1st Addn Rev
Camotop
Camp At Mosby Station
Camp Geary Estates
Camp Hill
Camp Hill Borough
Camp Hill Heights
Camp Springs
Camp Strauss
Camp/Lake Strause
Campbell Crossing Circle
Campbell Point
Campbells Landing
Campbells Trace
Campestre
Campmeeting, Mt Gretna
Campo Alegre
Campus Heights
Campus Hills
Campus Lakes
Can Furnet,Sta Eulalia,Ibz
Cana Bay
Cana Rock
Cana Rock Star
Cana Rock Star Edificio
Canadian Ocean Breeze Con
Canadian Ocean Breeze Condo
Canady Groves
Canal By Iq
Canal Corkran
Canal District At Fort Dupont
Canal Estates
Canal Groves
Canal Landing
Canal Place
Canal Pointe
Canal Run
Canal Street
Canal View
Canal Woods Cm
Canal Woods Ii
Canal Woods Iii
Canalake
Canalake Replat
Canarias At Downtown Doral
Canarias East
Canary Creek
Canary Palm Club
Canaveral Groves Subd
Canaveral Realty Unrec
Canbury Woods
Candace W Mossler Propert
Candelight Groves
Candle Brook
Candle Ridge
Candlebrook
Candlelight Ridge
Candlelight Villag
Candler Hills West Stonebridge, On Top Of The Worl
Candlewick Estates
Candlewood
Candlewood Park
Candy Hill
Canfield Village
Cannery Row
Cannery Village
Canning Subdivision
Cannon Bluff
Cannon Farm
Cannon Hill
Cannon Knolls
Cannon Mills
Cannon Ridge
Cannon Sub
Canoe Creek
Canongate Condo
Canongate Condo No One
Canongate Condominium
Canovanas
Cantagirone Natura
Cantamar
Canter Creek
Canter Estates
Canter Estates L-313
Canter Village
Canterberry Forest
Canterbury
Canterbury At Quantum Village
Canterbury At Quantum Villages
Canterbury Condos
Canterbury Estates
Canterbury Hills
Canterbury Mews
Canterbury Park
Canterbury Place
Canterbury Riding
Canterbury Square
Canterbury Station
Canterbury Village
Canterwood
Cantisano Sub
Canton
Canton Cove
Canton De Mora Costa Rica
Canton De Mora San Jose Cr
Canton Historic District
Canton Mills
Canton Square
Canton Waterfront
Cantwell Ridge
Canvas Condo
Canvasback Cove
Canyon Club Marina
Canyon Isles
Canyon Isles 3
Canyon Lakes 6
Canyon Lakes Preserve Are
Canyon Springs
Canyon Trails
Cap Cana
Cap Cana Marina
Cape Coral
Cape Atlantic Estates Unre
Cape Atlantic Estates Unrecorded
Cape Charles
Cape Coral
Cape Coral Lee County
Cape Coral 66
Cape Coral Lee County Indu
Cape Coral Sub Division
Cape Coral Subdivision
Cape Coral Unit 10
Cape Coral Unit 26
Cape Coral Unit 32
Cape Coral Unit 33
Cape Coral Unit 34 Blk.242
Cape Coral Unit 36
Cape Coral Unit 37
Cape Coral Unit 38
Cape Coral Unit 41
Cape Coral Unit 51
Cape Coral Unit 54
Cape Coral Unit 55
Cape Coral Unit 59
Cape Coral Unit 60
Cape Coral Unit 61
Cape Coral Unit 63
Cape Coral Unit 66
Cape Coral Unit 7, Blk 364
Cape Coral Unit 70
Cape Coral Unit 84
Cape Coral Unit 90
Cape Coral26.742601
Cape Fear
Cape Fla Sub Sec 2
Cape Florida Club Condo P
Cape Florida Sub Sec 3
Cape Haze
Cape Horn Road
Cape Horn South
Cape Isle Of Wight
Cape May
Cape May Beach
Cape May Court House
Cape May Crt Hse
Cape May Ct. House.
Cape Orl Ests Ut 12a
Cape Orlando Estates
Cape Orlando Estates Unit
Cape Pointe Of Jonathans Landing
Cape St Claire
Cape St John
Cape Windsor
Capec Coral
Capella 1
Capella 2
Capes Cove Mhp
Capistara
Capistrano
Capital Area
Capital Court
Capital Estates
Capital Heights
Capital Sub Phoenix Pk
Capitol Gateway
Capitol Heights
Capitol Hill
Capitol Hill East
Capitol Hill North
Capitol Mobile Park
Capitol Park
Capitol Park Iv
Capitol Quarter
Capitol Riverfront
Capitol View
Capitol View Park
Caple Farms South
Caples Amd Pl
Capobella Condo
Capon River Vista
Capon Woods Resort
Caposoprano
Capri At Oasis
Capri Gardens Condo
Capri Of Singer Island Condo
Capri Of Venice
Capri South Beach Condo
Capstan I Condo
Captain Jax Mobile
Captain's Cove
Captain's Creek (Aka Orchid Bay)
Captains Grant
Captains Hill
Captains Walk Condo
Captains Way
Captiva
Captiva Condo A
Captiva Condo B
Captiva Condo D
Captiva Condo E
Captiva Condo F
Carate, Osa Peninsula
Caravel At Calusa
Caravel Condominium
Caravel Condominium Apart
Caravel Condominium Apartments
Caravel Country
Caravel Farms
Caravel Hunt
Caravel Woods
Caravelle
Caravelle Condo
Carbaugh Land
Carbonell Condo
Carderock
Carderock Springs
Cardiff
Cardinal Court
Cardinal Crest
Cardinal Estates
Cardinal Forest
Cardinal Glen
Cardinal Grove
Cardinal House
Cardinal Meadows
Cardinal Pointe
Cardinal Ridge
Cardinal Square
Cardinal View
Cardinal Woods
Cardinal's Crest
Cardington
Care
Carefree Acres
Caretta
Carey Heights
Carey's
Cariari
Caribbean At Boca Bayou C
Caribbean At Boca Bayou Condo
Caribbean Breeze Condo
Caribbean Estates
Caribbean Gardens Condo
Caribbean House Condo
Caribbean Isles Villas Co
Caribbean Isles Villas Condo
Caribbean Keys
Caribbean Towers Condo
Caribbean Town
Caribe At Bonita Lakes
Caribe Co Op Apts Inc
Caribe Co-Op
Caribe Cove Ph 4
Caribe Lakes Phase I
Caribe Lakes Phase Ii
Carillon
Carillon Condo
Caris Glenne
Carisbrooke
Carl Byoir
Carl Byoir Sub
Carleton Oaks
Carlisle
Carlisle At Hamptons West
Carlisle Borough
Carlisle Estates
Carlisle Heights
Carlisle On The Ocean
Carlisle On The Ocean Condo
Carlisle Vil
Carll Estates
Carll Heights
Carlsward Subdivision
Carlton Bay Condo
Carlton Condo
Carlton County Estates
Carlton House
Carlton House Condo
Carlton Place Condo
Carlton Square
Carlton Terrace
Carlton Terrace Co-Op
Carlton Terrace North Co-Op
Carlton Tower Condo
Carlton Vero Beach Condominium
Carltons Landing
Carlyle Condominium
Carlyle Condominium Of Crescent Beach
Carlyle House
Carlyle House Condo
Carlyle Plaza Condo
Carlyle Square
Carlyle Towers
Carlyn Place
Carmel
Carmel At Calif Club Cond
Carmel At California Cl C
Carmel At California Clb
Carmel At California Club
Carmel Cove
Carmel Lakes Condo No 3
Carmel Lakes Condo No 4
Carmel Townhomes Condo
Carmel Villas Condo
Carmen Woods
Carmichael Estates
Carmody Hills
Carmody Hills 02
Carnaby Square
Carney
Carney Grove
Carney Heights
Carney View
Carney/Cub Hill
Carneys Point
Carol Acres East
Carol City
Carol City 1 St Addn
Carol City 2nd Addn
Carol City 3rd Addn
Carol City 6th Addn
Carol City Gardens 2nd Ad
Carol City Gardens 2nd Addn
Carol City Gdns 1st Addn
Carol City Lake Steven Es
Carol City Lake Steven Estates
Carol City Red Road Manor
Carol City Rev Plat
Carol Estates
Carole Anne Park
Carole Anne Pk 1st Addn
Carole Helms Manor
Carole Highlands
Carolina Court A R-S
Carolina Heights
Carolina Heights 2nd Sec
Carolina Landings At University Place B
Carolina Trace Townhomes
Carolinda Park
Caroline Farms
Caroline Pines
Caroline Village
Caroll Valley
Caroloc Estates
Carolyn Sub
Carolynn Townhouse Condo
Carousel Estates
Carpenter's Ridge
Carpenters Point
Carr At Cedar Lakes
Carr At Pinecrest
Carrara Village Condo
Carrcroft
Carrcroft Crest
Carriage Circle
Carriage Club North
Carriage Crossing
Carriage Crossings
Carriage Gate Condo
Carriage Glen
Carriage Hill
Carriage Hill At Falls
Carriage Hills
Carriage Hills Townhouse
Carriage Homes
Carriage Homes At Bentley
Carriage Homes At Frenchmans Harbor Condo
Carriage Homes At Terrama
Carriage Homes At Terramar
Carriage House Chase
Carriage Houses I Condo
Carriage Light
Carriage Light Condo
Carriage Mill Farms
Carriage Park
Carriage Park At Law
Carriage Pines/Lake Vill
Carriage Pointe
Carriage Pointe At Aquia
Carriage Pointe Estates Replat
Carriage Pointe Townhomes Pud
Carriage Ridge
Carriage Run
Carriage Stop
Carriage Walk
Carriage Works
Carriagehouserowbran
Carriages On Elm
Carrico Knolls
Carrington
Carrington At Coconut Cre
Carrington At Coconut Creek
Carrington Park A Condo
Carroll County Farmettes
Carroll Crest
Carroll Estates
Carroll Heights
Carroll Knolls
Carroll Manor
Carroll Manor Ridge
Carroll Park
Carroll Park Manor
Carroll Sub
Carroll Township
Carroll Twp
Carroll Valley
Carroll Valley Borough
Carroll Villa
Carroll Vista
Carroll Walk Condo
Carroll Winde
Carroll Wood Estates
Carroll-South Hilton
Carrollan Gardens
Carrolls Creek
Carrolls Green
Carrollton
Carrollton Manor
Carrollton Ridge
Carrollton- Millers Addn
Carrolltowne
Carrollwood
Carrollwood Manor
Carron House Condo
Carron House Condo / Boca Highland
Carrsbrook
Carry Family
Carsin Run Estates 14/54
Carsondale
Cartagena Highlands
Cartagena, Bolivar.
Cartago
Carter
Carter Hill
Carter's Mill
Carters
Carters Addn To C Gr
Carters Addn To Coconut G
Carters Cove
Carters Glen
Cartertwon
Carterwood
Carvel Beach
Carver Heights
Carver Heights First Add
Carver Langston
Carver Manor
Carver Park
Carver Place
Carver Ranches
Carver Ranches Business S
Carvers Run
Carves Ranches
Carville Grove
Casa 25 Club Campestre
Casa Ahs
Casa Amaita
Casa Bella
Casa Bella By B&B Italia
Casa Bella Condo Unit 1804
Casa Bella Condominium
Casa Bella Residence
Casa Bella Residences
Casa Boutique Luna Lucia
Casa Caselles (2.0)
Casa Coral Condo
Casa Costa
Casa Costa Condo
Casa De Campo La Romana
Casa De Marbella
Casa Del Mar
Casa Del Mar Condo
Casa Del Monte
Casa Del Rey Condo
Casa Del Rio Condo
Casa Del Sol Condo
Casa Del Sol Of Tequesta
Casa Del Sur
Casa Granada Condo
Casa Grande I Towers Cond
Casa La Quinta
Casa La Quinta Condo
Casa Lago 1st Addn
Casa Loma In D.L.Clinch Grant-10-20
Casa Murano
Casa Murano Condo
Casa Nella Foresta Of Wellington 1
Casa Nova Condo Apts Inc
Casa Paradiso
Casa Paradiso Co-Op
Casa Paradiso North Co-Op
Casa Real Condo
Casa Verano Condo
Casa Wyn
Casabella
Casablanca Isles Condo
Casablanca Of South Beach
Casades At St Lucie West Phase 3
Casamar
Casamar Condo
Casas De Carlos Condo
Casas Ensan Rafael Escazu
Cascade
Cascade At Holly Heights
Cascade Falls Condo
Cascade Lakes
Cascade Landing
Cascades
Cascades - Wedgewood
Cascades At St Lucie
Cascades At St Lucie West
Cascades At St Lucie West Phase 1
Cascades At St Lucie West Phase 1 Plat No 110
Cascades At St Lucie West Phase 1 St Lucie West
Cascades At St Lucie West Phase 1 St Lucie West Pl
Cascades At St Lucie West Phase 4
Cascades At St Lucie West Phase 5
Cascades At St Lucie West Phase 6
Cascades At St. Lucie West
Cascades Lowes Island
Cascades Of Lauderhill
Cascades Of Lauderhill 2
Cascades Phase 3
Cascades Place Condominium
Cascata At Miralago,Triple H Ranch
Caseil Heights Sec 1
Caseras/Parkland Golf
Casey Highlands
Casey Hills
Caseyview
Cash Valley
Cashell Estates
Cashell Manor
Cashell Woods
Casons Inglis Acres Unit 3
Casper Sub
Cassa Bella
Cassa Brickell Condo
Cassandra Estates
Casseekey Island At Jonathans Landing
Casseekey Island Dock Condo
Cassel's Point
Cassia Estates
Cassia The Residences
Castaway Cove Wave V
Castaway Estates
Castel
Castel Gardens
Castellina
Castillian Club Condo
Castillo Grand Hotel Resi
Castillo Grand Residences
Castle Apartments
Castle Apartments 1 Condo
Castle Apartments 11 Cond
Castle Apartments 11 Condo
Castle Apartments 12 Cond
Castle Apartments 12 Condo
Castle Apartments 14 Condo
Castle Apartments 15 Cond
Castle Apartments 15 Condo
Castle Apartments 16 Cond
Castle Apartments 16 Condo
Castle Apartments 17 Cond
Castle Apartments 2 Condo
Castle Apartments 3 Condo
Castle Apartments 5 Condo
Castle Apartments 6 Condo
Castle Apartments 7 Condo
Castle Apartments 8 Condo
Castle Apartments 9 Condo
Castle Apts
Castle Apts Condo
Castle Beach Club Condo
Castle Estates
Castle Gardens
Castle Gardens #14
Castle Gardens Apartments
Castle Gardens No 2
Castle Harbour Condo
Castle Heights
Castle Hill Community
Castle Hills
Castle Marina
Castle Pines
Castle Pines Condomi
Castle Pines Condominium
Castle Rock
Castle Stone At White Marsh
Castlefield
Castlewood
Castlewood Town Villas Condo
Castor Gardens
Casuarina At Delray Condo
Casuarina Condo
Casuarinas
Caswallen
Catalina / Polo Club
Catalina Cove
Catalina Estates
Catalina Heights
Catalina Hills
Catalina Lakes
Catalina Place
Catalonia Condo
Catalonia Lake Villas
Catalpa Cove
Catalpa Hills Townhouses
Catamaran Ii Condominium
Catamaran L Condominium
Catamaran Ll Condominium
Catania Condo
Catching Cove
Catesby Howard
Catharpin Farms
Cathedral Heights
Catherine
Catholic University
Catoctin
Catoctin Creeks
Catoctin Highlands
Catoctin Mt
Catoctin Ridge Estates
Caton Hills
Catonsville
Catonsville Gardens
Catonsville Heights
Catonsville Manor
Catonsville Pines
Cats Paw Cove
Cattail Creek
Cattail Creek Country Club
Cattail Crossing
Cattail Overlook
Cattail Run
Cattail Villas
Cattell Tract
Cattle Lands
Causeway Park
Cavalcade
Cavalia Estates
Cavalier Arms Condo
Cavalier Estates
Cavalier Park
Cavalry Ridge
Cavalry Run
Cave Colony
Cave Quarters
Cave Spring
Caves Valley
Caves Valley Golf Club
Cay Condominium
Cay Polynesia Condo
Cayman Village A Condo
Cayman Village C Condo
Cayuga Estates 1
Caywoods
Caywoods Subdivision
Cazadores Sub
Cazadores Sub South
Cds1 Charles Dougherty Subdivision
Cearfoss
Cecil County
Cecil Woods
Cecil's Mill
Cecilton
Cedar At Keys Gate
Cedar Bay
Cedar Beach
Cedar Bluff
Cedar Cay
Cedar Cliff
Cedar Cliff Manor
Cedar Cluster Twnhse
Cedar Commons
Cedar Cove
Cedar Creek
Cedar Creek 1st Addn
Cedar Creek 2nd Addn
Cedar Crest
Cedar Croft
Cedar Farms
Cedar Field
Cedar Gardens Townhouses
Cedar Glen Homes Co - Op
Cedar Glen Lakes
Cedar Glen West
Cedar Glenn Condo
Cedar Glenn Condo Apts Ea
Cedar Grove
Cedar Grove At Crofton
Cedar Grove Ests
Cedar Grove Farm
Cedar Grove Park
Cedar Grove Road
Cedar Hammock
Cedar Haven
Cedar Heights
Cedar Hgts
Cedar Hill
Cedar Hills East
Cedar Hollow
Cedar Key Plantation
Cedar Knoll
Cedar Knoll At Tanhouse
Cedar Lake
Cedar Lakes
Cedar Landing
Cedar Lane Farms
Cedar Lawn
Cedar Lee Condominium
Cedar Manor
Cedar Manor Mhp
Cedar Meadows
Cedar Meadows Airpark
Cedar Mill
Cedar Park
Cedar Point
Cedar Point 3
Cedar Point East
Cedar Point North
Cedar Pointe
Cedar Pointe Condo
Cedar Pointe Condo Village 06
Cedar Pointe Condo Village 07
Cedar Pointe Condo Village 08
Cedar Pointe Condo Village 7
Cedar Pointe Condo Village 7 - Building 7
Cedar Pointe Condo Village 8
Cedar Ridge
Cedar Ridge Estates
Cedar Run
Cedar Shores
Cedar Spring
Cedar Springs
Cedar Street
Cedar Terrace
Cedar Valley
Cedar Valley Condominium
Cedar Village
Cedar Woods Homes Condo
Cedarbrook
Cedarbrook Crossin
Cedarbrooke
Cedarcrest
Cedarcrest Village
Cedarcroft
Cedarcroft Historic District
Cedarday
Cedarhurst
Cedarhurst Acres
Cedarhurst On The Bay
Cedarlawn
Cedarmeade
Cedarmere
Cedars
Cedars Woods Homes Condo
Cedarview Estates
Cedarville Mobile Home Park
Cedarwood Park
Cedmont
Cedonia
Celebrate
Celebrate Virginia North
Celebration
Celebration Point Condo #
Celebration Point Condo N
Celebration Pointe
Cementopia
Census County Division
Centaurian Woods
Centennial Estates
Centennial Hill
Centennial Lake
Centennial Manor
Centennial Mill
Centennial Park
Centennial Plaza One
Centennial Ridge
Centennial Sec 02
Centennial Sec 2
Centennial Sec 3
Centennial Station
Centennial Village
Center Ave Condos
Center City
Center City One
Center Court Condominium
Center Island
Center Point Farm
Center Ridge
Center Terrace
Centerpoint
Centerpointe
Centerpointe Condo
Centex-Replat Of A Portio
Central
Central Acres
Central Acres Section 1
Central Allapattah
Central Baptist Church Pl
Central Beach
Central Bus Dist
Central Business District
Central Carillon Beach
Central Carillon Beach Co
Central Commercial Homest
Central Comml Homestead
Central Crossing
Central Dania Heights
Central Forest Park
Central Heights
Central Lancaster City
Central Manor Sec 1
Central Miami Part 1
Central Miami Part 2
Central Miami Part 4
Central Miami Part 6
Central Miami Part 7
Central Miami Part L
Central Miami Pt 1
Central Miami Pt 3
Central Oakland Park
Central Parc South
Central Park
Central Park Condo
Central Park Heights
Central Park South Palm Beach
Central Park Townhomes
Central Park West
Central Park/Peninsula Village Greens
Central Park; Peninsula Village Greens
Central Parke At Lowes Island
Central Parke Colonial Charles
Central Village
Central/Downtown
Centralis Residences
Centre Ave Condos
Centre City
Centre Court Condo
Centre Hall
Centre Hill Courts Condo
Centre Hills
Centre Hills Village
Centre Park At Stone Ridge
Centre Park Histor
Centre Ridge
Centreville
Centreville Crossing
Centreville Farms
Centreville Green
Centro
Centro B14l14
Centro B15l11
Centro B2l1
Centro B3l5
Centro B8l1
Centro B8l6
Centro Condo
Centura
Centura Parc
Centura Parc At Coconut C
Centura Parc At Coconut Creek
Century At Cutler Bay
Century Breeze
Century Estates
Century Estates 1st Addn
Century Estates North
Century Garden Condo
Century Garden South
Century Gardens
Century Gardens At Tamiam
Century Gardens South
Century Gardens Villas
Century Heights
Century Oak
Century Oasis Estates
Century Parc Condo
Century Park
Century Park Condo
Century Park Condo No 2
Century Park Place
Century Park South
Century Park Square
Century Plaza
Century Plaza Condo
Century Prestige
Century Row
Century South
Century Star Sub
Century Village
Century Village - Andover Condo
Century Village - Andover Condos
Century Village - Berkshire A Thru K Condos
Century Village - Cambridge Condo
Century Village - Chatham Condos
Century Village - Easthampton
Century Village - Greenbrier Condo
Century Village - Northampton Condos
Century Village - Salisbury Condos
Century Village - Wellington Condos
Century Village -Coventry Condo
Century Village -Hastings Condos
Century Village -Northampton Condos
Century Village / Chatham Condos
Century Village / Easthampton Condo
Century Village / Kent Condos
Century Village / Norwich Condo
Century Village / Oxford Condo
Century Village / Plymouth 5 Condo
Century Village / Plymouth Condos A To F
Century Village / Salisbury Condos
Century Village / Windsor Condos
Century Village /Bedford Condo
Century Village Boca Raton
Century Village Cambridge
Century Village Chatham Condos
Century Village Condo
Century Village East
Century Village Golfs Edge Conds A Thru G
Century Village Newport A
Century Village Sheffield Condos A To Q
Century Village Venton F
Century Village Windsor Condos
Century Village- Camden Condos
Century Village-Andover
Century Villas
Cerda Sub
Cerritos
Cerro Alto
Cerro Real
Cerros De Fizebad
Ceton Court
Ch10 Commercial Highlands
Ch4 Commercial Hlghlands
Ch7 Commercial Highlands
Chadds Ford
Chadds Ford Knoll
Chadds Ford Landing
Chaddsford
Chaddsford-Plat1 Section
Chadswood
Chadwick
Chadwick Manor
Chadwick Pl
Chadwyck
Chain Bridge
Chain O' Lakes Sub
Chalet 4 1 Sandalwood
Chalet 4 3
Chalet De La Rance
Chalfont
Chalfonte
Chalfonte Condo
Challedon
Chambers Hill
Chambers Hill Commons
Chambers Land Co Sub
Chambers Land Co Sub Ne1/
Chambers Land Co Sub Ne1/4
Chambers Land Co Sub Nw1/
Chambers Land Co Sub Se1/4
Chambers Land Co Sub Sw1/4
Chambers Land Company Sub
Chambers Pointe
Chambers Ridge
Chambers Sub
Chambers Sub Ne1/4
Chambers Sub Nw1/4
Chambers Sub Sw1/4
Chambers Woods
Chambersburg
Chambersburg Borough
Chambersburg North End
Chame
Champion Lakes
Champions
Champions Club
Champions Gate
Championsgate
Champlain Towers East Con
Champlain Towers North Co
Chana Rose Estates
Chance Acres
Chance Cove
Chancellor Crossing
Chancellor Green
Chancellor Hall Condo
Chancellor Meadows
Chancellor Park
Chancellor West
Chancery Of Kingstowne
Chandeleur Woods
Chandler Point
Chandlers Crossing
Chandlers Glen
Chandon
Chandon Woods
Chaney Heights
Chaneys Choice
Chaneyville
Chante-Clare
Chanteclair Villas
Chanteclair Villas Condo Three
Chanteclair Villas Condo Two
Chanticleer
Chantilly
Chantilly Condo
Chantilly Farm
Chantilly Manor
Chantilly Park
Chaparral P.U.D Phase
Chapel
Chapel Court Sec 3
Chapel Creek
Chapel Eastates
Chapel Estates
Chapel Forge At Belair
Chapel Gate
Chapel Glen
Chapel Green
Chapel Grove
Chapel Hill
Chapel Hill Manor
Chapel Hill/Forest Hills
Chapel Hills
Chapel Lake Estates
Chapel Oaks
Chapel Point Woods
Chapel Ridge
Chapel Trail Ii
Chapel Trail Replat
Chapel Trail Replat Sectio
Chapel View
Chapel Village
Chapel Woods
Chapelgate
Chaple Ridge
Chapline Place
Chapman
Chapman Farm
Chapman Field Heights
Chapman Glen
Chapman Row At Twinbrook Metro
Chapman's
Chapman's Country Li
Chapmans Corner
Charing Cross
Charity Gardens
Charlene
Charles Conrad
Charles County
Charles County Gardens
Charles Court
Charles Crossing
Charles Glass
Charles Hill
Charles Subdivision
Charles Town
Charles Village
Charlesbrooke At Pinehurst
Charlesgate
Charlesmont
Charleston Commons
Charleston Commons 2
Charleston Court At Abacoa
Charleston Oaks Phase 2
Charleston On The Green At Heritage Ridge
Charleston On The Green Condo
Charleston Riding
Charleston Shores
Charleston Square Townhm
Charlestown
Charlestown Commons
Charlestown Crossing
Charlestown Hunt
Charlestown Knoll
Charlestown Manor
Charlestown Meadows
Charlestown Oaks
Charlestown Twp
Charlestown Village
Charlestowne
Charlestowne Village
Charlie Creek Acreage
Charlotte County
Charlotte Estates
Charlotte Harbor Highlands
Charlotte Harbour
Charlottesville
Charlton Heights
Charolais
Charowood
Charter Club
Charter Club At Martin Downs
Charter Club Condo
Charter Club Of Palm Beac
Charter Club Of Palm Beach
Charter Club Of Palm Beach Condo
Charterfield Landing
Chartley
Chartley East
Chartridge
Chartwell On The Severn
Chas A Porter Addition
Chas Clabo Addn Lot : 14
Chase
Chase At Belmont Country
Chase At Bethesda Codm
Chase Oaks
Chase Point
Chase Pointe
Chase's Subdivision
Chase-Hessen Estates
Chaselynd Hills
Chasewood North Of Jupiter
Chasewood Of Jupiter
Chasewood Of Jupiter Condo
Chateau
Chateau At Astonia
Chateau At Boca Grove Pla
Chateau Beach
Chateau Beach Condo
Chateau Chaumont Ibis Isle Condo
Chateau De Langlade
Chateau De Ville Condo
Chateau Dreamer Condo
Chateau Gardens Condo
Chateau In The Pines
Chateau Latour
Chateau Mar Condo
Chateau On The Knoll
Chateau Park Sec
Chateau Royal Estates
Chateau Terese Condominium
Chateau Woods
Chateau-Gai
Chateaubleau At Hammocks
Chateaubleau Villas Condo
Chateaubleau Villas Midway Condo
Chateaulaine
Chateaus
Chateaux
Chateaux Condo
Chatham
Chatham Village
Chatham At Aqua Condo
Chatham Condos
Chatham Cove
Chatham Creek
Chatham Glenn
Chatham Heights
Chatham Hills
Chatham Landing
Chatham Mews
Chatham Park
Chatham Vil Of Tow
Chatham Woods
Chathams Ford Estates
Chatillon Hall Condominiu
Chatsworth Village Condo
Chattanooga Park
Chatwood
Cheasapeake Estates
Chefneux Sub
Chelesa Villa
Chelmsford
Chelsea
Chelsea Bayview Condo
Chelsea Beach
Chelsea Courts
Chelsea Estates
Chelsea Farms
Chelsea Heights
Chelsea House
Chelsea Manor
Chelsea One
Chelsea Subdivision
Chelsea Woods Condo
Chelsea Woods Courts
Chelsey Park
Chelten Hills
Cheltenham
Cheltenham Forest
Cheltenham Vil
Cheltenham Woods
Chenoak Manor
Cherlynn Estates
Cherokee Ranch
Cherokee River Ranch
Cheroy Woods
Cherrington
Cherry Creek
Cherry Creek Estates
Cherry Creek Estates 57-8
Cherry Gardens
Cherry Glen
Cherry Glen Condos
Cherry Grove Part 1
Cherry Grove Part 8
Cherry Grove Part Three
Cherry Heights
Cherry Hill
Cherry Hill Estate
Cherry Hill Manor
Cherry Hill Mobile Home Park
Cherry Hill Subd
Cherry Hill Townhouses
Cherry Hills
Cherry Hollow
Cherry Lane
Cherry Orchard Estates
Cherry Parke
Cherry Run
Cherry Run Estates
Cherry Tree
Cherry Valley
Cherry Valley Cc
Cherry Walk Estates
Cherrydale
Cherrytree Park
Cherryvale
Cherrywood
Cherrywood Condo
Cherrywood Estates
Cherrywood Estates Phase 1
Chesaco Park
Chesapeake By Del Webb
Chesapeake City
Chesapeake Club
Chesapeake Club Condos
Chesapeake Cove Estates
Chesapeake Estates
Chesapeake Harbour
Chesapeake Haven
Chesapeake Heights
Chesapeake Isle
Chesapeake Landing
Chesapeake Lighthouse
Chesapeake Meadow
Chesapeake Mobile Court
Chesapeake Ranch Estates
Chesapeake Stone Manor
Chesapeake Terrace
Chesapeake Village
Cheshire Hunt
Chesley Estates
Chester
Chester Arms
Chester City
Chester Harbor
Chester Heights
Chester Hts
Chester Park
Chester River Beach
Chester River Landing
Chester Springs Crossing
Chesterbrook
Chesterbrook Estates
Chesterbrook Farm
Chesterbrook Gardens
Chesterbrook Woods
Chesterbrook/Newpo
Chesterfield
Chesterfield A Condominium
Chesterfield Downs
Chesterfield Estates
Chesterfield Mews
Chesterford
Chestershire
Chestertown
Chestertown Historic District
Chesterview
Chestnut Crossing
Chestnut Gable
Chestnut Glen
Chestnut Grove
Chestnut Grove Estates
Chestnut Grove Farm
Chestnut Hill
Chestnut Hill Cove
Chestnut Hill Estates
Chestnut Hill Farms
Chestnut Hill Preserves
Chestnut Hills
Chestnut Knoll Acres
Chestnut Knolls
Chestnut Meadows
Chestnut Park
Chestnut Place
Chestnut Point East
Chestnut Ridge
Chestnut Ridge Manor
Chestnut Street
Chestnut Terrace
Chestnut Valley
Chestnut Woods
Chestnut Woods Sub
Cheswold
Cheswolde
Cheverly
Cheverly Manor
Cheverly West
Chevy Chase
Chevy Chase Amd Plat
Chevy Chase Crest
Chevy Chase Crossing
Chevy Chase Hills
Chevy Chase Park
Chevy Chase View
Chevy Chase Village
Chewsville
Childs
Chillum
Chillum Estates
Chillum Terrace
Chimney Hill
Chinatown
Chincoteague
Chinquapin Park
Chippendale
Chipper Condo
Chiu Sub
Chloe Estates
Chloe's Estates
Chobee Place
Cholul
Chris Mar Manor
Christian Villas 1
Christiana Acres
Christiana Borough
Christiana Village
Christianstead
Christie Estates
Christie Lawns Rev
Christina At The Hammocks
Christina Estates
Christina Landing
Christina's World Ii
Christman Lake Villa
Christmas Pines Replat
Christopher
Christopher At Cedar Lakes
Christopher Court
Christopher House Condo Apts
Christopher Plaza Condo
Christopher Woods
Christy Acres
Christy Place Villas &
Christys Estates
Christys Place Villas
Chukker Cove P B Polo & Cntry Club Well
Chula Vista
Chula Vista 1st Add
Chula Vista 3rd Add
Chula Vista First Add Rev
Church Creek
Church Creek Waterfront
Church Hill
Church Hill Estates
Church Hill Farms
Church Hill Hunt
Church Hill Manor
Churchill Condo
Churchill Court
Churchill Downs Resub
Churchill Downs Sub
Churchill Estates
Churchill Square
Churchill Town
Churchill Town Sector
Churchill View
Churchtown
Churn Creek
Cicely Estates Sec 1
Cider Knoll
Cielo On The Bay Condo
Cimarron Sec One
Cimarron Woods
Cimarrone Golf And Country Club
Cinderberry Estates
Cinema Park Country Club
Cinnamin Crossing
Cinnamin Hill
Cinnaminson Harbour
Cinnamon Creek
Cinnamon Hill
Cinnamon Place 1
Cinnamon Place 1 121-26 B
Cinnamon Place Ii
Cinnamon Place Iv
Cinnamon Ridge
Cinnamon Ridge Condo
Cinnamon Tree
Cinnamon Woods
Cinquez Park
Cinquez Park 2nd Add
Cipriano Springs
Circ Residences Condo
Circle Bay Yacht & Sailing Club
Circle Bay Yacht Club Condo
Circle Bay Yacht Club Condo 01-03
Circle Condominiums
Circle Park At Rock Hall
Circle S Estates
Citation Meadows
Citation Way Condo
Cite Condo
Citra Estates
Citrus Heights
Citrus Hideaway
Citrus Hidwy/Whitflds M&B
Citrus Isle Pud
Citrus Isles
Citrus Park
Citrus Park Pl
Citrus Spgs Unit 04
Citrus Spgs Unit 05
Citrus Spgs Unit 10
Citrus Spgs Unit 20
Citrus Spgs Unit 23
Citrus Spring
Citrus Springs
Citrus Springs Unit 01
Citrus Springs Unit 02
Citrus Springs Unit 03
Citrus Springs Unit 04
Citrus Springs Unit 05
Citrus Springs Unit 06
Citrus Springs Unit 08
Citrus Springs Unit 09
Citrus Springs Unit 10
Citrus Springs Unit 11
Citrus Springs Unit 12
Citrus Springs Unit 13
Citrus Springs Unit 16
Citrus Springs Unit 17
Citrus Springs Unit 19
Citrus Springs Unit 20
Citrus Springs Unit 21
Citrus Springs Unit 22
Citrus Springs Unit 23
Citrus Springs Unit 25
Citrus Springs Unit 26
Citrus Springs Unit 27
Citrus Trail
Citt Life Residence
City
City 24 Condo
City Boom
City Line Park Amd
City Of Atlantis
City Of Cambridge
City Of Cape Coral
City Of Charles Town
City Of Fairfax
City Of Fdna Beach
City Of Fredericksburg
City Of Hagerstown
City Of Lambertville
City Of Lancaster
City Of Lauderhill Sec 1
City Of Lauderhill Sec On
City Of Lauderhill Sec Th
City Of Lauderhill Sec Three
City Of Lebanon
City Of Martinsburg
City Of Miami South
City Of North Port
City Of Okeechobee
City Of Ranson
City Of Salem Condo
City Of Vineland
City Of Wildwood
City Of Winchester
City Palms
City Palms Condo
City Park
City Park Homes
City Square
City View
City View By The Grove Co
City View Gardens
City View Townhomes
City Vista
City Walk At Pineapple Grove Condo
City Ward 1
City Ward 6
Cityplace South Tower
Cityplace South Tower Condo
Cityside Condo
Ciudad De Choluteca
Ciudad Las Canas
Ciudad Las Palmas
Claggett Landing
Claggetts Mill
Claiborne
Claiborne Fields
Clair Lake
Clairborne
Clairmont Condominium
Clairmont Condominium F
Clairmont Condominium G
Clairmont Condominium I
Clairmont Condominium J
Clairmont Condominium K
Clairmont Condominium L
Clairmont Manor
Claremont
Claremont Place Condo
Claremont-Freedom
Clarendon
Clarendon 1021
Clarendon Condo
Claridge Condo
Claridges Condo
Claridges I Condo
Claridges Ii Condo
Clark & Irvings
Clark Heights
Clark Lakes Sub
Clark's Rest
Clark's Rest Phase 1
Clark's Rest Phase 2
Clarke County
Clarks Crossing
Clarks Glen
Clarks Run
Clarksburg Heights
Clarksburg Outside
Clarksburg Ridge
Clarksburg Square
Clarksburg Town Center
Clarksburg Village
Clary
Clary's Forest
Clarys Forest
Clasca Estates
Classic Lakes
Classic Ridge On The Occ
Classic Shores
Classic Shores Addition
Classic Towne Houses West
Classic Towne Houses West Condo
Clay Township
Claymont Addition
Claymont Heights
Clays Orchard Tr Add
Clayton
Clayton Heights
Cle11 Central Lake Estates
Cle41 Central Lake Estates
Cle43 Central Lake Estates
Cle6 Central Lake Estates
Cle79 Central Lake Estates
Clear Brook
Clear Lake Club Condo
Clear Lake Palms Condo
Clear Lake Palms Condominium
Clear Spring
Clear View Terrace
Clear Water
Clearbrook
Clearbrook Acres
Clearbrook Adult
Clearbrooke Estates
Clearfield
Clearfield Borough
Clearview
Clearview Ests
Clearview Gardens
Clearview Heights
Clearview Manor
Clearview Meadow
Clearview Towers Condo
Clearview Village
Clearview-Foxwood
Clearview/Chatham Hgts
Clearville Area
Clearwater
Clearwater Beach
Clearwater Park
Clearwater Village
Clearwood
Cleland Heights
Clemens Crossing
Clementon Lake
Clementsville
Cleona Borough
Clermont
Cleveland
Cleveland Grove Acres
Cleveland House
Cleveland Mannor
Cleveland Manor
Cleveland Park
Cleveland Park North
Cleveland Terrace
Clevenger Corner Village
Cleversburg
Clewiston Railroad Tracts
Clewiston Ridgeview Estate
Cleydael
Clh9 Compass Lake Hills
Click Unrec Sub
Cliff Gardens
Cliff House
Cliff Lake Villas
Cliff Lake Villas Co-Op
Cliff's Mill On Carter's Run
Cliffside Manor
Cliffton
Cliffton On The Potomac
Cliffvale
Cliffwood
Clifton
Clifton Commons
Clifton Condo
Clifton Crest
Clifton Heights
Clifton Knolls
Clifton Mill
Clifton Park
Clifton Square
Clifton View
Clifton Woods
Clinton
Clinton Condo
Clinton Dale Estates
Clinton Estates
Clinton Grove Ests
Clinton Twp
Clinton View - Plat One
Clinton View 03
Clinton Woods
Clipper Condo No 1
Clipper Mill
Cliveden Jupiter Island
Clocktower Woods
Cloister Beach Towers
Cloister Beach Towers Con
Cloister Beach Towers Condo
Cloister Del Mar Condo
Cloister Pointe Condo
Cloisters
Cloisters At Lake Worth
Cloisters On The Bay Cond
Clopper Hills
Cloppers Mill West
Cloud Lake
Cloutier Court
Clover
Clover Gardens Condo
Clover Hill
Clover Hill Iii
Clover Lea
Clover Leaf Lakes
Clover Leaf Lks
Clover Lee
Clover Mill
Clover Ridge
Clover Sub
Clover Sub 1st Addn
Cloverdale
Cloverdale Heights
Cloverfield Farms
Cloverfields
Cloverhill
Cloverland Farms
Cloverlea
Cloverleaf Center
Cloverleaf Townhomes
Cloverton
Clows
Clows Add
Clows Addition In The Northwest Neighborhood
Club At Mcdonogh
Club At Patriots Glen
Club Atlantis Condo
Club Caribe
Club Caribe Condo
Club Cottages At Pga National
Club Estates
Club Hill
Club Manor
Club Nautico Poseidon - Zona Sol Del Mar - Pucusan
Club Ocean Villas I
Club Ocean Villas Ii
Club Of Bay Harbor Condo
Club Quarters At Raintree
Club Residences At Park G
Club Residences At Park Gr
Club Residences At Park Grove Condo
Club Road Estates
Club Royale
Club Royale Condo
Club Tower Three Condo
Club Tower Two Condo
Club View At Indian
Clubhouse Court Condo
Clubhouse Manor
Clubside
Clusters
Clusters At Driftwood
Clusters At Woodlawn
Clusters Of Lexton
Clyatt's Subdivision
Clyburn
Clyde Killer's Addition
Clydesdale Acres
Cntry Club Of Pocono
Co Sfwmd
Coach Homes Lll
Coach Homes Of Banyan Springs Condo
Coach House
Coach House East & West Condo
Coach Houses Of Town Place
Coach Houses Of Town Place Condo
Coach Houses Of Town Place Ii Condo
Coachford
Coachman's Path
Coal Township
Coaldale
Coan Harbor Estates
Coan Harbour Estates
Coastal Bay Colony
Coastal Club
Coastal Coves Unit 1
Coastal Garden Condo
Coastal House
Coastal House Condo
Coastal Key
Coastal Shores West
Coastal Terrace Condo
Coastal Towers Condo
Coastal Vii Apartments In
Coastal Vii Apartments Inc Co-Op
Coastal Villages
Coastal Vista Condo
Coastal Waterways Co-Op
Coastal Winds South Co-Op
Coatesville
Coatesville Boro
Cobalt Ridge
Cobb Island
Cobb's Park Replat
Cobbdale
Cobble Creek Estates
Cobble Creek Manor
Cobble Creek Manor Ii
Cobblers Cove
Cobblers Village
Cobblestone
Cobblestone Condo
Cobblestone Country Club
Cobblestone Creek
Cobblestone Creek - Countryside Meadows
Cobblestone Farms
Cobblestone Ii
Cobblestone Pud 01
Cobblestone Pud 05
Cobblestone Pud Plat No 1
Cobblestone Square
Cobblestones
Cobbs Creek
Coblentz Heights
Cobos Fronton Sub 1
Cobos Fronton Sub 2
Cocalico
Cochrans Landing
Cochranville Mhp
Cockeysville
Cockeysville/Hunt Valley
Cocle Republic Of Panama
Coco Cay Condo
Coco Grove
Coco Gve Pk 2 Amd
Coco Palm Estates
Coco Palm Villas
Coco Parc Condo
Coco Plum Beach
Coco Plum Beach Replat
Coco Plum Beach Yacht Club
Coco Wood Condo
Coco Wood Lakes
Coco Wood Lakes Sec 01
Coco Wood Lakes Sec 1
Coco Wood Lakes Sec 2
Coco Wood Lakes Sec 3
Cocoa Beach
Cocoa Pine Estates
Cocoa Plum Heights Sub
Cocobay
Coconut Cay
Coconut Cove Marina
Coconut Creek 11th Sec
Coconut Gr Sec 1 C Gab
Coconut Grove Manor
Coconut Grove Pk 2nd Amd
Coconut Grove Residences
Coconut Grove Residences On
Coconut Grove Sec 1-Coral
Coconut Key
Coconut Palm Condo
Coconut Palm Estates
Coconut Paradise Residence
Coconut Walk Of Lake Worth
Coconut Way
Cocoplum
Cocoplum - Hypoluxo Haverhill Pud 2
Cocoplum Sec 1
Cocoplum Sec 2 Plat B
Cocoplum Sec 2 Plat C
Cocoplum Sec 2 Plat D
Cocoplum Sec 2 Plat E
Cocoplum Sec 2 Plat F
Cocoplum Terr
Cocoplum Terr Addn
Cocoplum Terrace Addn Par
Cocotal
Cocotal Club
Cocotal Country Club & Gol
Cocotal Golf & Country Clu
Cocotal Golf And Country C
Cocowalk Estates
Coda
Coddington View
Codorus
Codorus Estates
Coffee Run
Cohansey Courts
Cohasset
Colchester Towne Condo
Cold Cabin Park
Cold Cheer Farm Estates
Cold Spring Development
Cold Spring Estates
Cold Spring Farm
Cold Spring Hunt
Cold Spring Newtown
Coldbrook
Coldbrook Meadows
Coldstream
Coldstream Homestead Montebello Historic District
Coldwater Crossing
Cole Add To Pompano
Cole Hammock
Colebrook Court
Colebrooke
Colecroft
Colecroft Station Condominium
Colee Cove Estates
Colee Hammock
Colerain Township
Coles Point
Coles Run Manor
Coleston
Colesville Estates
Colesville Farm Estates
Colesville Outside
Colesville Park
Coletown Acres
Colette Residences
Coleville
Colgate Park
Colinas De Arroyo Alto
Collection At Hopewell
College
College Arms Estates
College Gardens
College Heights
College Hill
College Hills
College Homesites
College Manor
College Park
College Park A
College Park Add 1
College Park Add 4
College Park Add 5
College Park Add 5 In
College Park Addn
College Park B
College Park Kidwells Ad
College Park Woods
College Station
College Tr 19-9 B
College Tract
College Tract 2nd Add
College Tract First Add
College View
College Woods
Collegehill
Collegeville Green
Collegiate Acres
Colleyville
Collier City
Collier City Add No 1
Collier Estates 1st Add
Collier Estates 3rd Add
Collier Estates 4th Add
Collier Estates Fifth Add
Collier Groves
Collier Manor
Collier Manor 2nd Add
Collier Manor 3rd Add
Collier Manor 4th Add
Collier Manor 4th Add 38-
Collier Manor First Add
Collier Pud
Collingdale
Collings Lake
Collingswood
Collingswood Heights
Collington Station
Collingwood Estates
Collingwood Manor
Collingwood Springs
Collins Acres
Collins And Russell
Collins Estates 1st Addn
Collins Park
Collins Towers Condo
Collins Tract
Collins View Condo
Collins Vista Condo
Colmar Manor- 1st Addn
Colnon Sub
Colombia Boro
Colombia- Rionegro-Stregis
Colonia
Colonia Creole
Colonia Los Encinos
Colonial Acres
Colonial Annapolis Historic District
Colonial Beach
Colonial Club Condo Sec 1
Colonial Club Condo Sec 2
Colonial Condo
Colonial Court Condo Bldg
Colonial Crest
Colonial Crossings
Colonial Drive
Colonial East
Colonial East Mhp
Colonial Estates
Colonial Estates Ii
Colonial Estates Mobile Home Park
Colonial Forge
Colonial Forge At Augustine
Colonial Gardens Condo
Colonial Heights
Colonial Heritage
Colonial Hills
Colonial Homes
Colonial House Condo
Colonial Lakes
Colonial Lakes Villas
Colonial Manor
Colonial Manor East Apartments
Colonial Manor West Apart
Colonial Manor West Apartments
Colonial Meadows
Colonial Mews
Colonial Park
Colonial Pines
Colonial Plaza Condo
Colonial Ridge
Colonial Ridge Corp
Colonial Ridge Corp, Fairfax
Colonial Square
Colonial Terrace Unit 1
Colonial Vil
Colonial Village
Colonial Village Iii
Colonial Woods
Colonies At Mclean
Colonies Condo
Colonies Of Madrillon
Colonies Two Condo
Colonnade At Dadeland
Colonnade At Dadeland Se
Colonnade At Dadeland Se Condo
Colonnade At Dadeland Sw
Colonnade At Kentlands
Colonnade Pointe
Colonnades
Colonnades Condo
Colonnades Condominium
Colonnades Condominium No 8
Colonnades Condominium No 1
Colonnades Condominium No 11
Colonnades Condominium No 2
Colonnades Condominium No 4
Colonnades Condominium No 5
Colonnades Condominium No 7
Colony At Coral Springs
Colony At Stirling
Colony At Summit Bridge East
Colony At Summit Bridge West
Colony Bay Harbor Apts Co
Colony Condo
Colony Key Villas In Pb 29 Pgs 25 And 26
Colony Lake
Colony Palms
Colony Park
Colony Point
Colony Point 1 Condo
Colony Point 2 Condo
Colony Point 3 Condo
Colony Point 4 Condo
Colony Point 5 Condo
Colony Point 6 Condo
Colony Preserve Pud
Colony Reserve At Lake Worth
Colony Square
Colony Terrace Apts Co-Op
Colony Woods As
Colorama Estates
Coltons Point
Colts Neck Farm
Columbia
Columbia Beach
Columbia Borough
Columbia Commons
Columbia Condo
Columbia Forest
Columbia Heights
Columbia Highlands
Columbia Historic Distric
Columbia Knoll
Columbia Park
Columbia Park Corr Pl
Columbia Pike
Columbia Place
Columbia Run Townhomes
Columbia Towers
Columbia Town Center
Columbus Park
Colvard Manor
Colvilla
Colvin Glen
Colvin Run
Colwick
Colyer Lake
Comanche Sub
Comfort Gardens
Comfort Gardens 1st Addn
Comfort Villas 1st Addn
Comm Liberty City
Commercial Blvd
Commercial Highlands West
Comml Little River
Comml Shore Crest
Commodore Club East
Commodore Club South Cond
Commodore Club West Condo
Commodore Condo
Commodore Estates
Commodore Place
Commodore Plaza
Commodore Plaza Condo
Commodores Pocket
Common Element
Commons At Radish Farm
Commons At Stonest
Commons Of Arlington
Commons Of Delancey
Commons Of Middlet
Commonwealth Gardens
Commonwealth Manor
Commonwealth Park Sec 1
Commonwealth Place At Westfields
Communities Of Burwell
Community Of Lakeport (Dis
Community Of Lakeport (District 13)
Como Manor
Como Residences
Compass Lake
Compass Lake Hills
Compass Lake Hills Unit 2
Compass Lake In The Hills
Compass Lakes Hills
Compton Heights
Compton Valley Estates
Compton Village
Comrock
Comstock
Comune Di Perugia
Comunidad De Westwood 6
Con-Gia Mnr
Conashaugh Lakes
Concept Homes Of Lantana 1
Concept Homes Of Lantana 5
Concerned Citizens Of Forest Park
Concord Arms Co-Op
Concord Chase
Concord Crossing
Concord Estates
Concord Green
Concord Heights
Concord House Inc Condo
Concord Mews
Concord Ridge
Concord Trace
Concord Village
Concord Village Condomini
Concord Village Condominium I
Concord Village Condominium Iii
Concord Village Condominium Iv
Concord Village Condominium Ix
Concord Village Condominium Viii
Concordia
Concordia East
Concordia Ridge
Condado Real
Condado Real Condo
Condo 1 Of Sabal Palm Con
Condo 1 Of Whitehall Condos
Condo 10 Of Sabal Palm Condos
Condo 14 Of Whitehall Condos
Condo 15 Of Whitehall Con
Condo 19 Of Whitehall Con
Condo 19 Of Whitehall Condos
Condo 21 Of Whitehall Con
Condo 22 Of Whitehall Con
Condo 23 Of Whitehall Condos
Condo 27 Of Whitehall Condos
Condo 3 Of Sabal Palm Con
Condo 3 Of Whitehall Cond
Condo 4 Of Sabal Palm Con
Condo 8 Of Whitehall Cond
Condo 9 Of Sabal Palm Condos
Condo A At Mediterranea P
Condo At Gunston Corner
Condo B At Mediterranea P
Condo F At Mediterranea
Condo G At Mediterranea
Condominio Fundadores
Condominio La Molina
Condominio Las Cabaas
Condominio Mansoes
Condominio Siaan
Condominium 1 Of Environ
Condominium 1 Of Environ Ii
Condominium 11 Of Lighthouse
Condominium 17 Of Lighthouse
Condominium 2 Of Environ Ii
Condominium 3 Of Environ
Condominium 3 Of Lighthou
Condominium 5 Of Environ
Condominium 5 Of Environ Ii
Condominium 5 Of Lighthou
Condominium 6 Of Environ
Condominium 6 Of Environ Ii
Condominium 6- Environ Ii
Condominium 8 Of Environ
Condominium 8 Of Lighthou
Condominium 9 Of The Mari
Condominiums At Kirkpatr
Condos At Carlyle Square
Condos At The Ridge
Conestoga
Conestoga Hills
Conestoga Manor
Conewago
Conewago Creek
Conewago Crest Estates
Conewago Township
Conewago Twp
Conewago Valley School District
Confederate Hills
Confederate Ridge
Confederate Woods
Confer
Conference Lake
Conference Ridge
Congress Heights
Congressional
Congressional Country Club Estates
Congressional Villag
Conjunto Campestre Reserva
Conjunto Las Lomas Etapa 2
Conjunto Las Marias
Conjunto Llano Verde
Conjunto Manantial
Conn Ave Hills
Conn Ave Park
Connaughtown
Connecticut Avenue Estates
Connecticut Gardens
Connemara
Connemara Condo
Connemara Hills
Connemara Woods
Conners Gables
Conners Highlands
Connor Estates
Connors Gables Revised
Conococheague
Conodoguinet Mobile Estates
Conowingo Manor
Conquistador Condo
Conquistador Condo 09
Conquistador Estates
Conquistador Park Condo
Conquistador Villas Condo
Conrad Weiser
Conservatory
Conshohocken
Conshohocken Sta
Consolidated Land-Viking Area
Constant Branch
Constant Friendship
Constant Woods
Constitution Hills
Consulate Cond Decl Filed 5-9-80
Consulate Condo
Consulta Saldo
Contact County
Contempo Townhomes
Contempo West
Contemporary Vlg
Continental
Continental Homes At Lago
Continental Village Condo
Continuum 12000 Sport
Continuum Condo Ph Ii
Continuum On South Beach
Continuum On South Beach C
Continuum South
Contrary Creek
Contrary Forest
Contry Lakes Mobile Home
Convention Center
Conway Plat
Cooches Bridge Far
Cook Inlet
Cooke's Hope
Cooke's Hope Village
Cool Breeze Mobile Home Park
Cool Creek
Cool Hollow Estates
Cool Meadow Farms
Cool Spring
Cool Spring Heights
Cool Springs At Charlestown
Coolbaugh
Coolfont Mountainside
Coolridge Acres
Coolspring Farms
Cooper Colony Estates Sec
Cooper Colony Estates Sec 2
Cooper Comm/North Wales
Cooper Crossings
Cooper Estates Sec 1
Cooper Farm
Cooper Farms
Cooper Lake Estates
Cooper Lake Gardens
Cooper Lake Hills
Cooper Lake Terrace
Cooper Point
Cooper River Park
Cooper Village
Coopers Grove
Coopers Point
Coopers Sub
Coopers W L Rediv
Coopersburg
Coopersburg Boro
Coopertown
Coopertowne Village
Coover Heights
Copeland
Copes Landing
Coplay Boro
Copper Creek
Copper Creek Plat No 2
Copper Crossing South
Copper Mill Estates
Copper Mill Sta
Copper Ridge
Copperfield
Copperfield At Five Frm
Copperhead Phase 1
Copperleaf
Copperleaf Ridge
Coppermill
Coppermine Crossing
Coppin
Coppin Heights
Coppingers Tropical Garde
Copps C W Add To Boynton
Coquina / Polo Club
Coquina At Maple Ridge
Coquina Cove
Coquina Cove Villas
Coquina Lakes
Coquina Maple Ridge Ph 3
Cora-Win Cove Mh Co-Op Park
Coral Bay Club Condo
Coral Bay Manor
Coral Bay Parcel
Coral Bay Parcel 'F'
Coral Bay Parcel G
Coral Bay Parcel H
Coral Bay Parcels G & H
Coral Bay Replat Section
Coral Bay Replat Section One
Coral Bay Sec B
Coral Bay Sec C
Coral Bay Sec D
Coral Breeze
Coral Brook
Coral Brook 37-18 B
Coral Cay
Coral Cay Plantation
Coral Club Garden Villas
Coral Cove
Coral Cove Beach Sec 1
Coral Cove Beach Section 1
Coral Cove Condo
Coral Creek
Coral Creek Rep 2
Coral Edge
Coral Est
Coral Estates
Coral Gable Country Club
Coral Gables Biltmore Sec
Coral Gables Bisc Bay
Coral Gables Bisc Bay Sec
Coral Gables Country Club
Coral Gables Country Club Sec 3
Coral Gables Crafts Sec
Coral Gables Douglas Sec
Coral Gables Flagler St S
Coral Gables Flagler Stre
Coral Gables Granada Sec
Coral Gables Granada Sec Rev
Coral Gables Ind Sec
Coral Gables Riv Sec 6
Coral Gables Riviera Sec
Coral Gables Sec A
Coral Gables Sec B
Coral Gables Sec C
Coral Gables Sec E
Coral Gables Sec K
Coral Gables Sec L
Coral Gardens
Coral Gardens 01
Coral Gardens 02
Coral Gardens Condo
Coral Gardens Condo Bldg
Coral Gate East Condo
Coral Gate I Condo
Coral Gate Ii Condo
Coral Gate Iii Condo
Coral Gate Iv Condo
Coral Gate Sec A
Coral Gate Sec B
Coral Gate Section Two
Coral Gate V Condo
Coral Gate Vii Condo
Coral Gate West Condo
Coral Gate X Condo
Coral Gate Xi Condo
Coral Glade Heights
Coral Groves
Coral Haven Sec Two
Coral Heights Sec 2
Coral Heights Sec 3
Coral Heights Sec One
Coral Heights Sec One 40-
Coral Highlands
Coral Hills
Coral Isle East Condo
Coral Isle West Condo
Coral Isles
Coral Isles 15-60 B
Coral Isles 15-68 B
Coral Isles At Avenir
Coral Key
Coral Key Condo
Coral Key Villas
Coral Key Villas 1st Sec
Coral Key Villas 2nd Sec
Coral Key Villas 3rd Sec
Coral Key Villas 5th Sec
Coral Key Villas 6th Sec
Coral Key Villas 8th Sec
Coral Lago
Coral Lakes
Coral Lakes - Royal Landings
Coral Lakes / Crystal Pointe
Coral Lakes 12
Coral Lakes 2
Coral Lakes 2/Regency Cove
Coral Lakes Iv
Coral Lakes Kingdom
Coral Lakes/Regal Shores North
Coral Landings
Coral Manor
Coral Manor Fourth Add
Coral Manor Third Add
Coral Nook
Coral Park Add
Coral Park Estates Sec 1
Coral Park Estates Sec 4
Coral Pine Condo 1
Coral Pines Villas Condo
Coral Pl Rev
Coral Plaza Condo
Coral Plaza Of Miami Cond
Coral Point
Coral Point 31-27 B
Coral Point Condominium
Coral Point North
Coral Pointe Condo
Coral Pointe Townhomes Co
Coral Reef Club
Coral Reef Estates
Coral Reef Estates 2nd Ad
Coral Reef Nurseries Sec
Coral Ridge
Coral Ridge Add
Coral Ridge Colony Inc Condo
Coral Ridge Country Club
Coral Ridge Country Club Add
Coral Ridge East Condo
Coral Ridge Galt Add
Coral Ridge Galt Add 1
Coral Ridge Galt Add 27-4
Coral Ridge Galt Add No 1
Coral Ridge Galt Add No 2
Coral Ridge Galt Add No 3
Coral Ridge Isles
Coral Ridge Isles 45-47 B
Coral Ridge Landings Ii C
Coral Ridge Landings Ii Condo
Coral Ridge North
Coral Ridge North 28-37 B
Coral Ridge North Add
Coral Ridge North Add 24-
Coral Ridge Towers Co-Op
Coral Ridge Towers East
Coral Ridge Towers East Co-Op
Coral Ridge Towers North
Coral Ridge Towers North Co-Op
Coral Ridge Towers South
Coral Ridge Towers South Co-Op
Coral Run Condo
Coral Sands
Coral Sea View Condo
Coral Shores
Coral Shores Amend Plat
Coral Spring Gardens East
Coral Springs Country Clu
Coral Springs Country Club
Coral Springs Country Club West
Coral Springs Estate
Coral Springs Estate Town
Coral Springs Estate Townhomes
Coral Springs Ii
Coral Springs Lakes
Coral Springs Sub No 1
Coral Springs Tower Club
Coral Springs Tower Club Ii
Coral Springs Townhomes Condo
Coral Springs University
Coral Springs Village Gre
Coral Terr Sec No 2
Coral Terrace
Coral Towers Condo
Coral Trace
Coral Villa Rev
Coral Village Condo
Coral Villas
Coral Villas Rev
Coral Way Estates
Coral Way Gardens Condo
Coral Way Heights
Coral Way Hgts
Coral Way Homesites
Coral Way Park Sec B
Coral Way Pk Sec D
Coral Way Sec C
Coral Way Towers Condo
Coral Way Village Sec A P
Coral West Condo
Coral West Heights
Coral Woods
Corbin Hall
Cordoba Condo
Cordova
Cordova Estates At Mission Bay
Corinthian
Corinthian Condo
Corinthian Condo Apts Mar
Corinthian Condo Apts Marina
Corinthian Condominium Apts Lt 2 Marina Add To Vil
Corinthian Gardens
Corinthian Gardens Inc Condo
Corinthian On The Intraco
Corinthian On The Intracoastal
Corinthians Condo
Cornell Heights
Corner Ketch Farm
Corner View Townhomes At
Cornerstone
Cornerstone Jupiter
Corniche Condo
Cornwall
Cornwall At Century Villa
Cornwall At Century Village Condo
Cornwall Borough
Cornwall Hills
Cornwall Junction
Cornwall Lebanon
Cornwall-Lebanon
Cornwell
Cornwell Hgts
Coroa Do Meio
Corona Bay Townhouses Con
Corona Beach, San Carlos
Corona Del Mar
Corona Del Rio
Coronado
Coronado At Doral I Condo
Coronado At Doral Ii Cond
Coronado At Doral Iii Con
Coronado At Highland Beac
Coronado At Highland Beach Condo
Coronado Condo - Tower Ii
Coronado Condo Tower I
Coronado Condo Tower Ii
Coronado Condo Tower Iii
Coronado Condo- Tower 1
Coronado Condo- Tower I
Coronado Condo- Tower Ii
Coronado Condo- Tower Iii
Coronado Condo-Tower Ii
Coronado Condominiums
Coronado Estates
Coronado Harbor
Coronado Harbor 2nd Addn
Coronado Heights Sec Two
Coronado Ii
Coronado To Doral Vi Cond
Coronado Tower Iii
Coronado/Highland Beach
Coronet Chateau Condomini
Coronet Estates Condomini
Coronet Manor Apts Condo
Coronet Park
Coronet Plaza Condo
Corporation Of Shepherdstown
Corr Juan Diaz Anton Repub
Corregimiento Juan Diaz
Corregimiento San Francisc
Corriganville
Corrotman By The Bay
Corsica
Corsica Landing Estates
Corsica Place
Corsica Silver Palm
Cortez Estates Unit 1
Cortland Manor
Cortland Park At Winding Hills
Cortland Villas
Cory Lake Isles
Cosabella On The Bay
Cossios Sub No 1
Costa Bella Condo
Costa Blanca Villas
Costa Brava
Costa Brava Condo
Costa Crest Condo
Costa Del Rey Condo
Costa Del Sol
Costa Del Sol Condo A
Costa Del Sol Condo C
Costa Del Sol Condo F
Costa Del Sol Condo M
Costa Del Sol Condo No 1
Costa Del Sol Condo No 3
Costa Del Sol Condo O
Costa Del Sol Condo V
Costa Hermosa
Costa Hollywood
Costa Hollywood Condo
Costa Linda Condo
Costa Pointe
Costa Rica
Costa Rica En Orotina
Costa Verde Sec 1
Costa Verde, Casa De Campo, Dominican Republic
Costain Villas Harbor Vil
Costain Villas Harbor Vilg Condo
Costner's
Cote D Azur
Cote D Azur Condo
Cottage City
Cottage Dale Acres
Cottage Green
Cottage Grove
Cottage Hill
Cottage Hill West
Cottages At Oyster Bayou
Cottages At The Lake
Cottondale
Couchman's Development
Coulbourn Manor
Coulbourne Manor
Coulbourne Mill Village
Counterpoint Estates 1
Counterpoint Estates 10
Counterpoint Estates 3
Country & Town Homes
Country Ac. Golden
Country Acres
Country Acres Family Park
Country Acres Gold
Country Address Encore
Country Aire
Country As
Country Club
Country Club Acres
Country Club Acres 3
Country Club Acres 4
Country Club Acres 5
Country Club Add To The Village Of North Palm Beac
Country Club Add To Village Of North Palm Beach
Country Club Addition To The Village Of Npb
Country Club Addition To Village Of Npb
Country Club Addn
Country Club Apts At
Country Club Apts At Bonaventure 32
Country Club Estat
Country Club Estates
Country Club Estates Parcel 8 Phase 1
Country Club Estates Parcel 8 Phase 2
Country Club Estates Rainb
Country Club Estates Sec
Country Club Estates Unit
Country Club Estates-Phase 2
Country Club Ests
Country Club Ests Of Home
Country Club Grove Pt 1
Country Club Heights
Country Club Heights First
Country Club Hills
Country Club Homes
Country Club Isles
Country Club Lake
Country Club Manor
Country Club Manor Condo
Country Club Of Miami
Country Club Of Miami Est
Country Club Of Miami Fai
Country Club Of Mount Dora Ph Ii-7
Country Club Of The Poconos
Country Club Park
Country Club Point
Country Club Pointe
Country Club Pointe Unit
Country Club Ranches
Country Club Ranches Sec
Country Club Ranches Sec 3
Country Club Tower Of Cor
Country Club Tower Of Coral
Country Club Towers
Country Club Towers Cond
Country Club Towers Condo
Country Club Valley
Country Club View
Country Club Village
Country Club Village Sec
Country Club Village Sec A
Country Club Village Sec B
Country Club Village-French Quarter
Country Club/Lake Montclair
Country Cove
Country Cove Estates
Country Creek
Country Creek West
Country Crossing
Country Estates
Country Farms
Country Fields
Country Gardens Co-Op
Country Gardens Condo
Country Gardens Ii Condo
Country Gardens South
Country Gate
Country Glen
Country Green
Country Greens At Westchester
Country Greens/Southpointe
Country Hills Estates
Country Hunt
Country Isles
Country Isles Cove
Country Isles Executive
Country Isles Patio Homes
Country Isles Phase Ii
Country Knolls
Country Lake
Country Lake Homes 1st Addn
Country Lake Homes 2nd Ad
Country Lake Manors
Country Lake Manors Sec 1
Country Lake Manors Sec 2
Country Lake Manors Sec 3
Country Lake Park
Country Lake Park 1st Add
Country Lakes
Country Lakes I Condo Phas
Country Lakes Village
Country Landing Sec 1
Country Lane
Country Lane Estates
Country Life Acres
Country Manor
Country Manor Co-Op
Country Manor Farms
Country Manor West
Country Manors
Country Manors Condo
Country Meadows
Country Mill
Country Oaks
Country Park At Boca Rato
Country Place
Country Ridge
Country Sec 2
Country Setting
Country Square
Country Squire Townhomes
Country Squire Townhomes Condo 9
Country Squires
Country Tree Sub
Country View Estates
Country Village (3)
Country Village Condo
Country Walk
Country Walk Sec 1
Country Walk Sec 2
Country Walk Sec 3
Country Walk Sec 4
Country Walk Sec 5
Country Walk Sec 5 Replt
Country Walk Townhouses S
Country Walk West Sec 1
Country Western Store
Country Wood Estates
Country Woods
Countrys Point
Countryside
Countryside @ University
Countryside At Vero Beach
Countryside Condo
Countryside Court North
Countryside Estates
Countryside Farms
Countryside Farms Of Ocala
Countryside Lakes
Countryside Meadows
Countryside Mhp
Countryside On Lake Anna
Countryside Townhomes 3
Countryside Village Condo
Countryside West
Countrywood
Countrywood 3
Countrywood 5
County Center
County Creek
County Green
County Squire Estates
County Squire Estates Sec
County Squire Estates Sec B
County View
Courseys Point
Court At The Ledges
Court Of Delray Condo
Courtbridge
Courtbridge Ii
Courthaven
Courthouse
Courthouse Crossings
Courthouse Hill
Courthouse Manor
Courthouse Station
Courthouse Walk
Courthouse Woods
Courtland
Courtland Manor
Courtland Park
Courtland Rural Village
Courtlands At Cascades
Courtleigh
Courtney Hollow
Courtney Manor
Courtney Terrace Sub
Courts At Brynwood
Courts At Oakland Park
Courts At Piney Orchard
Courts At Stafford
Courts At Stone Mill
Courts At Tuscany
Courts At Tuscany West
Courts At Wescott Ridge
Courts At Woolwich
Courts Brickell Key Condo
Courts Of Ashburn
Courts Of Chandon
Courts Of Chandon Town H
Courts Of Clarksburg
Courts Of Inverrary
Courts Of Park Ridge
Courts Of Pinehurst
Courts Of St Francis
Courts Of Tysons
Courts Of Whetstone
Courtyard Condo
Courtyard Condominiums
Courtyards At Cimarron Co
Courtyards At Davie
Courtyards At Davie Condo
Courtyards At Falls Gate
Courtyards At Kendall Con
Courtyards At Waverly Woods East
Courtyards In Cityplace Condo
Courtyards In Cityplace Condominium
Courtyards Of Broward
Courtyards Of Broward Con
Courtyards Of Broward Cond
Courtyards Of Broward Condo
Courtyards Of Carlisle
Courtyards Of Hialeah
Courtyards Of Lake Worth
Courtyards Of The Grove C
Courtyards Of Waterford
Courtyards One Condo
Courtyards Two Condo
Courvoisier Courts Condo
Cove 2nd Sec
Cove 3rd Sec
Cove 4th Sec
Cove 5th Sec
Cove At Briar Bay Condo
Cove At Falcon Trace Pd Plat 2
Cove At French Villas
Cove At Park Trace
Cove At Sandy Landing
Cove At Six Mile Cypress
Cove At Storey Lake 5
Cove At Waterway Village Pd
Cove Beach Club Co-Op
Cove Condo
Cove Condo Phase I
Cove Condo Phase Ii, The
Cove Creek Club
Cove Gap
Cove Gardens Condo
Cove Harbor
Cove Homesites
Cove Lake
Cove Miami
Cove On Herring Creek
Cove Point
Cove Point Farm
Cove Point Woods
Cove Royale
Cove Royale Pud Phase 1
Cove Royale Pud Phase 2
Cove View
Cove Village
Cove Village Condo
Covenant Cove
Covenant Villas
Coventry
Coventry At Westminster
Coventry Chase
Coventry Condo
Coventry Farms
Coventry Glen
Coventry Green
Coventry Green At Wellington
Coventry House
Coventry In The Grove
Coventry Meadows
Coventry Mews
Coventry Place
Covered Bridge
Covered Bridge Area
Covered Bridge Cond 1-9 Decl In Or1913p983
Covered Bridge Condo
Covered Bridge Cro
Covered Bridge Est
Covered Bridge Estates
Covered Bridge Farms
Covered Bridge Trails
Coves At Isle Of Wight
Coves At Parkwalk Condo
Covina At Bay Park
Covington
Covington Chase
Covington Condominiums
Covington Cove
Covington Lakes Est
Cowan Crossing
Cowdray Park Condo
Cowenton
Cox Creek Landing
Cps
Cpv
Crabtree Hollow
Cradock Estates
Cragmere At Bellevue
Craig Addition
Crain Summit
Crains Sub
Crains Subd
Cramer Hill
Cramers Ridge
Cranberry Creek
Cranberry Hill
Cranberry Ridge
Cranberry Run
Cranbrook Acres
Cranbrook Lake Estates
Cranbury Brook
Cranbury Estates
Cranbury Manor
Crandon
Crane Creek
Crane Creek Racquet Club
Crane Creek Unit 1
Crane Crest Apts Co-Op
Crane Island Phase 2a
Crane Landing
Crane Pointe At Sawgrass Lakes
Cranes Creek Harbor
Cranesnest Park
Cranford
Cranston Terrace
Crapo
Cravatts Allapattah Homes
Cravero Cloverleaf Estate
Cravero Cloverleaf Ests R
Cravero Lake Shore Est 2nd Addn
Cravero Lake Shore Estate
Crawford Farm
Crawford Subdivision
Crawfords Addition
Crawfords Knoll
Cream Ridge
Creek Club # 3 Condo
Creek Haven
Creek Park Est-Replat
Creek Point
Creek Terrace
Creek Valley
Creek View
Creek View 55+ Community
Creeks Bend
Creekside
Creekside - Heron Bay
Creekside At Osprey Landing
Creekside Commons
Creekside East
Creekside Estates
Creekside Park
Creekside Plat No 1
Creekside Plat No. 4
Creekside Plat No. 6
Creekside Village
Creekside Village At Tanyard Springs
Creekstone Village
Creekvale
Creekview
Creekview Heights
Creekwood
Creighton Farms
Cresaptown
Crescent
Crescent 515 Assoc Inc Co
Crescent Cove
Crescent Cove Condo
Crescent Heights
Crescent Hills Estates
Crescent Hollow
Crescent Lake
Crescent Manor Condo Inc
Crescent Oaks
Crescent Orchards
Crescent Place
Crescent Plaza
Crescent Ridge
Crescent Ridge Phase Iv
Crescentville
Crespi Residence
Crespo Estates
Cressen Run
Cressona
Cresswind
Cresswind Palm Beach
Cresswind Palm Beach Phase 3
Crest Condo
Crest Of Alexandria
Crest Of Wickford
Crest Valley
Crest View Acres
Crestaven No 8
Crestfield
Cresthaven
Cresthaven / Pine Ridge / Kings Point
Cresthaven 7 43-10 B
Cresthaven 8 44-8 B
Cresthaven Cond Townhomes Sec 1
Cresthaven Condo
Cresthaven Condo Townhome
Cresthaven Condo Townhomes Sec 1
Cresthaven Condo Townhomes Sec 2
Cresthaven Condo Townhomes Sec 3
Cresthaven No 10
Cresthaven No 11
Cresthaven No 2
Cresthaven No 3
Cresthaven No 4
Cresthaven No 5
Cresthaven No 6
Cresthaven No 7
Cresthaven No 8
Cresthaven No 9 Replat
Cresthaven Townhomes Sec 4 Condo
Cresthaven Townhomes Sec 5 Condo
Cresthaven Villas
Cresthaven Villas 1 Condo
Cresthaven Villas 10 Cond
Cresthaven Villas 10 Condo
Cresthaven Villas 14 Cond
Cresthaven Villas 14 Condo
Cresthaven Villas 15 Condo
Cresthaven Villas 16 Condo
Cresthaven Villas 17 Condo
Cresthaven Villas 2 Condo
Cresthaven Villas 28 Condo
Cresthaven Villas 29 Condo
Cresthaven Villas 3 Condo
Cresthaven Villas 30 Cond
Cresthaven Villas 30 Condo
Cresthaven Villas 4 Condo
Cresthaven Villas 6 Condo
Cresthaven Villas 7 Condo
Cresthaven Villas Condo 18
Cresthaven Villas Condo 19
Cresthaven Villas Condo 2
Cresthaven Villas Condo 20
Cresthaven Villas Condo 21
Cresthaven Villas Condo 22
Cresthaven Villas Condo 23
Cresthaven Villas Condo 24
Cresthaven Villas Condo 25
Cresthaven Villas Condo 26
Cresthaven Villas Condo 27
Cresthaven Villas Condo 31
Cresthaven Villas Condo 32
Cresthaven Villas Condo 34
Cresthaven Villas Condo 35
Cresthaven Villas No 17 Cond Decl In
Cresthaven Villas No 2 Decl In
Crestmont
Crestmont Farms
Crestridge Heights
Crestview
Crestview Acres
Crestview Acres Mhp
Crestview Lakes
Crestview Manor
Crestview Towers Condo
Crestview West
Crestwood
Crestwood Acres
Crestwood At Carolina Condo
Crestwood Condo
Crestwood Delray
Crestwood Hamlet
Crestwood Heights
Crestwood Manor
Crestwood North
Crestwood North Replat Two
Crestwood Prof Center
Crestwood Sub Unit 2
Crestwood Unit 1 Pl 1
Crestwood Unit 1 Pl 4
Crestwood Unit 1 Pl 5
Crestwood Unit 3 Pl 2
Crestwood Unit 3 Pl 3
Crestwood Village
Crestwood Village - 1 Co - Op
Crestwood Village - 4 Co - Op
Crestwood Village - 5
Crestwood Village - 6
Crestwood Village - 7 Whiting Village
Crestwood Village 7
Cricket Club
Cricket Club Condo
Cricket Clubhouse Condo
Cricklewood
Crisfield Crossing
Crisifield
Crispin Gardens
Cristal Shores Condo
Cristelle A Condominium
Cristelle Cay
Cristelle Cay Condominium
Cristina Estates
Cristys Homes
Criterion Condo
Crofton
Crofton Chase
Crofton Commons
Crofton Farms
Crofton Highlands
Crofton Meadows
Crofton Mews
Crofton Mews Condo
Crofton Park
Crofton Square
Crofton Towne
Crofton Valley
Crofton Village
Croissant Park
Croissant Park - Lauderdale 2-9d
Croissant Park River
Croissant Park River Sec
Croissant Park South Rive
Croissant Park South River Sec
Cromwell
Cromwell East
Cromwell East Condo
Cromwell Fountain
Cromwell Heights
Cromwell Manor
Cromwell Station
Cromwell Valley
Cromwell West Condo
Cromwood
Crooked Creek
Crooked Crossing
Crooked Hill Farms
Crooked Run
Crosby Court
Crosby Lake Shores
Crosby Miami World Center
Crosby Miami Worldcenter
Crosby Sub
Crosby Woods
Crosel Heights
Crosfield Addition
Cross Briar I Condo
Cross Country
Cross Creek
Cross Creek Club
Cross Creek Condo
Cross Creek Estates
Cross Creek Ii
Cross Creek Lake Estates
Cross Creek Lake Estates Plat Two
Cross Creek Townhomes Pla
Cross Creek Village
Cross Fox
Cross Fox Condo
Cross Keys
Cross Point
Cross Roads Hill
Crossgates
Crossing At Bailey S
Crossings
Crossings @ Grovers
Crossings At Chris
Crossings At Conway
Crossings No 2
Crossings Of Boynton Beac
Crossings Of Boynton Beach Condo
Crossings Of Westlake
Crossings On The Potomac
Crossings Patio Homes Sec
Crossings Sec 1 The
Crossings Sec 3 The
Crossings Sec 6 The
Crossings Townhouses Sec
Crossings Vilg Homes Condo
Crossings Village Homes C
Crossland At Canal
Crossland Farms
Crosspointe
Crossroads
Crossroads Condo
Crossroads Farm
Crossroads Manor
Crossroads Park Of Commer
Crossroads Village
Crosstown Commons
Crosstown Parkway
Crosswicks
Crosswinds
Crosswinds At Jonathans Landing
Crosswinds At River Bridge Condo
Croton Harbor
Croton Harbor Condo
Croton Park
Crown
Crown Estates
Crown Farm
Crown Grant
Crown Pointe
Crownleigh
Crownsville
Croydon
Croydon Acres
Croydon Park
Crum Creek Valley
Crumpton
Crystal Bay
Crystal Bay Club
Crystal Bay Club Condo
Crystal Bay Phase Two
Crystal Beach Manor
Crystal Bluff Addn To Sil
Crystal Brook
Crystal City
Crystal Condo
Crystal Court Manor No 15
Crystal Court Manor No 5 Condo
Crystal Court Manor No 6
Crystal Court Manor No 9
Crystal Court No 1 Co-Op
Crystal Court No 4 Condominium
Crystal Falls
Crystal Falls Of Vero
Crystal Gateway
Crystal Greens Condo
Crystal Grove Estates
Crystal Heights
Crystal Hill
Crystal Hill Townhouses
Crystal House
Crystal House Condo
Crystal Key At Woolbright Place
Crystal Lake
Crystal Lake 1st Sec
Crystal Lake 2nd Sec
Crystal Lake 3930 Condo
Crystal Lake 4th Sec
Crystal Lake 941 Condo
Crystal Lake 960 Condo
Crystal Lake Condo 4100
Crystal Lake Villas
Crystal Lake Villas 64-20 B
Crystal Lakes
Crystal Lakes 1st Sec
Crystal Paradise Estates U-1
Crystal Paradise Estates Unrec
Crystal Park
Crystal Park S
Crystal Pointe
Crystal Pointe 1
Crystal Pointe Ii Condo
Crystal Pointe Iii Condo
Crystal River Village
Crystal Run Farms
Crystal Springs
Crystal Tower Inc Condo
Crystal Valley Estates
Crystal View Townhomes
Crystal View Townhomes Pl
Crystal View Townhomes Plat
Csl Indianwood Mhc Llc
Cslc Indiantwood Mhc Llc
Cslc Indianwood Mhc Indianwood Llc
Cslc Indianwood Mhc Llc
Cslc Indianwoond Mhc Llc
Cslc Undianwood Mhc Llc
Ct Industrial Plat
Cuarto De Legua
Cuckoo's Nest
Cuckoos Nest
Cuelen Acres
Cuidad La Palma
Cullys Corners
Cullywood Ests
Culmer Villas
Culpeper
Culpeper County
Culpeper Lakes
Culverhouse
Cumberalnd Township
Cumberland
Cumberland County
Cumberland Cove
Cumberland Manor
Cumberland Park
Cumberland Preserve
Cumberland Range Estates
Cumberland Township
Cumberland Village
Cumbola
Cumbrian Lakes Resort Phas
Cummings Plat
Cumru Township
Cundinamarca
Cunninghill Cove
Curci Village Condo
Currioman Bay Estates
Curry Ford Road East Ph 01
Curry Sub
Curtis Bay
Curtis Bushell
Curtiss Park
Curva Del Rio Add
Curves
Cutalong
Cutler Bay Estates 2 Addn
Cutler Bay Ests
Cutler Cay
Cutler Creek Club Sec 1
Cutler Creek Club Sec 2 A
Cutler Creek Village Cond
Cutler Creek West
Cutler Hammock
Cutler Heights Estates
Cutler Lakes Condo
Cutler Landings
Cutler Landings 1st Addn
Cutler Landings Replt
Cutler Oaks
Cutler Oaks Estates
Cutler Ridge Pines
Cutler Ridge Sec 3
Cutler Ridge Sec 4
Cutler Ridge Sec 5
Cutler Ridge Sec 7
Cutler South First Addn
Cuttermill
Cutthroat Harbor Estates
Cutthroat Harbor Estates 1st Add
Cutthroat Harbor Ests
Cylburn
Cynwyd
Cypress Arms Condo
Cypress At Woodmont
Cypress At Woodmont Ii
Cypress At Woodmont Iii
Cypress At Woodmont Iii 1
Cypress Bay Estates
Cypress Bay Preserve - Phase 2
Cypress Bay West - Phase 1
Cypress Bend
Cypress Bend #5 Condo
Cypress Bend Condo 1
Cypress Bend Condominium
Cypress Bend Condominium Ii
Cypress Bend Condominium Iii
Cypress Bend Condominium V
Cypress Bend Condominium Vi
Cypress Bend Condominium Vii
Cypress Bend I-A Condo
Cypress Bend I-B And I-C
Cypress Bend I-B And I-C Condo
Cypress Bend I-D Condo
Cypress Bend Ii
Cypress Bend Iv-11 Condo
Cypress Cay
Cypress Chase
Cypress Chase Condo
Cypress Chase Condo 4
Cypress Chase Condo No 1
Cypress Chase Condo No 2
Cypress Chase Condo No 3
Cypress Chase Condo No 4
Cypress Chase Condo No 5
Cypress Chase Condo No 6
Cypress Chase Condo No 7
Cypress Chase Condo No 8
Cypress Chase North
Cypress Chase North 4 Con
Cypress Chase North No 1 Condo
Cypress Chase North No 2 Condo
Cypress Chase North No 3 Condo
Cypress Chase North No 4
Cypress Chase North No 4 Condo
Cypress Chase South
Cypress Club Condo
Cypress Club Of Kendale C
Cypress Condo
Cypress Cove
Cypress Cove Condominium
Cypress Cove Ests Sec 3
Cypress Creek Condo
Cypress Creek Country Club Se Quad
Cypress Creek Country Club Sw Quad
Cypress Creek Estates
Cypress Creek Ph Ii
Cypress Creek Phase
Cypress Creek Villas
Cypress Creek Villas Of Co
Cypress Estates
Cypress Gardens
Cypress Gardens Condomini
Cypress Gdns
Cypress Glen
Cypress Glen 104-26 B
Cypress Glen Townhomes Co
Cypress Grove
Cypress Hall
Cypress Hammock
Cypress Harbor 1st Sec
Cypress Harbor 2nd Sec
Cypress Harbor 3rd Sec
Cypress Harbor 4th Sec
Cypress Harbor 5th Sec
Cypress Harbor 5th Sec 50
Cypress Head
Cypress Head Unit 1
Cypress Head/ Parkland Lakes
Cypress Hollow
Cypress Island
Cypress Island 3 Co-Op
Cypress Island Apts 2 Co-
Cypress Island Marina Condo
Cypress Island No 1 Co-Op
Cypress Island Of Palm Beach Polo & Country Club
Cypress Isles Estates 2nd
Cypress Isles Estates 2nd Add
Cypress Isles Estates First Add
Cypress Isles Estates Fourth Add
Cypress Isles Estates/Cypress Harbor
Cypress Lake
Cypress Lake East 3 Co-Op
Cypress Lake Estates
Cypress Lake Sec 5
Cypress Lakes
Cypress Lakes 10
Cypress Lakes 12
Cypress Lakes 2
Cypress Lakes 3-A
Cypress Lakes 4
Cypress Lakes 6-A
Cypress Lakes 7-A
Cypress Lakes 8
Cypress Lakes 9
Cypress Lakes Parcels D And L
Cypress Lakes Preserve
Cypress Manor
Cypress Of Sunrise
Cypress Park
Cypress Park Condo
Cypress Plaza Annex
Cypress Point
Cypress Point 28-16 B
Cypress Point At Pga National
Cypress Point Condo
Cypress Pointe
Cypress Pointe At Coral S
Cypress Pointe At Coral Springs
Cypress Pointe I At Heron Bay
Cypress Pointe Ii At Hero
Cypress Pointe Ii At Heron Bay
Cypress Pointe Iii At Her
Cypress Pointe Iv At Heron Bay
Cypress Reach @ Palm Aire
Cypress Ridge Apt Co-Op
Cypress Royale Pud
Cypress Run
Cypress Trace Condo
Cypress Tree Condo Bldg 1
Cypress Tree Condo Bldg 2
Cypress Tree Condo Bldg 3
Cypress Tree Condo Bldg 4
Cypress Tree Condo Bldg 5
Cypress Tree Condo Bldg 6
Cypress Tree Condo Bldg 7
Cypress Tree Condo Bldg 9
Cypress Village Condo
Cypress Woods
Cypress Woods 2
Cypress Woods 2, Summer Chase
Cypresses Of Boca Lago
Cypresses Of Boca Lago Co
Cypresses Of Boca Lago Condo
Cyrandall Valley
D & B Subdivision
D & M Acres
D Evereux West
D Orsay
D&J Campsites Unit 3
Da Vinci On Douglas A Con
Da Vinci On Douglas Condo
Dacarlo
Dade Estates
Dadeland Capri Condo
Dadeland Cove
Dadeland Cove Sec 1
Dadeland Cove Sec 2
Dadeland Grove Condo
Dadeland Park Condo
Dadeland Park Sub
Dadeland Place Condo
Dagsboro
Dahlia Gardens Condo
Dahlia Park Of Wildewood
Daisy Hill Estates
Daisy Sub
Dakota
Dakota Crossing
Dale City
Dale Woods
Dalecrest
Dalevue
Dallas
Dallastown
Dallastown Boro
Dalmatia
Dalton Glen
Dalton Manor Amen Plat
Dalton Place Condo
Dalvian,Mendoza
Damascus
Damascus Hill
Damascus Outside
Damascus Valley Park
Damascus Village
Dames & Young Resub Blk
Dana Heights
Danbridge Estates
Danbury Forest
Dancy Tract
Dane Ridge Condo
Danforth
Dangerfield Manor
Dania Beach
Dania Country Club Estate
Dania Golf View
Dania Heights
Dania Heights Add
Dania Place (The) Condo
Dania Preserve
Danians Condominium No 2
Danians North Condo
Danians South Condo
Daniele Condo
Daniels Park
Daniels Park- Addn
Daniels Purchase
Dankwardts Sub
Danlee
Danville
Danville/Riverside
Danwood
Dapa
Darby Hall
Darby Hall Apts Condo
Darbybrook
Darcey Estates
Dares Beach
Daretown
Dark Hammock
Dark Hammock Ranchettes
Dark Hammock Unit 2
Darl
Darleigh Manor
Darley Green
Darley Park
Darley Woods
Darlington Manor
Darlington Pointe
Darlington Sub
Darlington Village
Darlington Woods
Darnestown At Travilah
Darnestown Outside
Darryl Gardens
Dartmouth College
Dartmouth Glen
Dartmouth Green
Dartmouth Woods
Dartmouth Woods Ii
Datorre Sub
Dauberton
Dauphin
Dauphin County
Dav Mar Village
Davenport Pb 3 Pg 58 & 59
Daventry
David William Hotel Condo
Davide Isle
Davide Isles
Davidson One Sub
Davidsons Unrecorded Subd
Davidsonville Gardens
Davie
Davie Boulevard Park
Davie First Add
Davie Heights Extension
Davie Little Ranches Amen
Davie West
Davis
Davis Add 3-28 D
Davis Addn To Bisc Park V
Davis Citrus Farms
Davis Harbor
Davis Isles
Davis Isles Sec 4
Davis Isles Sec 5
Davis Place
Davis Plat
Davis Strasburg
Dawn Acres
Dawn Village
Dawson
Dawson Landing
Dawson's Corner
Daybreak At Blue Mountain
Daylesford Estates
Daylesford Lake
Days Range
Dayton
Dayton Center Countr
Daytona Beach Resort Conference Center
Daytona Gardens Plat 6
Daytona North
Daytona Park Estates
De Forest Manor
De La Bahia
De La Bahia Condo
De Leon Park
De Soto Lakes Unit 10
De-Lin Estates
Deacons Walk
Deal Manor
Deale
Deale Beach
Deans Lndg At Sheffield Forests Ph 1
Deanwood
Deanwood Park
Dearnley Park
Deauville Gardens Condo
Deauville Terrace Co-Op
Deauville West Inc Co-Op
Debutts
Debuys Plat
Debuys Replat No 1
Debuys Replat No 3
Decarie
Decarlo Track
Decarlo Tract
Decatur
Decatur Farm
Decatur Heights
Decatur Hgts Add
Decoverly
Decoverly Adventure
Deeann Lakefront Est
Deep Creek
Deep Creek Commons
Deep Creek Highlands
Deep Creek Lake
Deep Creek Village
Deep Harbor
Deep Harbor Farm
Deep Harbour
Deep Harbour Town Homes
Deep Neck
Deep Point
Deep Rock
Deep Run Park
Deep Water
Deepdale
Deepwater Cove
Deepwood
Deer Creek
Deer Creek Country Club
Deer Creek Sub
Deer Creek Village Sec 01
Deer Ford North
Deer Harbour
Deer Haven
Deer Hollow
Deer Meadows
Deer Mountain Estates
Deer Park
Deer Park Estates
Deer Park Heights-Addn
Deer Path Hill
Deer Path Woods
Deer Point
Deer Pointe
Deer Ridge
Deer Ridge Estates
Deer Run
Deer Run 2
Deer Run 2 / White Fences
Deer Run Acres
Deer Run Commons
Deer Run Crossing
Deer Run Estates
Deer Run Mhp
Deer Run Springs
Deer Run Springs Condo
Deer Spring
Deer Valley
Deerborne
Deerbrook
Deerfield
Deerfield Beach
Deerfield Beach 4-4
Deerfield Beach Century Village
Deerfield Beach Condo
Deerfield Beach Estates
Deerfield Beach Gardens
Deerfield Beach Gardens C
Deerfield Beach Gardens Condo
Deerfield Beach Intracoastal Townhomes
Deerfield Colony Court / Downtown Deerfield / Cove
Deerfield Crossing
Deerfield Estates
Deerfield Highlands
Deerfield Knoll
Deerfield Lake
Deerfield Lake Condominium
Deerfield Lake Mobile Home Park
Deerfield Manor Co-Op
Deerfield North
Deerfield Palms Condo
Deerfield Park
Deerfield Ph 02a
Deerfield Pines Condo
Deerfield Pond
Deerfield Ridge Sec 1
Deerfield Shores
Deerfield Village
Deerfield Village Mhp
Deerfox
Deerhaven
Deerhurst
Deering Bay Condo I
Deering Bay Condo Ii
Deering Bay Estates
Deering Bay Marina Co-Op
Deering Bay Marina Coop K
Deering Woods
Deersong
Deersong/Sunrise
Deerwood
Deerwood (7)
Deerwood Acres Unr
Deerwood Country C
Deerwood Estates
Deerwood Lake Replat S/D
Deerwood Mountain Estates
Deerwood Part Iv
Deerwood Townhomes
Deerwood Villas Sec 1
Deerwood Villas Sec 2
Defense Heights
Degrange
Deierl Park
Deimler Manor
Del Brook Estates
Del Ida Park
Del Ida Park In
Del Lago Isle
Del Lago Isle 42-2 B
Del Mar
Del Mar Village
Del Prado
Del Prado Condo
Del Prado Gardens Sec 1
Del Prado Gardens Sec 2
Del Prado Gardens Sec 3
Del Prado Marina
Del Ray
Del Ray/Rosemont
Del Rio Condo
Del Rio Park
Del Rio Village North
Del Sega
Del Webb
Del Webb At Tradition
Del Webb At Tradition 5b & 6
Del Webb At Tradition Pla
Del Webb At Tradition Plat No. 3
Del Webb At Tradition Plat No. 4
Del Webb At Tradition Plat No. 5a
Del Webb At Tradition Plat No. 5b & 6
Del Webb Naples
Del Webb Tradition
Del Webbs Sun City Florida
Delair
Delaire Country Club
Delaire Landing
Delancey
Delancey Court
Delancey Place
Delano Residences
Delaware City
Delaware Gardens
Delaware Manor
Delaware Park Sec 1
Delaware Rise
Delaware Trace
Delbrook Mhp
Delcrest
Delcrest Park
Delight At Fairwood
Delilah Oaks
Dell Manor Condominium
Dell Park
Dell Webb Naples Parcels 307-310
Della Brook
Dellabrooke Forest
Dellawana Place
Dellwood
Delmar Hgts
Delmar Manor
Delmar Village
Delmarva Park
Delmont Manor
Delphi Towers
Delphi Towers Condo
Delphine Condo
Delray Bch Shores
Delray Beach
Delray Beach Club Apts Condo
Delray Beach Estates
Delray Beach Heights 1st Add
Delray By The Sea
Delray Dunes
Delray Dunes 2nd Sec
Delray Dunes Bahia Villa Condo Delray Dunes 2nd Se
Delray Dunes Bonsai Villa Condo
Delray Dunes First Sec
Delray Dunes Garden Villas Condo
Delray Dunes Holly Villas Condo
Delray Dunes Parcel 8
Delray Dunes Slash Pine Villas Condo
Delray Estate Homes
Delray Estates Condo Ph Iv
Delray Garden Estates 1
Delray Golf View Condo Apts
Delray Harbor Club Condo
Delray Isle
Delray Lakes
Delray Lakes Est
Delray Manor
Delray Manor 3rd Add
Delray Manors In
Delray Mnr
Delray Oaks
Delray Oaks Condo
Delray Oaks West Condo
Delray Ocean Estates North
Delray Resub Of Blk 72 And W Pt Of Blk 80
Delray Ridge
Delray Shores First Add
Delray Shores First Add In
Delray Summit Condo
Delray Town
Delray Town Of
Delray Trails
Delray Trails At Villa Del
Delray Trails At Villa Delray Pud
Delray Trails At Villa Delray Pud Pod C Repl
Delray Villas
Delray Villas 1
Delray Villas 2
Delray Villas 3
Delray Villas 4
Delray Villas 5
Delsea Drive
Delsea Estates
Delta
Delta Boro
Delta Ridge
Delton Lakes Un 65
Deltona Lakes
Deltona Lakes Unit 32
Deltona Lakes Unit 59
Delview
Delvista A Condo
Delvista B Condo
Delvista B Townhomes
Delvista Towers Condo
Dembytown
Democracy Commons
Demory Farm
Demott & Silver
Denali Way
Denis Subdivision
Dennis
Dennis Dev Townhouses
Dennis S/D Unrec
Dennis Township
Denton Area
Denton Manor
Denton Woods
Denver Borough
Denver/Quail Hollow
Deptford Chase
Derry
Derry Township
Derwood Station
Desai Estates
Desota Residences
Desoto Park Condo
Desoto Park North Condo
Desteubens Sub
Detjens Dairy
Deutzville
Devils Reach Condos
Devland Farms
Devlin Square
Devon
Devon Aire Villas Sec 8
Devon Condo
Devon Condominium
Devon Condominium F
Devon Condominium H
Devon Condominium I
Devon Court
Devon Creek
Devon Green
Devon Hill
Devon Hills Condo
Devon House Condo
Devon Park
Devon Place
Devon-Aire Estates Sec 5
Devon-Aire Estates Sec 7
Devon-Aire Villas Sec 5
Devonaire Condo At Pembro
Devonaire Condo At Pembroke
Devonforde Estates
Devonne Woods
Devonshire
Devonshire At Whitemarsh
Devonshire Condo
Devonshire Estate
Devonshire Gardens
Devonshire Park Sub
Devonshire Square
Devonshire Vill
Devonshire Village
Devonwood
Devries Circle
Dew Drop Meadows
Dey Farm Estates
Deywood Lakes
Dgh1 Daytona Beach Heights
Di Lido Island
Diamante Village Condo
Diamond Building
Diamond C Ranch Pod A
Diamond C Ranch Pod C
Diamond C Ranch Pod D
Diamond C Ranch Pod E/F
Diamond C Ranch Pod G
Diamond Condo
Diamond Court Village Subdivision
Diamond Farm Codm
Diamond Head
Diamond Hill Phase 2
Diamond Lake Subdivision Phase Three
Diamond Park Re Sub
Diamond Sands 2
Diamond Sands Plat No 2
Diamond Shores
Diamond Tower Condo
Diamondhead Condo
Diamonds Unrecorded Sub
Diane Condo
Dickens Gardens Condo
Dickens Sq
Dickeyville Historic District
Dickinson Creek
Dickinson Narrows
Dickinson Place
Difficult
Difficult Run
Diggs Circle
Dill Mnr
Dillard
Dillard Park
Dillard Park Amen Plat
Dillard Park Estates
Dillman Farms
Dillman Heights 1
Dillman Heights 2
Dillon Farm
Dillon Park
Dillons Run
Dimensions North At Chape
Dimensions North At Chapel Trail
Dinner Key
Diplomat Garden Co-Op
Diplomat Golf & Racquet C
Diplomat Golf & Racquet Club
Diplomat Golf Estates
Diplomat Golf Estates 46-2
Diplomat Oceanfront Resid
Diplomat Oceanfront Residences
Diplomat Pkwy
Diplomat Square Condo
Diplomticos Aravaca
Discovery
Discovery Acres
Discovery Pointe
Discovery Square
Discovery Way At Riverland Prcl A
District
District 225
District 225 Condo
District 225 Miami
District 3
District Condo
District Heights
Distrito 90
Divines Chesterbrook
Divivo Property
Dixiana Condo
Dixie Estates 2nd Addn
Dixie Gardens
Dixie Gardens Condo
Dixie Grove Residences Co
Dixie Heights
Dixie Heights Garden
Dixie Heights Gardens
Dixie Heights Unit No 1-A
Dixie Heights Unit No 3
Dixie Heights Unit No 4
Dixie Heights Unit No 5
Dixie Highway Track
Dixie Hwy Park
Dixie Hwy Tr
Dixie Lane
Dixie Manor
Dixie Park
Dixie Park Add
Dixie Park Addition
Dixie Park Heights
Dixie Pines 2nd Rev
Dixie Pines No 2
Dixie Ranch Acres
Dixie Ranch Estates
Dixie View
Dixie Way
Dixie Wayside Track
Dixieland
Dixon Square
Do Not Use For Legal Docum
Dobbinsville
Dockside
Dockside Condominium
Docstone Woods
Doctors Arm
Dodd Manor
Dodd's
Dodge Estates
Dodge Estates In
Dodge Plat
Doe Run Estates
Dogue Creek
Dogwood
Dogwood Acres
Dogwood Condo
Dogwood Garden Condo
Dogwood Gardens Condo
Dogwood Hollow
Dogwood Lake Est
Dogwood Lake Estates
Dogwood Lakes
Dogwood Lakes Estates
Dogwood Meadows
Dogwood Pl
Dogwood Valley
Dogwood Village
Dogwoods
Dol Ray
Dolan Sub
Dolce Vita Condo
Dolfield
Dolittle Farm
Dolphin Condo
Dolphin View
Domi Sub
Dominion
Dominion Heights
Dominion Hills
Dominion Station
Dominion Valley
Dominion Valley Country Club
Domino One Condo
Domus
Domus Brickell Park
Domus Brickell Park Condo
Domus Flats
Domus One
Domus Park
Domus Park Brickell
Don Elias Estates
Donahoe
Doncaster Village
Donegal Crossings
Donmoore Villa Amd Pl
Donna Lee Gardens
Donneybrook
Donny Brook
Donnybrook
Donovans Trailer Park
Dontrine Sub Plat One
Dontrine Sub Plat Two
Donwood Estates
Dorado At Hamptons West
Dorado Puerto Rico, 00646
Dorado, Pr 00646
Dorado, Sao Paulo
Doral Breeze
Doral Cay
Doral Commons Residential
Doral Dunes 1st Addn
Doral Estates
Doral Gardens Condo
Doral Gardens Ii Condo
Doral Grand Condo
Doral House Condo No 1
Doral House Condo No 2
Doral House Condo No 3
Doral I
Doral Isles
Doral Isles Antilles 1st
Doral Isles Catalina
Doral Isles Martinique
Doral Isles Mediterranea
Doral Isles North Sec One
Doral Isles North Sec Thr
Doral Isles North Sec Two
Doral Isles Pacifica
Doral Isles Riviera
Doral Isles Santa Lucia
Doral Isles St Croix
Doral Isles St Croix 1st
Doral Isles St Lucia
Doral Isles Venetia Repla
Doral Lakes
Doral Landings East
Doral Northeast Townhomes
Doral Oaks Condo #1
Doral Palms
Doral Palms North
Doral Palms South
Doral Park C Club Villas
Doral Pk Co Club Villas C
Doral Reserve
Doral Sands
Doral Woods
Dorann Condo
Dorchester
Dorchester Avenue
Dorchester Condo
Dorchester Estates
Dorchester Greens
Dorchester Of Palm Beach Condo
Doria Condo
Doroly Gardens
Dorothy
Dorset At Century Village Condo
Dorset House Condo
Dorsey Arms Condo
Dorsey Hall
Dorsey Park
Dorsey Park 4th Add
Dorsey Park First Add
Dorsey Park Second Add
Dorsey Search
Dorseys Blue Springs Park Mb
Dorseys Regard
Double Rock Townhouses
Double Tree
Double Tree 01
Double Tree 01, Lost Lakes
Double Tree 06
Douglas Addn
Douglas Circle
Douglas Estates
Douglas Grand Condo
Douglas Manor
Douglas Park
Douglas Place Condo
Douglas Sub
Douglas Subdivision
Douglas Village
Douglass Village
Douglynne Farm
Dove Creek Estates
Dover
Dover Balmoral Riverwood
Dover Boro
Dover Downs
Dover East
Dover Hall Condo
Dover Hgts
Dover Meadows
Dover Park
Dover Twp
Doverbrook Gdns
Doveville
Dowden Addition
Dowden Terrace
Dowdens Addition
Dower House Estates
Down South
Down Town Waynesboro
Down Twp
Downe Twp
Downer Palms Div 2
Downingtown Boro
Downingtown Common
Downs At Meadows Branch
Downsville
Downtown
Downtown Bel Air
Downtown Bethesda
Downtown Brunswick
Downtown Chestertown
Downtown Culpeper
Downtown Dadeland
Downtown Dadeland Condo N
Downtown Delray Beach
Downtown Doral Dutcher
Downtown Doral South
Downtown Doral South Phas
Downtown Doral South Phase One
Downtown Doral South Phase Two
Downtown Easton
Downtown Elkton
Downtown Emmitsburg
Downtown Frederick
Downtown Fredericksburg
Downtown Front Royal
Downtown Hagerstown
Downtown Havre De Grace
Downtown Hollywood
Downtown Lancaster
Downtown Leesburg
Downtown Martinsburg
Downtown Miami
Downtown Myerstown
Downtown Oc
Downtown Ocean City
Downtown Perryville
Downtown Silver Spring
Downtown Stuart
Downtown Wayne
Downtown Waynesboro
Downtown Westminster
Downtown York
Downtown/Mainstreet
Doylestown
Doylestown Boro
Doylestown Hunt
Doylestown Station
Doylestown Walk
Dozer Mill
Dp19 Douglas Park
Drake Tower Condo
Dranesville
Dranesville Estates
Drawyers Creek
Dream Bay
Dream House
Dream Valley
Dream Villas Condo
Dreams Landing
Drechsler Estates
Dreher Park
Dresden Green
Drexel 15 Condo
Drexel Gate
Drexel Hill
Drexel Hills
Drexel Manor
Drexel Park Garden
Drexel Park Townhomes I Condo
Drexel Woods
Drexelbrook
Drexelwood
Driftwood Acres
Driftwood Acres No 10
Driftwood Acres No 15
Driftwood Acres No 16
Driftwood Acres No 18
Driftwood Acres No 20
Driftwood Acres No 3
Driftwood Acres No 5
Driftwood Acres No 7
Driftwood Acres No 9
Driftwood Estates No 15
Driftwood Estates No 2
Driftwood Estates No 29
Driftwood Landing
Driftwood Manor
Driftwood Plaza
Driftwood Plaza No 3
Druid Heights
Druid Hill
Druid Hill Park
Drum Cliffs
Drum Point
Drumeldra Hills
Drums
Drumsheugh
Dry Fork District
Dry Run
Drydens Sub Unrec On Am-18
Drysdale
Drysdale Manor
Du Barry Condominium
Du Mar Estates
Dua Lake Ridge West
Dua Miami
Dual Condo No 1
Dubai Hills Estate
Dublin
Dublin Acres
Dublin Crossing
Dublin Mdws
Dublin Vil Green
Duck Run
Duckettville
Ducks Neck
Duckwood
Duclos
Dufief
Dufief Mill Brook
Dufief Mill Estates
Duhe Estates
Duke Estates
Dukes Plantation
Dulaney Forest
Dulaney Gate
Dulaney Towers
Dulaney Valley Gardens
Dulles
Dulles Technology
Dumbarton Heights
Dumbarton Meadows
Dumfries Olde Port
Dumont Oaks
Dun Rovin
Dunbar Terrace
Dunbar Woods Condo 4
Dunbar Woods Condo I Ii And Iii In Or4410p782,
Dunbarton
Duncan Patton
Duncan Village
Duncannon
Duncannon Boro
Dundalk
Dundalk Farms
Dundalk Highlands
Dundalk Manor
Dundalk Village
Dundree Knoll
Dundridge Farm
Dune Condo
Dune Deck Of The Palm Beaches Condo
Dune Walk
Dunedin
Dunes Condo
Dunes Of Ocean Ridge Condo
Dunes Towers Cond A & B 15-42-43, Part Of Gov
Dunes Towers Condo
Dungadin
Dunkirk South
Dunleith
Dunlinden Acres
Dunlogan
Dunloggin
Dunlop Hills
Dunn
Dunn Loring
Dunn Loring Village
Dunn Loring Woods
Dunnellon Heights
Dunnhill Isle
Dunnings Miami Shores Ext
Dunnwoody Lake
Dunwoodie At Keys Gate
Duo Condominium
Duo Condominium East
Duo Condominium West
Dupont
Dupont Circle
Dupont East
Dupont Heights
Dupont Plaza
Dupont Village
Durfeys Sub
Durham A Condo
Durham B Condo
Durham C
Durham C Condo
Durham D Condo
Durham E Condo
Durham F Condo
Durham I Condo
Durham J Condo
Durham Manor
Durham Park
Durham S Condo
Durham T Condo
Durham Terrace
Durham U Condo
Durham Vil
Durham Village
Durham W Condo
Durniers
Duross Heights
Durrs Sub
Durward Heights
Dushore
Dutch Hollow
Dutch Neck Estates
Dutchers Estate
Dutchman's Harvest
Dutchmans Cove
Dutchmans Creek Hamlet
Dye Fore Estates, Casa De Campo, Dominican Republi
E Court Of Phoenix Pk A R
E J Carters
E L Brooks
E L Lesleys
E M Pattisons
E O Friend Sub
E Vineland City
E W Sale
E11even
E11even Club Hotel & Resid
E11even Hotel
E11even Hotel & Residen
E11even Hotel & Residences
E11even Hotel Residences
E11even Residences
E11even Residences Condo
E11even Residences Miami
Eager Park Townhomes
Eagle Bay
Eagle Creek Development
Eagle Creek Village
Eagle Farms
Eagle Glen
Eagle Hammock
Eagle Harbor
Eagle Hill
Eagle Lake
Eagle Lake Phase 4a
Eagle Manor
Eagle Mountain
Eagle Nest Condo
Eagle Oak
Eagle Point
Eagle Point At Lake Anna
Eagle Pointe
Eagle Retreat At Savanna Club
Eagle Ridge
Eagle Ridge Sub
Eagle Rock
Eagle Rock Resort
Eagle Run
Eagle Stream
Eagle Trace
Eagle View
Eagle Wing Estates
Eagle's Nest
Eagle's Retreat At Savanna Club Phase 2
Eaglehead Summerfield
Eagleridge Ph 02
Eagles Chase
Eagles Landing
Eagles Landing At Waters Edge
Eagles Landing Of P B Polo And Country Club
Eagles Landing Of P B Polo And Country Club Wellin
Eagles Loft
Eagles Mere
Eagles Nest
Eagles Nest Townhomes Condo
Eagles Passages
Eagles Point Sub
Eagles Pointe
Eagles Pointe Village
Eagles Rest
Eagles Retreat At Savanna Club
Eagles Ridge
Eagles View
Eagleswood
Eagleton Forest
Eagleview
Eagleview Estates
Eaglewood
Earl
Earl Haines-Shanholtz
Earles Lake
Earleton Shores
Earlington Heights
Earlington Hgts
Early Manor
Earlys Green At Meadowbranch
Earman Villas Condo
East Arlington
East Atlantic Gardens Con
East Baltimore Midway
East Berlin
East Berlin Area
East Boniwood
East Cambridge
East Camden
East Catonsville
East Chobee
East Coast Cattle Company's Subdivision
East Coast Lumber Co
East Cocalico Twp
East Columbia
East Dixie Park 1st Addn
East Donegal
East Donegal Twp
East Dover - Bayshore
East Dover - Gilford Park
East Dover - Watersedge
East End
East End Lancaster
East Evergreen Estates
East Falls
East Falls Church
East Field
East Garlfield
East Gate
East Gate 3 Condominium
East Gate Villas Condominium
East Glen Burnie
East Grove East
East Hampton
East Hanover Township
East Harrisburg
East Haven
East Hempfield
East Hempfield Twp
East Hialeah
East Hill
East Kensington
East Lake Village
East Lake Village 1
East Lake Village 2
East Lake Village No 2
East Lake Village No 3
East Lampeter Twp
East Liberty City Homesit
East Linthicum Heights
East Market At Fair Lake
East Meaadows
East Millville
East Monument Historic District
East Mt Airy
East Nantmeal Twp
East New Market
East Oak Lane
East Oakland Park
East Of The Sun
East Orange
East Orlando Ests Sec 1 Unrec
East Passyunk Crossing
East Penn Township
East Pennsauken
East Pennsboro
East Petersburg
East Piscataway
East Plantation 2nd Sec
East Plantation Estates
East Plantation First Sec
East Point
East Point Towers
East Point Towers Condo
East Prospect Rd
East Quarter
East Ridge
East Ridge Townhomes
East Riverdale
East Shenandoah
East Shore
East Shore Crest Sec 2
East Side
East Side Of City
East Springbrook
East St Clair
East Stroudsburg
East Sudbrook Park
East Towson
East Union Twp
East Vienna Woods
East View
East Village
East Vineland
East Willinston
East Williston
East Wind Lake Village
East York
Eastampton Farms
Eastampton Mews
Eastampton Village C
Eastbrook Annex
Eastbrook Condominium Apt
Eastbrook Condominium Apts Inc
Eastbrooke Coach Homes Condo
Eastbrooke Subd Unit 03
Eastburn Farms
Eastchurch
Easter Heights
Eastern Heights
Eastern Marine Condo
Eastern Market
Eastern Shores
Eastern Shores 1st Addn
Eastern Shores 2nd Addn
Eastern Shores Garden Apt
Eastern Shores Palo Alto
Eastern Shores White Hous
Eastern Terrace
Eastern View
Easterwood
Easterwood Park
Eastfield
Eastgate At Hunters Run Condo
Eastgrove East
Eastgrove Estates Sec 1
Eastgrove Estates Sec Fou
Easthampton Condo
Eastlake Estates
Eastland Gardens
Eastland Hills
Eastman Heights
Easton
Easton Club
Easton Club East
Easton Farms
Easton Historic District
Easton Tech Ctr
Easton Village
Eastover Hills
Eastpines
Eastpointe
Eastpointe Condo
Eastpointe Country Club
Eastpointe Country Club 4
Eastpointe Country Club 6
Eastpointe Country Club 7
Eastpointe Country Club 7a
Eastpointe Country Club 7c
Eastpointe Country Club 8
Eastpointe Country Club Pl 8
Eastpointe I
Eastpointe I Condo
Eastpointe Ii
Eastpointe Sub 12 B
Eastpointe Sub 12-A
Eastpointe Sub 13a
Eastpointe Sub Pl 9-A In Pb49p3 Lt 22
Eastport
Eastridge Estates
Eastside
Eastside At Aventura Cond
Eastside Canal House Cond
Eastview
Eastview At Ballston Metro
Eastview Gardens
Eastview Manor
Eastview Park
Eastview Subdivision
Eastview Village Square C
Eastway Park
Eastway Park Sec 3
Eastway Park Sec 4
Eastwick
Eastwinds At Crosswinds
Eastwinds At Crosswinds C
Eastwinds At Crosswinds Condo
Eastwood
Eastwood Meadows
Eastwood Of Wellington 3
Eaton At Hamptons West Co
Eaton Square
Eau Gallie By The Sea
Eau Gallie Shores
Ebb Tide Beach
Ebenezer Area
Eby Park
Echelon Mews
Echo Aventura
Echo Beach
Echo Brickell Condo
Echo Condo
Echo Dale
Echo Farms
Echo Gardens
Echo Glen
Eckhart
Eckhart Mines
Eckington
Eclipse On Center Park
Econfina Preserve Urs Trac
Economy Homesites
Ecovillage
Ed5 New Eden
Edc Associates Plat
Eddington Gdns
Eddington Park
Eddystone Village
Edelen Station Condominiums
Eden Brook
Eden Estates
Eden Heights
Eden Hill
Eden Hollow
Eden House Condo
Eden Isles Condo No 5
Eden Isles Condo No 6
Eden Isles Condo Part 3
Eden Park
Eden Pines Colony 3rd Add
Eden Place Condo
Eden Point North Condo
Eden Point South Condo
Eden Properties
Edenaire
Edenbridge Gardens
Edenholme Gardens
Edenville
Edenville Road
Edesville
Edgar Grove
Edge Condo
Edge Hill
Edge Mead
Edgecombs Add To Deerfiel
Edgecombs Add To Deerfield
Edgefield 1st Sec
Edgehill
Edgehill Acres
Edgelea
Edgely
Edgemere
Edgemere/Sparrows Point
Edgemont
Edgemont Park
Edgemont Preserve
Edgemoor
Edgemoor Gardens
Edgemoor Terrace
Edgemoore
Edgerstoune
Edgerton
Edgewater
Edgewater Acres
Edgewater Acres Unit 06 Re
Edgewater Arms
Edgewater Arms Co-Op
Edgewater At Town Center
Edgewater Beach
Edgewater Beach Condo
Edgewater Beach Towers Condo
Edgewater Condo
Edgewater Country Estates
Edgewater Estates
Edgewater Estates 1st Add
Edgewater Ii At Carlton La
Edgewater Lofts Condo
Edgewater Park
Edgewater Park Amd Pl
Edgewater Place Condo
Edgewater Village
Edgewater Villas
Edgewater Villas Condo
Edgewood
Edgewood Acres
Edgewood Bay
Edgewood Condomminiums
Edgewood Condos
Edgewood East Section E
Edgewood Estates
Edgewood Hills
Edgewood Meadows
Edgewood Park
Edgewood Sub
Edgewood Townhomes
Edificio Gairaca
Edificio Salguero Suites
Edificio San Marcos
Edificio Sensara,Lima Peru
Edificio Terral
Edificio Tucuman
Edinborough Estates
Edinburg
Edinburg Square
Edinburgh
Edinburgh Villas
Edison
Edison East Phase 2
Edison Heights
Edison Heights Sec B
Edison Heights Sec D
Edison Hgts
Editors Park
Edkar Sub
Edler Tract
Edmond Heights
Edmondson
Edmondson Heights
Edmondson Ridge
Edmondson Viillage
Edmondson Village
Edmonson Heights
Edmonston
Edna Johnson Moody
Ednor
Ednor Gardens - Lakeside
Ednor Gardens Historic District
Edsall Bluff
Edsall Park
Edsall Terrace
Edwards
Edwards Landing
Edwards Run Properties
Efm Estates Sec 1
Efm Estates Sec 3
Efm Estates Sections Two
Egans Bluff
Egg Harbor City
Egg Harbor Twp
Egret Lake Estates Sec 1
Egret Lakes Estates Sec 1
Egret Lakes Estates Sec 2
Egret Lakes Estates Sec 3
Egret Lakes Estates Sec 7
Egret Lakes Estates Sec 8
Egret Landing At Jupiter
Egret Shores
Egypt Bend
Egypt Bend Estates
Ehearts
Eight Lakes
Eight Park
Eighth Moorings Condo
Eighty Development
Eighty Seven Park
Einsel's Subdivision
Einsels Sub
Eirean Mhor
Eisenhower
Ejido El Rebalse
El Alamo Sub
El Bosque At Little Havan
El Camino Park
El Castelay Condo
El Chioggiotto Condo
El Cid
El Cid Condo
El Cid Court
El Cid West Palm Beach
El Conquistador North Con
El Conquistador South Con
El Conquistador South Condo
El Cortecito
El Cortesito
El Dorado
El Dorado Court
El Dorado Estates
El Dorado Heights
El Dorado Park
El Dorado, Mazatlan,Mexico
El Encanto
El Jardin
El Jobean Ward 01
El Lago Condo
El Laguito
El Millon
El Molino
El Monte Park
El Nido Estates
El Palmar Condo
El Paraiso Condo
El Pen
El Penol, Santa Ana
El Pico
El Polo Condo
El Portal
El Portal Sec 3
El Portal Sec 5
El Portal Sec 6
El Portal Sec 7
El Prado By The Lake
El Prado Country Club 2nd
El Prado Xiii Condo
El Prado Xvi Condo
El Pueblo De Vera Condo
El Sol
El Sol At Main Street
El Sol At Main Street Con
El Sol At Main Street Condo
El Sol Condo
El Sunzal
El Tovar At University Par
El Vero Villa Subdivision
El Viento At Boca Pointe Condo Nos I And Ii Decls
El-Ad Enclave At Miramar
El-Ad Enclave At Miramar C
El-Ad Enclave At Miramar Condo
El-Ad Nob Hill Condo
El-Ad Poinciana
El-Ad Poinciana Condo
El-Ad Residences At Miram
El-Ad Villaggio Condo Bld
El-Ad Villaggio Condo Bldg 4
Elan At Calusa Condo I
Elan At Calusa Condo Ii
Elan At Calusa Condo Iv
Elan At Calusa Condo Ix
Elan At East Market
Elan Mews
Elbaroda
Elbaroda Grove
Elberta Empire
Elcino Manor
Elda Gdns Sub
Elderberry
Elderberry Gardens Condo
Elderberry Pond
Eldersburg
Eldorado Country Club Apt
Eldorado Country Club Apt Condo
Eldorado Country Club Tow
Eldorado Country Club Towers
Eldorado Estates In Plantation
Eldorado Heights
Eldorado Hills
Eldorado Plains
Eldorado Plaza East Condo
Eldorado Plaza West Condo
Eldorado Subdivision
Eleanor Park
Element At Mill Creek
Eleuthera Village A Condo
Eleuthera Village C Condo
Eleuthera Village D Condo
Eleuthera Village E Condo
Eleven Cedars- Addn
Eleven Hotel & Residences
Eleven Hotel And Residenc
Eleven Hotel And Residence
Eleven Hotel Andresidences
Eleven Hotel Residences
Eleven Residences
Eleven Slade
Elias Sub
Elisa Condo
Elisa Condominium
Elise Estates
Elizabeth Haddon
Elizabeth Hills
Elizabeth Hills Phase 4
Elizabeth Park
Elizabeth Station
Elizabeth Twp
Elizabeth Village
Elizabeth's Crossing
Elizabeths Crossing
Elizabeths Landing
Elizabethtown
Elizabethtown Borough
Elizabethtown/Timber
Elizabethville
Elizabethville Borough
Elk Creek
Elk Creek Farm
Elk Creek Landing
Elk Forest
Elk Garden
Elk Mountain
Elk River Basin
Elk View
Elkins Park
Elkins Park House
Elkmore
Elkridge Crossing
Elkridge Town Center
Elkton
Elkton Heights
Elkton Townhouses
Elkwood
Elkwood Estates
Ella Miami Beach
Ellamar
Ellas Little Acres
Ellas Little Acres 1st Ad
Ellegood Estates
Ellendale
Ellenwood
Ellerslie
Ellerslie Estates
Ellesmere
Ellesmere A Condo
Ellesmere B Condo
Ellesmere C Condo
Ellesmere D Condo
Elleven
Elleven Hotel Residences
Elleven Residences
Ellicott Crossing
Ellicott Hills
Ellicott Mills
Ellicotts Retreat
Ellington
Ellington At County Line
Ellington Estates
Elliott Velva Gardens
Ellipse At Westfields
Ellis Point
Ellwood Park
Elm
Elm Court Of Wildewood
Elm Farm Estates
Elm Gardens Condo
Elm Park
Elm Ridge
Elm Ridge Park
Elmarc Twh A/K/A Lilac St
Elmcrest
Elmhurst
Elmhurst Estates
Elmhurst Ridge
Elmtowne
Elmvale Condo
Elmwood
Elmwood Farm
Elmwood Park
Eloquence On The Bay
Eloquence On The Bay Cond
Eloquence On The Bay Condo
Elser
Elser Residences
Elsinboro Point
Elsinore Beach Boulevard
Elsmere
Elsmere Gardens
Elsmere Park
Elstonville
Elvaton Acres
Elvaton Towne Condo
Elverson
Elwa Place
Elwa Place Extension
Elwood
Elwood Park
Ely
Elysee
Elysee Miami
Elysee Nancy Terrace
Elysian Heights
Elysium At The Arbors Pl 2
Emancipation Park
Emarita
Embarcadero Condo
Embassy Lakes
Embassy Lakes Parcel
Embassy Lakes Phase Ii
Embassy Park Cond Decl Filed 7-19-79 Or3101p915 Am
Embassy Park Condo
Embassy Place Condo
Embassy Square Condo
Embassy Tower Ii
Embassy Tower Ii Inc Cond
Embassy Tower Ii Inc Condo
Embassy Tower Inc Condo
Embrey
Embrey Mill
Embrey Mill Estate
Emerald Chase
Emerald Condo
Emerald Courts - Opal Creek
Emerald Cove
Emerald Creek Townhomes
Emerald Ct 1st Addn
Emerald Farm
Emerald Forest Of Wellington
Emerald Forest Of Wellington 2
Emerald Forest Of Wellington 3
Emerald Greens Sub
Emerald Hills
Emerald Hills C C Apts Co
Emerald Hills C C Apts Condo
Emerald Hills Cc
Emerald Hills Country Clu
Emerald Hills Sec 3
Emerald Island Resort
Emerald Isle At Laguna La
Emerald Isle At Laguna Lakes Condo
Emerald Isles
Emerald Isles Condo
Emerald Isles West Phase
Emerald Lake Townhomes
Emerald Lakes
Emerald Lakes Ph 02 03 & 03a
Emerald Oaks 22 Condo
Emerald Oaks 24 Condo
Emerald Palms
Emerald Point Sub
Emerald Pointe
Emerald Pointe 1
Emerald Pointe 2
Emerald Pointe Condo
Emerald Ridge
Emerald Tower Condo
Emerald Valley
Emerson
Emerson Oaks
Emerson Villas
Emersons Reach
Emery Ii
Emilia Condo
Emilios Place At Oasis
Emily Condo
Emmaus
Emmitsburg
Emory Grove Park
Emory Hills
Ems32 El Mira Sol
Emswiler Subdivision
Encampment Grounds
Encantada
Encantada Ph 2
Enchanted Acres
Enchanted Lake
Enchanted Lake Sec 3
Enchanted Lake Sec 5
Enchanted Lake Sec 6
Enchanted Woods
Enchantment
Enclave
Enclave 2nd Sec
Enclave 2nd Section
Enclave At Arundel Hills
Enclave At Bellaire
Enclave At Black Point Ma
Enclave At Crown Park
Enclave At Crown Park Condo
Enclave At Doral Condo No
Enclave At Fair Lakes
Enclave At Mangonia Park
Enclave At Miami Springs
Enclave At Odessa
Enclave At Old Quarry Knoll
Enclave At Ridgewood
Enclave At Ridley Cr
Enclave At Seven Oaks
Enclave At Sherwood
Enclave At Summer Beach
Enclave At The Fountains 3
Enclave At The Park Condo
Enclave At Waverly Woods
Enclave By Transeastern
Enclave Of Palm Beach Cond Decl Filed 2-12-85 In
Enclave Of Palm Beach Condo
Enclave On South Beach
Enclave Palm Beach Condo
Enclave Sandpiper Condo
Enclave South Phase
Enclave South Phase 1
Enclave South Phase 2
Encore
Encore At Ovation Way
Encore Of Mclean
Enfield
Enfield Chase
Enfield Chase Plat Five
Enfield Farm
England Run
England Run North
England Run Townhouses
Englandboro
Englebrook Park
Englewood
Englewood East
Englewood Manor
English Chase
English Consul Estates
English Country Manor
English Hills
English Manor
English Mill Estates
English Subdivision
English Village
Ensenada Condo
Ensenada Condo Bldg E-I
Ensenada Condo Bldg E-Ii
Ensenada I
Enterprise Estates
Enterprise Forest
Enterprise Knolls
Enterprise Knolls-Plat S
Enterprise Ridge
Entourage In The Sun
Entrada
Entrada Acres
Entrada Condominium I
Environ
Environ I Condo 1 And 2
Environ I Condo 3 And 4
Environ I Condo 5 & 6
Environ I Condo 5 And 6
Environ I Condo 7 & 8
Environ I Condo 7 And 8
Environ I Condo 9
Environ Ii
Environ Towers
Environ Towers I Condo
Environ Towers Ii Condo
Environment I Condo
Envoy Apartments Condomin
Envoy Cond Decl Filed 12-19-83 In
Envoy Condo
Envoy North Condo
Eola Park Hgts
Eos Twenty-One
Ephrata
Ephrata Borough
Ephrata Twp
Epic West Condo
Epperson Heights
Epping Forest
Epsom Farm
Equestrian
Equestrian Club
Equestrian Club Estates 1
Equestrian Club Estates 2
Equestrian Club Estates 3
Equestrian Est
Equestrian Estates
Equine Meadows
Equus Agr Pud Ph 2
Equus Agr Pud Ph 3
Erbs Pleasure
Erdenheim
Erdman
Erial
Erica Gardens
Ericksons Sub
Erie Terr
Erik's Ridge
Erlton
Erlton North
Escada
Escada Townvillas
Escada Villas
Escondido At Boca Raton 2
Escottonia Park
Espanola Court Condo
Espanola Heights
Espanola Villas 1st Addn
Espanola Way Villas Condo
Esperanza Farms
Esplanade At Starling
Esplanade At Tradition
Esplanade At Tradition Estate Lots
Esplanade At Tradition Phase 2
Esplanade By The Islands
Esplanade Condo
Esplanade On The New Rive
Esplanade On The New River Condo
Esprit
Esprit At Avenir
Esprit Condo
Esquire Apts Co-Op
Essenza At 1410 Euclid Co
Essex
Essex At Poinciana
Essex Court
Essex House
Essex Place
Essex Ridge
Essex South
Essex Tower
Essex Tower Condo
Essex Village
Essex Village-Third Addit
Essex/Middle River
Estada Of Los Paseos
Estancia
Estancia 04 Via Verde
Estancia At Boynton Beach
Estancia At Palm Springs
Estancia Ii Of Via Verde
Estate At Skipton Crk
Estate Homes
Estate Homes Of Wh
Estate Section
Estate/Westerly
Estates
Estates @ Shenstone Farm
Estates @ W. Amwell
Estates At Acqualina
Estates At Aisquith Farm
Estates At Bridle Ridge
Estates At Brookside
Estates At Cedar Ln
Estates At Crossroad
Estates At Elk Run
Estates At Howell Ridge
Estates At Inlet Isle
Estates At Lee's Parke
Estates At Lowes Island
Estates At Mendicino
Estates At Milton Crossing
Estates At Patapsco Park
Estates At Rocky Pen
Estates At Roseland
Estates At Sawgrass Plantation
Estates At Silver Palm
Estates At Singletree
Estates At St Anne
Estates At Stonecliff
Estates At Sunshine Ranch
Estates At Turtle Run
Estates At Tuscany
Estates At Wheatlands
Estates At Wyndham Hills
Estates Iii The
Estates Of Biscayne
Estates Of Browns Landing
Estates Of Chancellorsville
Estates Of Dove Run
Estates Of Hartwood
Estates Of Lee-Jackson
Estates Of Morris Mill
Estates Of Sawmill
Estates Of Sims Creek
Estates Of South Palm Beach
Estates Of South Palm Beach Add 1
Estates Of Swan Lake
Estates Of Trotters East
Estates Of W Amwell
Estates Of Westlake
Estates Of Wyn Lea
Estates West Amwell
Estell Manor
Estelle Park No 2
Esther Sub
Estonia Sub
Estonian Estates
Estrella Square
Ests Of Bucks C C
Ests Of Londn Brdg
Ests Princeton Junc
Estuary At Jupiter Dunes Condo
Esworthy Park
Ethereal Gardens Ii Condo
Etlan
Eton Countryside I Condo
Eton Countryside Ii Condo
Eton Hall Condo
Eton Place
Eton Square
Etruria Condo
Etters
Euclid 600 Condo
Euclid Condo
Euclid Plaza Condo
Eudora
Eureka Estates
Eureka Manor Sec 1
Eureka Palm Garden
Europa By The Sea Condo
Eutaw Forest
Eva Condo
Evans
Evans Addition
Evans Farm
Evans Meadow
Evans Mill Pond
Evans Run
Evansbrooke
Evanston Heights
Eve Estates
Even Tide
Evening Hills
Evening Star Condo
Ever April Apts Inc Co-Op
Everett
Everett Arms No 6 Condo
Everett Arms No 7 Condo
Everett Arms No 8 Condo
Everette Estates
Everglade Land Sales Co
Everglade Land Sales Co First
Everglade Land Sales Co R
Everglade Sugar & Land Co
Everglades Ave Heights
Everglades Ave Hts Addn
Everglades City
Everglades Club Condo
Everglades East Condo
Everglades Gardens
Everglades House
Everglades House Condo
Everglades Lakes
Everglades Land Co
Everglades Land Sales Co
Everglades Land Sales Co First
Everglades Of North Palm
Everglades Of North Palm Beach
Everglades Plaza Condo
Everglades Sugar & Land
Everglades Sugar & Land C
Everglades Sugar & Land Co
Evergreen
Evergreen Acres (9)
Evergreen At Port St Lucie, A Condominium
Evergreen At Putty Hill
Evergreen Condo
Evergreen Eight Of Pine I
Evergreen Estates
Evergreen Estates Plat 2
Evergreen Farm
Evergreen Farms
Evergreen Farms Subdivision
Evergreen Garden Estates
Evergreen Gardens
Evergreen Gardens Addn 2
Evergreen Hamlets
Evergreen Heights
Evergreen I Of Vills Of O
Evergreen I Of Vills Of Oriole Condo
Evergreen Ii
Evergreen Lakes Condo
Evergreen Lawn
Evergreen Mobile Home Park
Evergreen Park
Evergreen Park At Wildewood
Evergreen Village
Evergreen Woods
Evergreene
Evergrene
Evergrene Pcd 3
Evergrene Pcd 6
Evergrene Pcd 7
Everhigh Acres
Everhigh Acres/ La Deca
Everleigh
Evermay Manor
Eversfield
Everton
Everton Pud
Evian
Evinrudes Subdivision
Ewanton Hgts
Ex Hacienda Jajalpa
Excellente Village A,B,C,
Excellente Village A,B,C,D,F, & G Condo
Excelsior
Excelsior Condo
Excelsior Condominium
Exchange At Van Dorn
Exclusive Redlands
Executive Bay Club
Executive Estates
Executive Manors
Exeter
Exeter At Century Village
Exeter At Century Village Condo
Exeter Condominium
Exeter Golf Club E
Exeter Hills
Exeter Township
Exeter Twp
Exmore
Expo I Condo
Exton Grove
Exton Station
Exton Walk Towns
Extra Land Fruit Trees Lar
Extra Land Old Florida Charm
Eya Arts District
F A Barretts Sub Of W1/2
F E A Minor Plat
F E Mattingly
F Street Villa Condo
Fair Ariana
Fair Chase
Fair Haven
Fair Hill
Fair Hill Farm
Fair Hills
Fair Lakes
Fair Lakes Condo
Fair Lakes Court
Fair Lea Hills
Fair Oaks
Fair Oaks Farm
Fair Ridge
Fair Way Park
Fair Wood
Fair Woods
Fairbanks Court Condo
Fairbanks Manor Co-Op
Fairbanks North Condo
Fairbanks Terr Co-Op
Fairbanks Terrace Co-Op
Fairbanks Terrace South C
Fairbanks Terrace South Co-Op
Fairbrook
Fairchild Heights
Fairchild Manors
Fairchild Oaks
Faircrest
Faircrest Heights
Fairdale
Fairfax
Fairfax Woods
Fairfax Acres
Fairfax Brolliar Add
Fairfax Brolliar Add Sec
Fairfax Brolliar Add Sec 3
Fairfax Brolliar Add Sec 5
Fairfax Club Estates
Fairfax Condominium
Fairfax Condominium H
Fairfax County
Fairfax Hall Condo
Fairfax Heights
Fairfax Heritage
Fairfax Hills
Fairfax Homes
Fairfax Landing
Fairfax Plaza
Fairfax Plaza Townhouses
Fairfax Ridge
Fairfax Ridge Condos
Fairfax Terrace
Fairfax Village
Fairfax West
Fairfield
Fairfield (Salem Fields)
Fairfield Apts Condo
Fairfield At Boca 3 Of Ce
Fairfield At Boca 5 Of Ce
Fairfield At Long Neck
Fairfield Farms
Fairfield House
Fairfield Knolls
Fairfield Manors
Fairfield Of Boynton
Fairfield Township
Fairfields Lacuna 1
Fairfields Lacuna 3
Fairglade Park
Fairgreen 2nd Amd Pl
Fairgreen Amd Plat
Fairground Village
Fairgrounds Park
Fairhaven
Fairhaven Gardens
Fairhill
Fairhill On The Boulevrd
Fairidge
Fairknoll
Fairland
Fairland Estates
Fairland Gardens
Fairlane Harbor
Fairlawn
Fairlawn 1st Add
Fairlawn Ests 1st Addn
Fairlawn Subdivision
Fairlawn-Laurel
Fairlee
Fairless Hills
Fairlington
Fairlington Commons
Fairlington Glen
Fairlington Green
Fairlington Meadows
Fairlington Mews
Fairlington Towne
Fairlington Village
Fairlington Villages
Fairmont
Fairmont Acres Sec 3
Fairmont Condo
Fairmont Estates
Fairmont Estates Unrec
Fairmont House
Fairmont House Inc - Co-O
Fairmont House Inc - Co-Op
Fairmont Park
Fairmont Plaza
Fairmount
Fairmount Heights
Fairmount Park
Fairmount Village
Fairoaks
Fairplay
Fairpoint Meadow
Fairport
Fairton
Fairton Oaks
Fairview
Fairview Acres
Fairview Amended Plat
Fairview At Pembroke Poin
Fairview Court
Fairview Estates
Fairview House Condo
Fairview Ii And Iii Condo
Fairview Iv Condo
Fairview Manor
Fairview Of Atlantis
Fairview Of Calf Cl Condo
Fairview Park
Fairview Park Ii
Fairview Pines
Fairview Pointe
Fairview Ridge
Fairview Square
Fairview Subdivision
Fairview Twp
Fairview Villas Condo
Fairview Vista Condo Ph 1
Fairway
Fairway Apartments Condo In Mariner Sands
Fairway Club Condo
Fairway Cove
Fairway Estate
Fairway Estates
Fairway Estates Sec 7
Fairway Estates Sec Four
Fairway Ests Sec Five
Fairway Falls
Fairway Greens Condo Home
Fairway Hills
Fairway Island
Fairway Isle
Fairway Isles Replat
Fairway Lake
Fairway Lake South Sec 2
Fairway Manor
Fairway Manor Estates
Fairway Oaks At Boca West
Fairway Palms Condo
Fairway Park Condo
Fairway Park Sec 1
Fairway Park Sec 3
Fairway Pines 4th Addn
Fairway Plaza
Fairway Point
Fairway Point Condo
Fairway South Co-Op
Fairway Village
Fairway Villages At Chesapeake Bay Golf Club
Fairway Villas
Fairway Villas At Pga National
Fairway Villas Condo Irp
Fairways
Fairways At Boca Golf & Tennis Condo
Fairways At Bonaventure C
Fairways At Bonaventure Condo
Fairways At Brooksid
Fairways At Grand Harbor
Fairways At Greencastle Greens
Fairways At Odessa N
Fairways At Savanna Club
Fairways At Savanna Club Replat No 1
Fairways At Somerset Condo
Fairways At Turf Valley
Fairways At Walden
Fairways Co-Op
Fairways Condo
Fairways Estates
Fairways North
Fairways North Co-Op
Fairways Of Boca Lago
Fairways Of Boca Lago Con
Fairways Of Boca Lago Condo
Fairways Of Coral Springs
Fairways Of Stonecrest
Fairways Of Sunrise
Fairways Of Tamarac
Fairways Of Tamarac Condo
Fairways Of Tamarac Condominium
Fairways Riviera
Fairways Riviera Condo
Fairways Riviera North Co
Fairways Riviera North Condo
Fairways Riviera Views
Fairways Royale Condo
Fairways South
Fairwind Farms
Fairwinds
Fairwinds Cove
Fairwinds Cove 03 Condo
Fairwinds Cove Condo
Fairwinds Of Annapolis
Fairwinds On Severn
Fairwood
Fairwood Office Park
Fairwood-Phase 2-Plat 10
Faith Baptist Church
Falcon Crest
Falcon Ridge
Falcon Sub No One
Falcon Trace Plat Four
Falcon Trace Unit 9
Falconhurst
Falcons Glen
Falconwood
Fallbrooke
Fallen Timbers
Falling Creek Farms
Falling Spring Estates
Falling Spring Meadows
Fallowfield East
Falls At Parkland
Falls At Saw Creek
Falls Church
Falls Church City
Falls Church Park
Falls Crest
Falls Gable
Falls Grove Condominium
Falls Hill
Falls Of Inverrary
Falls Of Inverrrary
Falls Of Jensen Beach
Falls Of Portofino
Falls Plaza
Falls Road Corridor
Falls Run
Falls Station
Fallsberry
Fallsgrove
Fallsmead
Fallsreach
Fallstaff
Fallston Commons
Fallston Crossing
Fallstone
Fallswood
Falmouth
Falmouth At Century Villa
Falmouth At Century Village
Falmouth-Century Village
Family Townhouses Of The
Family Townhouses Of The Lakes
Fannett Metal
Fannettsburg
Fanshaw At Century Villag
Fanshaw At Century Village
Fanshaw At Century Village Condo
Fanshaw Century Village
Fantasy One
Fantasy Reef
Fantasy Valley Ph Ix-A
Fantasyworld Club Villas U
Farberville Sub
Farm
Farm Crest
Farm Lane Estates
Farm On Quarry Road
Farm View
Farmbrook
Farmbrooke Meadows
Farmers Acres
Farmingdale
Farmingdale Estates
Farmington
Farmington Estates
Farmington Heights
Farmington On The Green
Farmington Village
Farmington Woods
Farmlands
Farmlane Estates
Farms At Hunting Creek
Farmstead District
Farmwell Hunt
Farnerville
Farnham
Farnham A Condo
Farnham H Condo
Farnham I Condo
Farnham M Condo
Farnham O Condo
Farquhar Estates
Farquhar Park
Farrcroft
Farrell Estates Wellington
Farrington Lakes Sec
Faulkland Heights
Faulkner Park
Faulkner Park Sec 3
Fauquier Springs Country Club
Fawcett Farms
Fawn Lake
Fawn Lake Village
Fawn Lakes
Fawn Meadow
Fawn Meadows At Deer Creek Ph 1
Fawn Ridge Estates
Fawn Twp
Fawnwood
Fayette Court
Fayetteville
Fayfield
Fazenda Monte Alto Ii
Fb Millers
Feasterville
Feasterville Hgts
Featherstone Industrial Park
Featherstone Ridge
Featherstone Shores
Feathertree
Fec Addn To Hialeah
Fechter
Federal Gardens 1
Federal Hill
Federal Hill Historic District
Federal Oak Estates
Federal Park
Federal Village
Federal Way Amd
Federalsburg
Fee & May's Resubdivision
Felicita
Felicity Cove
Felicity Manors
Felicity Mnr 1st Addn
Felix Park Home Acres
Feller Estates
Fellowship Forest
Fells Point Historic District
Fellsmere Farms
Fellsmere Farms Co S/D Of
Fellsmere Farms Co S/D Of Unsurveyed Twp 31 Rng 37
Felton
Felton-Laurel
Feltonville
Fenwick Farms
Fenwick Park
Fenwick Shoals
Fenwick Town Village
Fenwick West
Fenwick Woods
Fergus St Lot 1 Blk 1746
Fern Gardens Condo
Fern Hill
Fern Isle Gardens Condo
Fern Lane
Fern Ridge
Fern Rock
Fern Sub No One
Fernandos Place
Fernbank
Fernbrook
Fernbrooke
Ferndale
Ferndale Farms
Ferndale Heights
Fernglen Manor
Fernhook
Fernshire Farms
Fernwalk
Fernwood
Fernwood Forest
Fernwood Hills
Fernwood Mhp
Fernwood Park
Fernwood Terrace
Fernwoods Condo No 1
Ferry Dock Crossing
Ferry Farms
Ferry Farms Estates
Ferry Neck
Fick
Ficus Gardens Condo
Fieldbrook
Fieldbrook Estates
Fieldcrest
Fields At Gulfstream Polo
Fields At Gulfstream Polo Pud
Fields At Gulfstream Polo Pud Plat Six
Fields At Gulfstream Polo Pud Plat Six Replat
Fields At Magnolia
Fields At Rock Glenn
Fields Of Nottingham
Fieldside At St Charles
Fieldstone
Fieldstone At River Hill
Fieldstone Farm
Fieldstone Place
Fieldstone Preserve
Fieldstone Ranch Sub Phase 1
Fieldwood
Fiesta
Fife Estate
Fifeville
Fifith Moorings Condo
Fifth Addition To Amended
Fifth Addition To Richmon
Fifth Avenue Place
Fifth Avenue Townhomes
Fifth Horizons Condo
Fifth Moorings Condo
Fifth Morning
Fifty Six-Sixty Collins A
Fiji Condo No 1
Fiji Condo No 2
Fiji Condo No 3
File
Fillmore Condominium Apts
Fillmore Village
Finca Alajuela
Finca Calima Darien
Finca El Ensueno
Finca Los Olivos
Findlay Park
Finn Court Condo
Fiore At The Gardens Condo
Fireside
Fireside Park
Fireside Terrace
First Add To Tuskegee Par
First Addition
First Addition To Port Cha
First Addn Pasadena Pk
First Addn To Calusa Club
First Addn To Highland Ga
First Addn To Palm Spring
First Art Nouveau Condo
First Baptist Church At
First Century Subdivision
First Deco Condo
First Encounter Condo
First Fairway Condo
First Forum Condo
First Gulfstream Garden
First On 8th Condo
First On Penn Condo
First Replat Of Portofino
First Replat Of Portofino Isles
First Replat Of River Point Pud
First Woodbrooke Cm
Fischer Greens
Fischer Lake Island Sub
Fischer's Grant
Fishback
Fisheating Bay Condo
Fisher Island
Fisher Mountain Estates
Fisher Mountain Golf Club & Resort
Fisher Mountain Golf Course
Fisherman's Cove
Fishermans Cove
Fishermans Cove (Aka Somerset)
Fishermans Haven
Fishermans Hideaway
Fishermans Hideaway Sec 03
Fishermans Landing Add
Fishermans Village
Fishermill Park
Fishers Cove
Fishers Point
Fishing Creek
Fishing Creek Estates
Fishing Creek Farm
Fishing Creek/Hoopers Island
Fishing Lodge
Fishtown
Fiske Manor
Fitler Square
Fitz At Rockville Town C
Fitzhugh's Bluff
Five Forks Village South
Five Oaks
Five Park
Five Park Condo
Five Park Miami Beach
Fl City Highlands
Fl Development Co. Subdivi
Fla City Realty Co Subdiv
Fla Coast Line Canal And Trans Company
Fla Fruit Land Co
Fla Fruit Land Co Sub
Fla Fruit Land Co Sub No 2
Fla Fruit Land Cos Sub
Fla Fruit Lands
Fla Fruit Lands Co
Fla Fruit Lands Co Sub 1
Fla Fruit Lands Co Sub No
Fla Fruit Lands Co Sub No 1
Fla Fruit Lands Co Sub No 2
Fla Mango Estates As
Flagami 2nd Addn
Flagami 3 Addn
Flagami 3rd Addn
Flagami Sec A
Flagler Beach
Flagler Court Heights
Flagler Estates
Flagler Estates Unplatted
Flagler First
Flagler First Condo
Flagler Gardens
Flagler Grove Estates Ext
Flagler Groves Estates Se
Flagler Heights
Flagler Landing Condo
Flagler Lawn
Flagler Mnr
Flagler Plaza Condo
Flagler Pointe Condo
Flagler Sun Homes
Flagler Village
Flagtown
Flair Sub 8 70-5 B
Flair Sub No 2
Flair Sub No 3
Flair Sub No 5
Flair Sub No Seven
Flair Sub No Six
Flair Subdivision No 1
Flair Subdivision No 4
Flamango Park
Flamenco
Flamenco Condo
Flamenco Condo Tower I
Flamenco Condo Tower Ii
Flamenco Condo-Tower I
Flamenco Condo-Tower Ii
Flaming Waters Country Club Blk 12
Flamingo Court Condo
Flamingo Estates
Flamingo Estates 1st Addn
Flamingo Gardens Phase 3
Flamingo Gardens Phase Fo
Flamingo Gardens-Black Ol
Flamingo Gardens-Phase Tw
Flamingo Gardens-Phase Two
Flamingo Gardens-Tamarind
Flamingo Groves
Flamingo Island Est Amd P
Flamingo Lake
Flamingo Park
Flamingo Park Sec
Flamingo Ranch Estates
Flamingo Ranches
Flamingo South Beach
Flamingo South Beach I Co
Flamingo Terrace Extensio
Flamingo Terrace Sub
Flamingo Towers Condo
Flamingo Village
Flamingo Village 176-177 B Por
Flamingo Village 1st Add
Flamingo Wave Condo
Flat Woods
Flats At Coastal Station
Flats At Metrowest
Flavor Pict Townhomes Pud Replat
Fleeman Estates
Fleeman Heights
Fleet Street
Fleet Street Condominiums
Fleeton Beach
Fleetside
Fleetwing
Fleetwood
Fleetwood Estates
Fleetwood Farms
Fleetwood Gardens Sec 1
Fleetwood Manor
Fleming Grant
Fletcher
Fletcher Drive
Fletcher's Grove
Fleur De Lis Condo
Flint Hill
Flint Hill Manor
Flint Hill Station
Flint Ledge Estates
Flintridge
Flora Vista
Flora-Del-Rio
Flora-Del-Rio Sub
Floral Gardens
Floral Heights
Floral Lakes
Floral Lakes 2
Floral Lakes Ph 3 And 4
Floral Park
Floral Park 1st Amd Pl
Floral Park Lantana
Floral Park Rev Plat
Floral Pk
Floral Pk 1st Amd
Floral Ridge Addition
Floranada Center
Floranada Condo
Floranada Ridge
Floranada Ridge Sec
Floranada Ridge Sec A 30-
Florawood Country Es
Floree
Florence At Crystal Lakes
Florence Heights
Florence Meadows
Florence Second Addition
Florence Tollgate
Florence Villas
Florencia Estates
Floresta
Floresta Estates
Floresta Grove
Florian Isles
Florian Isles 2nd Sec
Floriana Park
Floribunda
Floribunda Heights
Florida 2001 Condo
Florida 2001 Condo Ph I
Florida City Estates
Florida City Park Rev
Florida City Pines
Florida City Proper
Florida City Pud
Florida Club
Florida Coast Line Canal & Transit Company
Florida Development Co
Florida Fruit Land Compan
Florida Fruit Land In Sec
Florida Fruit Lands
Florida Gardens 4
Florida Highland Grove
Florida Highlands
Florida Indian River Land Co.
Florida Ocean Club Condo
Florida Park
Florida Residential Centers
Florida Ridge Subdivision
Florida Shores 01
Florida Towers Condo
Florida Tropical Estates
Florida Tung Oil Sub No. 1
Floridana Beach 1st Addn
Floridana Beach 4th Add
Floridays Resort
Floridian Arms Condo
Floridian Bay Estates Sou
Floridian Golf Club
Floridian Isles
Floridian Isles South
Florimond Manor
Florin Hill
Flourtown
Flow House
Flow Residences
Flower Hill
Flower Valley
Flower Village
Flowers Mill
Floyd Gove Estate
Flozella Gardens
Flying Dutchman Estates Phase
Flying Hills
Flythe Property
Focsa Condo
Foggy Bottom
Folcroft
Folkstone
Folly Quarter
Folsom
Folsom Boro
Font Hill
Fontainbleau Gdns
Fontainbleau Lakes Courty
Fontaine Subdivision
Fontainebleau Estates
Fontainebleau Gardens
Fontainebleau Gardens 1st
Fontainebleau Gardens Con
Fontainebleau Gardens Condo
Fontainebleau Ii Condo
Fontainebleau Ii Tresor
Fontainebleau Iii
Fontainebleau Iii Ocean C
Fontainebleau Iii Sorrento
Fontainebleau Park West V
Fontainebleau West North
Fontana Condo
Fontana Townhomes
Foothills Of Kensington
Forcynthia Woods
Ford's Colony
Fordham Condo
Fords Colony
Fore Acres First Add
Forecast Sub
Forest Brooke
Forest Brooke Active Adult Ph 6a And 7
Forest Condo
Forest Cove
Forest Creek
Forest Edge
Forest Estates
Forest Gate
Forest Glen
Forest Glen Knolls
Forest Glen Pinewo
Forest Glenn
Forest Green
Forest Green Condo
Forest Greens
Forest Heights
Forest Hgts 18
Forest Hill
Forest Hill Gardens
Forest Hill Gardens Condo
Forest Hill Park
Forest Hill Village
Forest Hill Village 2
Forest Hill Village 4
Forest Hills
Forest Hills Condo North
Forest Hills Condo South
Forest Hills Estates
Forest Hills Park
Forest Hills South
Forest Hills Subdivision
Forest Hills Unrec
Forest Hills West
Forest Homes 4
Forest Knoll
Forest Knolls
Forest Lake North
Forest Lake Phase 2
Forest Lake Sub Unit 1
Forest Lakes
Forest Lakes Country Gard
Forest Lakes Estates Sec
Forest Lakes Gardens Sec
Forest Lakes Villas
Forest Landing
Forest Landing - Ellendale
Forest Oaks
Forest Oaks Pt
Forest Oaks Residential Pud
Forest Park
Forest Park 1st Addn
Forest Park Condo
Forest Park Mobile Home
Forest Park Villas
Forest Reach
Forest Ridge
Forest Ridge Cluster Home
Forest Ridge Cluster Homes Ii
Forest Ridge Park
Forest Ridge Single Famil
Forest Ridge Single Family Vii
Forest Ridge The Hollow
Forest Run
Forest Run-Great Mills
Forest Spring
Forest View
Forest View Estates
Forest Villa Woods
Forest Villas Townhomes
Forest Walk
Forestgate
Forestville
Forestville Center
Forestville Meadows
Forestville Park
Forever Elegant Condo
Forevergreen Farms
Forge Acres
Forge Landing
Forge Road Acres
Forgotten Bottom
Fork Landing West
Fork River
Fork/Baldwin
Forked River
Forked River - Barnegat Pines
Forked River - Forked River Beach
Forked River - Parkers Point
Forked River - Riviera
Forked River - Sunrise Beach
Forks Township
Forman Addition
Forrest Farm
Forrest Homesites
Forsgate
Forsyth Park Condo
Forsythia Gate
Fort Barnard Heights
Fort Denaud Acres
Fort Drum
Fort Dupont Park
Fort Ellsworth
Fort Foote Village
Fort Howard
Fort Hunt
Fort Knox Ests
Fort Lauderdale
Fort Lauderdale Beach
Fort Lauderdale Residence
Fort Lauderdale Residences Condo
Fort Lauderdale Truck Far
Fort Lauderdale Yacht
Fort Lincoln
Fort Loudon
Fort Lyon Heights
Fort Mccoy Campsites Unit1
Fort Moosa Gardens
Fort Mott Village
Fort Myers
Fort Myers Beach
Fort Myers Fl
Fort Myers Shores
Fort Pierce
Fort Pierce Gardens
Fort Pierce Shores Unit 1
Fort Pierce Shores Unit 3
Fort Pierce Shores Unit 4
Fort Pierce Shores Unit 4 Replat
Fort Pierce Shores Unit 5 Replat
Fort Pierce Sub
Fort Pierce Subdivision
Fort Stover
Fort Totten
Fort Washington
Fort Washington Acres-Pl
Fort Washington Estates
Fort Washington Forest
Fort Williams Park
Forte
Forte Dei Marmi
Forte Luxe
Forte On Flagler
Forte Residences Condo
Forte Residences, A Condominium
Fortescue
Fortescue Park
Fortnightly Square
Fortuna
Fortuna Crossing
Fortune House Condo
Fortunes Landing
Forty Acres
Forty Nine Pines
Forty Six Hundred
Forward Sub No 1
Foster Creek
Foster Homesites
Foster Park
Foster's Glen
Foster's Subdivision
Fosters Mill
Founders Landing
Founders Walk
Foundry Lofts
Foundry Lofts Condo
Fountain
Fountain Farms
Fountain Glen
Fountain Green
Fountain Green Heights
Fountain Head
Fountain Head Manor
Fountain Hill
Fountain Hills
Fountain House
Fountain Pk Village Homes
Fountain Pointe
Fountain Springs
Fountain Towers Condo
Fountaindale
Fountaindale North
Fountaindale South
Fountainhead Condo
Fountainhead Garden Villas & Penthouses Phase 3
Fountainhead Garden Villas & Penthouses Phase Two
Fountainhead Ii
Fountains
Fountains At Heritage
Fountains At Mclean
Fountains At Palm Beach
Fountains Of Jacaranda
Fountains Of Jacaranda Co
Fountains Of Palm Beach
Fountains Of Palm Beach C
Fountains Of Palm Beach Condo 1
Fountains Of Palm Beach Condo 2
Fountains Of Palm Beach Condo 3
Fountains Of Palm Beach Condo 4
Fountains Of Palm Beach Condo 5
Fountains Of Palm Beach Condo 7
Fountains Of Palm Beach Condo 8
Fountains Of Palm Beach Condo 9
Fountains Of Palm Beach Condo No 9 (Plaza Court)
Fountains Of Tamarac Cond
Fountains On Ocean Boulevard
Fountains San Marino
Fountains South Condo 2
Fountains South Condo 3a
Fountains South Condo 3b
Fountains South Condo 3c
Fountains South Tr B-3-2
Fountainview At Spring Lks Condo
Fountainview Condo
Fountainview Condo No 2
Fountainview Condo No 4
Fountainville Hill
Fouquet's
Four Ambassadors
Four Ambassadors Condo
Four Ambassadors Condo Ph
Four By Four
Four Corners
Four Lakes Community
Four Lakes Sec 1
Four Lakes Sec 7
Four Little Acres Park
Four Midtown
Four Midtown Miami Condo
Four Rivers
Four Sea Suns Condo
Four Season
Four Seasons
Four Seasons / Tivoli Isles
Four Seasons At Baymont Farms
Four Seasons At Easton
Four Seasons At Harbor Bay
Four Seasons At Hatteras Hills
Four Seasons At Kent Island
Four Seasons At Mill
Four Seasons At Mirage
Four Seasons At Pennfield
Four Seasons At Scenic Harbor
Four Seasons At Sea Oaks
Four Seasons At Silver Maple
Four Seasons At Weat
Four Seasons At Wylder
Four Seasons Brickell
Four Seasons Condo
Four Seasons Estates
Four Seasons In Historic Virginia
Four Seasons Mhp
Four Seasons Private Residences
Four Seasons Residences
Four Seasons Resort Nevis
Four Seasons/Tivoli Isles
Four Seasons@S.Knoll
Four Way Lodge
Four Way Manor
Four Winds At Oakton
Four Winds Condo
Four Winds Farm
Four Winds On The River Condo
Four-Way Lodge Estates
Fourth Replat Of Portofino Isles
Fourth Add To Sunrise Gol
Fourth Forum Condominium
Fourth Gulfstream Garden
Fourth Horizons Condo
Fourth Miramar Condo
Fourth Moorings Condo
Fourth Rep Of Portofino Isles
Fourth Replat Of Portofino Isles
Fourwinds
Foust Sub
Fowler S Sub Lt
Fowlers Sub
Fowlers Sub In
Fox Bend
Fox Bow
Fox Brook
Fox Chapel
Fox Chapel At Tudor Knolls
Fox Chase
Fox Chase Condo #2
Fox Creek
Fox Creek Estates
Fox Den Estates
Fox Field Farms
Fox Glen
Fox Glen Equestrian Estates
Fox Grape Farms
Fox Grove
Fox Grove (Aka Meadow Run)
Fox Groves Farms
Fox Haven
Fox Haven Estates
Fox Heath
Fox Hill
Fox Hill Estates
Fox Hill Estates Of Boca
Fox Hill Estates Of Boca Raton
Fox Hill Farm
Fox Hills
Fox Hollow
Fox Hunt
Fox Hunt Estates
Fox Lake
Fox Landing
Fox Mdws
Fox Meadow Section 1
Fox Meadows
Fox Meadows Annex
Fox Mill
Fox Mill Estates
Fox Mill Station
Fox Point
Fox Pt
Fox Ridge
Fox Ridge Manor
Fox Run
Fox Run Condos
Fox Run Estates
Fox Tower Knolls
Fox Trail
Fox Valley
Fox Wood Phase Five
Foxberry
Foxborough
Foxborough Farms
Foxbrook Forest
Foxchase
Foxchase Plat 12
Foxcroft
Foxcroft Apts Inc Condo
Foxcroft Colony
Foxcroft Colony Condos
Foxcroft Heights
Foxcroft Homes Phase Ii
Foxcroft Of Blue B
Foxcross In Mariner Sands Country Club
Foxe Chase
Foxe Chase Pb38p1&2
Foxfield
Foxfield At Middletown
Foxglove Co-Op
Foxhall
Foxhall Of Mclean
Foxhall Village
Foxhaven
Foxhill At Belair
Foxhole Estates
Foxlair Acres
Foxleigh Meadows
Foxmont
Foxmoor
Foxridge
Foxtail Creek
Foxvale
Foxvale Farm
Foxwell Condominiums
Foxwood
Foxwood Farms
Foxwood Hollow At Coral Springs
Foxwood Knolls
Foxwood Ridge
Foxwood Village
Fra-Mar Ranches
Frackville
Frambach Subdivision
Fran-Del
Frances Condo Apts
Frances Pk
Frances Terrace Condo
Francisville
Franconia
Franconia Commons
Franconia Hunt
Franjo Park Sec 1
Franjo Park Sec 2
Frank C Dickey Sub 11-8 B
Frankford
Franklin
Franklin County
Franklin Election District
Franklin Farm
Franklin Forest
Franklin Glen
Franklin Green
Franklin Hollow
Franklin Knolls
Franklin Manor Beach
Franklin Manor On The Bay
Franklin Meeting
Franklin Mews
Franklin Oaks
Franklin Park
Franklin Park Addition
Franklin Park Amended
Franklin Park Subdivision
Franklin Property
Franklin Square
Franklin Square Historic District
Franklin Station
Franklin Twp
Franklin Wood At Heritage Ridge
Franklin Woods
Franklintown Borough
Franklintown Historic District
Franklintown Road
Franklinville
Franwood Pines
Fraser Beach
Fraser Road Sub
Frazee Estates
Frazers Landing
Frazier Woods
Fread S Addition No 3
Fread S Second Addn To Hm
Freads Addn No 3
Fred Bishop
Fred E Unger
Frederica
Frederick Co.
Frederick County
Frederick Courts
Frederick Heights
Fredericksburg
Fredericksburg Business Park
Fredericksburg City
Fredericktown Es
Fredericktowne
Fredericktowne Estates
Fredericktowne Townhouse
Fredericktowne Village
Freedom Crossing
Freedom Forest
Freedom Hills
Freedom Manor
Freedom Square
Freedom Square Condo
Freedom Township
Freehold
Freehold Township
Freehold Twp
Freeland
Freeland Square
Freeland/Parkton
Freestone Village
Freezeland Manor
Fremont Hills
French Creek Manor
French Creek Townh
French Quarter
French Quarter Condominiu
French Quarter Condominium
French Quarter Phase 2
French Royale Villas
French Village Condo
French Villas Condo
Frenchman's Harbor
Frenchmans Creek
Frenchmans Creek Par B
Frenchmans Creek Par C-2
Frenchmans Creek Par E-5
Frenchmans Creek Par F-1
Frenchmans Creek Par G-4
Frenchmans Harbor
Frenchmans Reserve
Frenchmans Reserve Pcd A
Frenchmans Reserve Pcd B
Frenchmans Reserve Pcd D
Frenchmans Reserve Pcd E
Frenchmans Reserve Pcd F
Frenchmans Reserve Pcd G
Frenchmans Reserve Pod C
Frenchmens Landing
Frenchmens Landing 1
Frenchmens Landing 3
Frenchmens Landing Plat 3
Frenchquarter Condominium
Frenchs Neck East
Frenchs Park
Frenchtown Crossing
Frenchtown Woods
Freshwater 11th & 12th Ave Add
Freshwater Add To Wpb
Freshwater Estates
Frey Sophia Add To Delray
Friday Creek Estates
Frieden Manor
Friedensburg
Friedland Manor
Friedman & Copes Sub
Friendly Acres
Friendly Corner Condo
Friendly Village
Friendship Creek
Friendship Estates
Friendship Gardens
Friendship Heights
Friendship Park
Friendsville
Fries Mill Estates
Fritz Meadow
Frog Hollow Meadow
Frogtown
Front Royal & Riverton Improvement Co.
Frost Park
Frost Sub Plat 1>
Frost Sub Plat 3
Frow Homestead
Fruitland Park
Ft Dupont Park
Ft Fanning Plant
Ft Laud Surf Club Co-Op
Ft Lauderdale B-40
Ft Lauderdale Estates
Ft Lauderdale Land & Dev Co
Ft Pierce Beach Subdivisi
Ft Pierce S/D
Ft Thence Run
Ft. Drum
Fulford By Sea
Fulford By Sea Sec A
Fulford By Sea Sec B
Fulford By Sea Sec E
Fulford By Sea Sec L
Fulford By Sea Sec N
Fulford By Sea Sec O
Fulford By The Sea
Fulford By The Sea Rev Pl
Fulford By The Sea Sec C
Fulford By The Sea Sec D
Fulford By The Sea Sec H
Fulford By The Sea Sec I
Fulford By The Sea Sec J
Fulford By The Sea Sec P
Fulford By The Sea Sec U
Fulford Heights
Fulford Highlands 1st Add
Fulford Highlands 2 Addn
Fulford Highlands 3 Addn
Fulford Highlands Second
Fulford Highlands Second Addition
Fulford Homes
Fulfordale
Fulfordale Addn No 1 Sec
Fulks Run
Fullerton
Fullerton Heights
Fulton
Fulton Hill
Fulton Hills
Fulton Manor
Fulton Mansion Add
Funkhouser
Funkstown
Furnace Hill
Furnace Hills
Furnace Knoll
Furnace Mountain
Futura Villas No 3 Condo
Fvp
Fvp Subdivision
G B Estates
G B Resort Condo Hotel
G W Moodys Subdivision
G&G Communities
Gabel Sub No 4
Gable Arms Condo
Gable Park Woods
Gables At Gunston
Gables At Northlake 1
Gables By The Sea
Gables Court Condo
Gables Court Townhomes Co
Gables East Of Boca Barwood
Gables Edge Condo
Gables Estates No 2
Gables Estates No 3
Gables Laroc Condo
Gables Manor Sub
Gables Marquis Condo
Gables Of Tuckerman
Gables Park Tower
Gables Plaza Condo
Gables Point Condo I
Gables Point Iii Condo
Gables South Condo
Gables Terrace Condo
Gables View (Miami-Dade)
Gables View Condo
Gables Waterway Towers Co
Gables Waterway Townhomes
Gabriel Towers Condo
Gabriels Run-Plat 1>
Gafia Estates At Lake John
Gaia Residences
Gaines Estate
Gaines Subd
Gaither Sideling
Gaithersburg
Gaithersburg Outside
Gaithersburg Town
Gale
Gale / Natiivo
Gale / Nativo
Gale Condo Hotel And Resid
Gale Hotel And Residences
Gale Lake Worth 1 Reamnded
Gale Miami
Gale Miami Resindences
Gale Residence4s
Gale Residences
Gale Residences & Hotel
Gale Residences / Natiivo
Gale Sub
Gale/ Natiivo
Galen Drive Condo Apts
Galen Hall Condo
Galena
Galestown
Galesville
Gallahan
Gallahan Estates
Gallant Green Woods
Gallatin Woods
Galleon Condo
Galleria Lofts Condo
Galleria Villages
Galleria Villages 2
Gallery Art Condo
Gallery At White Flint
Gallery One
Gallery One By Hilton
Gallery One Condo
Gallery Park
Gallery Row
Gallician Gardens
Gallo-Wood Estates
Galloway
Galloway Twp
Galt Ocean Club
Galt Ocean Club Condo
Galt Ocean Terrace
Galt Ocean Terrace Condo
Galt Towers
Galt Towers Condo
Galyn Manor
Gambach Sub
Gambrill Glenn
Gambrill Heights
Gambrill View
Gambrills
Gambrills Farm One
Gambrills Vincent Farm
Gander Woods
Gandy' S Beach
Gandy's Beach
Gannon Range
Gap
Gap View Village
Gapgalleon
Gar-Mon Sub
Garages At Harbour Cay Condominium
Garden Aire Village
Garden Aire Village Sea Haven
Garden At Mcdonogh
Garden City
Garden City Farms
Garden City Farms Resubdivision Tract 113
Garden Club
Garden Court
Garden Cove Estates
Garden Estates
Garden Estates At The Ham
Garden Grove Prd-Phase Ii
Garden Grove Prd-Phase Iii
Garden Hill At Providence
Garden Hills Unit Three
Garden Hills Unit Two
Garden Hills West
Garden In The Grove Condo
Garden Isle 2
Garden Isle Villas Condo
Garden Isles
Garden Isles #4 Co-Op Uni
Garden Isles 2
Garden Isles 2 Co-Op
Garden Isles 3
Garden Isles Apartments 1
Garden Isles Apartments 1 Condo
Garden Isles Sec 2
Garden Isles Sec 2 49-6 B
Garden Isles Sec 3
Garden Isles Sec 4
Garden Isles Sec 5
Garden Isles Sec 7
Garden Isles Sec 8
Garden Isles Sec One
Garden Lake
Garden Lake Towers Condo
Garden Lakes
Garden Lakes & Garden Square Shops
Garden Lakes And Garden Square Shops
Garden Lakes Of Inverrary
Garden Mnr
Garden Oaks 1
Garden Oaks South
Garden Oaks West
Garden Of Eden Sub
Garden Of Kendall Condo N
Garden On The Bay
Garden Patio Villas
Garden Residences At Cityplace Condo
Garden State Park
Garden Sub Amd Pl
Garden Terrace Apts No 10
Garden View Villas Homes
Garden Villas Condo
Garden Villas Condo Ii
Garden Villas Of Gator Trace
Garden Villas Of Gator Trace Unit Ii
Garden-Aire Village
Garden-Aire Village Condo
Garden-Aire Village Sea Haven
Garden-Aire Village South
Gardendale
Gardengate Ii Condo
Gardenia Isles
Gardenia Park
Gardenia Terrace Condo
Gardens
Gardens 1 Condo
Gardens 2 Condo
Gardens 3 Condo
Gardens 4 Condo
Gardens At Bonaventure 11
Gardens At Bonaventure 11 West
Gardens At Bonaventure 14
Gardens At Lake Jackson Ridge The Phase 3
Gardens At Lauderhill
Gardens At Lauderhill Con
Gardens At Lauderhill Condo
Gardens At Owings Mills
Gardens At Pembroke Lakes
Gardens At Poppleton Creek Condo
Gardens At Waterstone Phase 1
Gardens At Waterstone Phase 2
Gardens At Waterstone Phase 3a
Gardens By The Sea Condo
Gardens By The Sea South
Gardens By The Sea South Condo
Gardens Condo
Gardens North
Gardens North 4 Condo
Gardens North Eleven Condo
Gardens North Five Condo
Gardens North Six Condo
Gardens Of El Jardin Sec
Gardens Of Guilford
Gardens Of Homestead Repl
Gardens Of Kendall Condo
Gardens Of Kendall So Con
Gardens Of Kendall South
Gardens Of Sabal Palms
Gardens Of St Lucie
Gardens Of Sunrise Condo
Gardens Of Sweetwater Condos
Gardens Of Willow Bend Condos
Gardens Of Willow Bend Ii
Gardens Of Willow Bend Ii Cond
Gardens On The Bay
Gardens The
Gardenview
Gardenview Terrace
Gardenville
Gardenville Center
Gardenway Condo
Gardner Property
Gardners Basin
Garfield
Garfield At Century Villa
Garfield Century Village
Garfield East
Garfield North
Garfield Park
Garland
Garland Lake
Garland Park
Garner Estates
Garnet Condo
Garnet Valley Woods
Garnett's Mill
Garrett Forest
Garrett Highway
Garrett Park
Garrett Park Estates
Garrettford
Garretts Chance
Garrison
Garrison Bight Marina
Garrison Estates
Garrison Lake
Garrison Lake Gree
Garrison Ridge
Garrison Woods
Garrisons Lake
Garrisonville
Garvey Gardens
Garwyn Oaks
Gary Dale Unrec On
Gaso Condo
Gate One Condo
Gate Post Estates
Gate Three Condo
Gate Two Condo
Gateland Village
Gateland Village Sec D Co
Gateland Village Sec D Condo
Gates Mill
Gates Of Fair Lakes
Gates Of Mclean
Gatestone
Gatewater Landing
Gateway
Gateway Apts Condo
Gateway Commons
Gateway Estates Park Cond
Gateway Gardens
Gateway Mountain
Gateway Park Amended
Gateway To The Grove Cond
Gateway To The Grove Condo
Gateway West
Gateway West Condo
Gatewood Park Manor
Gatewood Village
Gatherings At Bel Ai
Gatherings At Forest Glen
Gatherings At Jefferson Place
Gatherings At Lawren
Gatherings At Potomac Station
Gatherpoint
Gatlin Acres
Gator Circle
Gator Trace Condominium 1
Gator Trace Subdivision
Gavea
Gaver Meadows
Gay Street
Gaylawn
Gdns Of Key Bisc-Alhambra
Geary Long
Gedeon Sub
Gedney Vs Pierson
Gedney Vs Pierson Chancery # 8802
Geigers Victor L
Geigers Victor L 2nd Add
Gellers Subdivision
Gem Cove Condominium
Gem Homes No Three
Gem Homes No Two
Gemini Condo
Gemini South Condo
General Parker Shores
General Pointe
General Warren Vil
Generals Greene
Generation
Genesis At The Landings
Genesis Sub
Genezer Estates
Gentile Land
Gentry Estates
Geo M Phippens Sub In
George Eldridge Property
George J Bradbury
George Mason Village
George Town
Georgeland Village
Georges Park
Georgetown
Georgetown Village
Georgetown At Eagle Trace
Georgetown At Heritage Ridge
Georgetown Condo
Georgetown Houses
Georgetown Manor
Georgetown Manor Estates
Georgetown Mews
Georgetown Park
Georgetown Pike
Georgetown South
Georgetown West
Georgian Colonies
Georgian Court
Georgian Court Apts Co-Op
Georgian Court Apts North Co-Op
Georgian Court North
Georgian Courts At Wellington
Georgian Courts North
Georgian Hamlet
Georgian Park
Georgian Terrace
Georgianna
Gerald Estates
Gerald Glotfelty
Geranium Gardens Condo
Gerard Plaza
Gerber Groves
Gerber Groves S/D Sec Two
Germania Gdns
Germanna Heights
Germansville
Germantown
Germantown (East)
Germantown (Swest)
Germantown (West)
Germantown Estates
Germantown Park
Germantown Station
Germantown View
Germany Hill
Germinal Colony
Gerrard Acres
Gerst Farm
Getseman
Getsemani
Gettsyburg
Gettyburg Boro
Gettysburg
Gettysburg Area
Gettysburg Battlefield
Gettysburg Borough
Gettysburg Camping & Hunting Club
Gettysburg College
Gettysburg, Pa
Gettysburg- Rt. 30
Giardino Village Condos
Gibbs Oakwood
Gibbs Sub
Gibsons Grant
Giffen Manors
Gifford Area/West Of Us1
Gifford Area/West Of Us1 (010150.00)
Gifford Area/West Of Us1 (720150.00)
Gifford Estate Contd
Gifford School Park Sub
Gilbert Acres
Gilbert Meadows
Gilbert Sub
Gilbert's Addition
Gill Isles
Gillcrest
Gillens Grove
Gilley
Gilmer Woods
Gilot Heights
Gingerville Manor Estates
Giralda Place Condo
Girard Estates
Girardville
Givans Addition
Gla15 Grandin Lakes Heights
Gla4 Grandin Lakes Heights
Gla5 Grandin Lakes Heights
Gla8 Grandin Lakes Heights
Glade At Hunters Woods
Glade Manor
Glade Sub Div
Gladeport
Glades Newland Sub
Glades Of Boca Lago Condo
Glades Park
Gladeville
Gladewind Heights
Gladhill Estates
Gladiola Gardens Condo
Gladstone Manor
Gladwyne
Glaize
Glamar Estates
Glasgow
Glasgow Court Trailer Park
Glasgow Pines
Glass 120 Condo
Glass @ Victoria Park
Glass House Boca Raton
Glassmanor
Glatfelter Station
Glebe Harbor
Glebe Highlands
Glebe Manor
Glebe Villa
Glebe Way
Glen
Glen Abbey Unit 1
Glen Acres
Glen Afton
Glen Alden
Glen Arm
Glen At Masons Cre
Glen At Medford
Glen At Tamiment (Lehman)
Glen Briar
Glen Brook
Glen Burnie
Glen Burnie Heights
Glen Burnie Park
Glen Condominium 1
Glen Court
Glen Cove
Glen Cove Sec 1
Glen Cove Sec 2
Glen Cove West Sec 1
Glen Dale Commons Phase 2
Glen E Russell
Glen Eagles
Glen Echo Heights
Glen Eden At Davie
Glen Elyn
Glen Eyre At The Arb
Glen Eyre at Mays Landing
Glen Farms
Glen Gardens
Glen Haven
Glen Hills
Glen Knolls
Glen Lakes Estate
Glen Landing Estates
Glen Mar Park
Glen Mills
Glen Oak
Glen Oaks
Glen Oaks Condominium
Glen Oban
Glen Ora
Glen Ora - Plat 9
Glen Ora Plat Three
Glen Park
Glen Riddle
Glen Rock Boro
Glen View Park
Glen Westover
Glenangus
Glenarden
Glenarden Heights
Glenarden Woods
Glenbrook
Glenbrook Condo
Glenbrooke Estates
Glencarlyn
Glencliffe
Glencoe
Glencoe A Sub
Glenda Crest
Glendale
Glendale Acres (A Of E)
Glendale Estates
Glendale Forest-Plat Fou
Glendale Manor
Glendale Road
Glendale Yearound
Glendora
Gleneagles
Gleneagles 2
Gleneagles 6
Gleneagles 9
Gleneagles At Lee's Hill
Gleneagles At St Charles
Gleneagles Condo Iii
Gleneagles Condo Iv
Gleneagles Condo V
Gleneagles Condo Vi
Gleneagles South
Glenecho Condo
Glenelg Manor Estates
Glengary
Glenham - Belford
Glenhardie
Glenhardie Condos
Glenhaven
Glenkirk Estates
Glenmont
Glenmont Forest
Glenmont Hills
Glenmont Metrocentre
Glenmont Village
Glenmoor
Glenmoore Woods
Glenmore Farm
Glenmore Park
Glenn Acres
Glenn B. Hudson
Glenn Dale
Glenn Dale Commons
Glenn Dale Crossing
Glenn Dale Estates
Glenn Dale Heights
Glenn Dale Heights-Resub
Glenn Dale Woods
Glenn Estates
Glenn Rose
Glenn Station
Glenndale
Glenriddle
Glenridge
Glenrose
Glenroyal Sub
Glens Condo
Glenside
Glenvale
Glenvale Condo
Glenvar Heights
Glenverdant
Glenville
Glenwaye Gardens
Glenwood
Glenwood Estates
Glenwood Forest
Glenwood Garth
Glenwood Heights
Glenwood Heights Addn
Glenwood Hgts
Glenwood Manor
Glenwood Subdivision
Glenwood Twnhs
Glenwood Village Condo
Glidden's Terrace
Glotfelty
Gloucester Heights
Glover Park
Glyndon
Glyndon Trace
Glynlea Country Club
Glynlea County Club
Goalcoaster
Goddard
Gold Coast
Gold Coast Twin Villas West
Gold Coaster Mobil Home P
Gold Coaster Mobile Homes
Gold Cup Estate
Gold Key Villas
Gold Key Villas 65-15 B
Gold Key Villas West
Gold Mine Coves
Goldcoaster
Goldcoaster Mobike Home
Goldcoaster Mobile Home Pa
Golden Arrow Condo
Golden Bay Manor Co-Op
Golden Beach
Golden Beach Sec B
Golden Beach Sec C
Golden Beach Sec D
Golden Beach Sec E
Golden Brook Est
Golden Crest
Golden Dreams Condo
Golden Eagle Estates
Golden Gardens
Golden Gardens Sec 6
Golden Gardens Sec 7
Golden Gate
Golden Gate Apartments Co
Golden Gate City
Golden Gate Condo Phase I
Golden Gate Est
Golden Gate Est U
Golden Gate Est Unit
Golden Gate Est Unit 37
Golden Gate Est Unit 40
Golden Gate Est Unit 42
Golden Gate Est Unit 43
Golden Gate Est Unit 44
Golden Gate Est Unit 46 E
Golden Gate Est Unit 50
Golden Gate Est Unit 75
Golden Gate Est Unit 77
Golden Gate Est Unit 79
Golden Gate Est Unit 89
Golden Gate Est Unit 91
Golden Gate Est Unit 92
Golden Gate Estate
Golden Gate Estate Unit 4
Golden Gate Estate Unit 8
Golden Gate Estate Unit 9
Golden Gate Estates
Golden Gate Estates & Mar
Golden Gate Estates Unit7
Golden Gate Park
Golden Gate Park Addn
Golden Gates Estates
Golden Glades Office Pk C
Golden Glades Park
Golden Glades Park 5th Ad
Golden Glades Pk 1st Addn
Golden Glades Pk 1st Addn Re-Sub
Golden Glen
Golden Harbour Sec 2
Golden Harbour Sec 3
Golden Harbour Sec 4 In
Golden Harvest Estates
Golden Heights
Golden Heights Homes
Golden Highlands Est
Golden Highlands Estates
Golden Hill Ests
Golden Homes
Golden Homes Sub
Golden Horn Condo
Golden Horn South
Golden Horn South Condo
Golden House Condo
Golden Isles
Golden Isles Condo Apts
Golden Isles Estates Firs
Golden Isles Sec
Golden Isles Sec A Rev
Golden Isles Sec A Rev Pl
Golden Isles Sec D Replat
Golden Isles Sec E
Golden Isles Towers Condo
Golden Isles Yacht Club C
Golden Isles Yacht Club Condo
Golden Key Cndo
Golden Key Condo
Golden Lakes
Golden Lakes Condo
Golden Lakes Village
Golden Lakes Village Cond
Golden Lakes Village Condo 01
Golden Lakes Village Condo 1 Thru 13-A
Golden Lakes Village Condo 12-C
Golden Lakes Village Condo B C D
Golden Lakes Village Condo E
Golden Lakes Village Condo F
Golden Lakes Village Condo H
Golden Lakes Village Condo K
Golden Lakes Village Condo M
Golden Lakes Village Condo N
Golden Lakes Village Condo R
Golden Meadows
Golden Oaks
Golden Orchards
Golden Park
Golden Pointe
Golden Ponds
Golden Raintree Iv-B Condo
Golden Ridge Add
Golden Sails Condo
Golden Shores
Golden Shores Ocean Blvd
Golden Surf Towers
Golden Surf Towers Condo
Golden Towers Co-Op
Golden Towers No 2 Inc -
Golden Tree
Golden View Condo
Golden West
Golden West Condo
Goldenridge
Golder Gate Est
Goldsboro
Goldsboro Manor
Golf And Tennis Village Parcel C
Golf And Tennis Village Ph 2a
Golf And Tennis Village Ph 3
Golf Club Est
Golf Club Manor
Golf Club Shores I
Golf Club Shores Iii
Golf Cottages 2 Condo
Golf Course
Golf Course Add 2 To Village Of North Palm Beach I
Golf Course Add To Villag
Golf Course Add To Village Of North Palm Beach
Golf Course Add To Village Of North Palm Beach In
Golf Course Addn Hia
Golf Course Ests Sec 2
Golf Course Gardens 1st A
Golf Course Park
Golf Course Sub Amd Pl
Golf Estates
Golf Estates 1st Addn
Golf Ests
Golf Ests 1st Addn
Golf Ests 1st Westview
Golf Lake Villas
Golf Lodges At Southpoint
Golf Lodges At Southpointe
Golf Lodges North At Southpointe, A Condominium
Golf Park Sec 1
Golf Park Sec 1 Westview
Golf Park Sec 2 Rev
Golf Park Unit 1
Golf Ridge Villas Unit A
Golf Stream
Golf View
Golf View Est Corr Plat
Golf View Estates
Golf View Harbour 2nd Sec
Golf Village
Golf Village At Admirals Cove Par B
Golf Village Of Unit 1
Golf Village Of Unit 2
Golf Village Of Unit 3 C
Golf Village Par A
Golf Villas
Golf Villas Condo
Golf Villas Condominium
Golf Villas I Condominium
Golf Villas Ii Condominiu
Golf Villas Ii Condominium
Golfs Edge Condos A Thru G
Golfside Condo
Golfside Ii Condo
Golfview
Golfview Arms Inc Condo
Golfview Cl Fontainbl Pk
Golfview Cl Fontainebleau
Golfview Club At Fontaine
Golfview Club Fontaineble
Golfview Harbour 1st Sec
Golfview Harbour 2nd Sec
Golfview Harbour Estates
Golfview Heights 2
Golfview Park
Golts
Gomez Grant
Gomez Grant W/O Rvr
Good Hope Estates
Good Hope Farms
Good Hope Farms South
Good Hope Hills
Good Hope Ii
Good Luck Estates
Goodland Heights
Goodland Isles 1st Additio
Goodwins Fork Farm
Goodwood Farms
Goose Creek Chase
Goose Creek Farms
Goose Creek Preserve
Goose Creek Village
Goose Creek Village Condominium
Goose Creek Village South
Goose Point Estates
Goose Valley Lake
Gordon
Gordon Dale Pk
Gordon Heights
Gordon Oaks
Gordon Shores
Gordons Corner
Gordy Estates
Gorlin At Aqua Condo
Gorray Park
Gortner
Goshen Commons
Goshen Downs
Goshen Estates
Goshen Hunt Hills
Goshen Overlook
Goshen Terr
Goshen Valley
Goshen Valley Ii
Goshen Valley Iii
Goshen Village
Gosling Creek Purchase
Goucher Woods
Gould Island
Gould Island 15-62 B
Goulds Community Center
Goulds Estates
Goulds Estates Sec 1
Goulds Hammocks
Goulds Point
Govans
Governor Grason Manor
Governor's House
Governor's Land
Governors
Governors Condo Llc
Governors Glen
Governors Grant
Governors Lane
Governors Pointe Condo
Governors Ridge
Governors Row
Governors Square
Gp Development
Gr Capitol Heights
Grace Grove Phase I
Grace Harbour
Grace Homes
Grace Homes B1l1
Grace Landing
Grace Villas Ii Condo
Gracecroft
Graceland Park
Gracewood
Gracewood No 2
Gracewood No 3
Gracewood No 5
Gracewood No 6
Graduate Hospital
Grafton Village
Graham Farm
Graham Park
Graham Park J L Cato
Graham Park Shores
Graham West
Grain Mill Station
Gramercy At Poinciana Condo
Gramercy Park
Gramercy Park Unit 1
Gramercy Park Unit 2
Gramercy Park Unit 4
Gramercy Park Unit 5
Gramercy Square
Gran Paraiso Condo
Granada
Granada Condominium
Granada Estates Sub
Granada Gardens Unit No. 1
Granada Grand Condo
Granada Home Estates
Granada House Condominium
Granada Park
Granada Park A
Granada Place Amd Pl
Granada Terrace
Granada Terrace Gt2
Granada Village A Condo
Granada Village D Condo
Granada Village F Condo
Granberry Estates
Granbury Manor Estates
Granby Woods
Granbys Cove
Granch Acres
Grand Bay
Grand Bay Commons South
Grand Bay North
Grand Bay Residences Cond
Grand Bay Roads
Grand Bay South Estates
Grand Bay South Townhomes
Grand Bay South Villas
Grand Bay Tower Condo
Grand Bel
Grand Bel Manor
Grand Boulevard
Grand Cay
Grand Cay Estates
Grand Cypress Replat
Grand Floridian Estates
Grand Harbor Plat 31
Grand Harbor Wood Duck
Grand Isles
Grand Isles Condo
Grand Key Canal Townhouse
Grand Key Canal Townhouses
Grand Key Estates
Grand Lakes Phase Ii
Grand Lakes Phase Iii
Grand Marquis Condo Homes
Grand Meadows Fairhill
Grand Oak Estates
Grand Oaks Of Arvida Coun
Grand Oasis Condo
Grand Orchid
Grand Palms Grove Estates
Grand Park
Grand Preserve
Grand Prix Farms
Grand Prix Farms Pl 1
Grand Prix Village
Grand Prix Village South
Grand Royale Condo (The)
Grand View
Grand View At Crestwood Condo
Grand View Estates
Grand View Park
Grand Vista Condo
Granda Dadeland Condo
Grande @ 0ld York
Grande At Burrs Mill
Grande At Canal Pointe
Grande At Kingswoods
Grande At Rancocas C
Grande Hammock
Grande Hammock P.D.
Grande Mer Subd
Grande Orchid
Grande View Farms
Grandeville Place
Grandin Lake Shores
Grandios Subdivision
Grandview
Grandview At Annapolis Towne Centre
Grandview At Emerald Hill
Grandview At Emerald Hills Condo
Grandview At Spring Lakes Condo
Grandview Chase
Grandview Estates
Grandview Ests
Grandview Gardens
Grandview Haven
Grandview Heights
Grandview Meadows
Grandview Palm Subdivision
Grandview Park
Grandview Park Condos
Grandville Arms
Grandville Place
Grange
Granite
Granny Branch
Grant Park
Grantchester
Grantham A Condo
Grantham Court
Grantham E Condo
Grantham F Condo
Grantleigh Station
Grantsville
Grantville
Grantwood Acres
Granville
Granville Condominium
Granville Condominium F
Granville Condominium H
Granville Estates
Grapeland
Grapeland Gardens
Grapeland Heights
Grapeland Heights 2nd Sec
Grapeland Heights Sec 2
Grapeland Hgts
Grapeland Park
Grapeland Sub Rev
Grapetree Townhouse Condo
Grapevine
Grasonville
Grass Ridge
Gratigny Park
Gratigny Plaza Condo
Gratitude
Gravel Hill Statio
Gravelly Run
Gray Acres
Gray Fox Woods
Gray Haven
Gray Inn Court
Gray Manor
Gray Manor Homes
Gray Rock Farm
Grayling
Graylyn Crest
Grays Ferry
Grays Pointe
Grayson Village
Graystone
Graystone Estates
Graystone Farms
Graystone Hills
Graystone Manor
Graywood Springs
Great Bohemia Mano
Great Falls
Great Falls Chase
Great Falls Forest
Great Falls Manor
Great Falls Meadows
Great Falls West
Great Good Place
Great Lakes
Great Mills
Great North Mountain Wilderness
Great Oak
Greate Bay Condos
Greater Barnegat - Pebble Beach
Greater Boynton Place 2
Greater Boynton Place 3
Greater Capitol
Greater Capitol Heights
Greater Hanover Boro
Greater Homeland Historic District
Greater Miami Dev Sec A
Greater Tuckerton
Greathouse Condo
Greatland Farms Lake
Greektown
Green Acres
Green Acres Estates
Green Acres Unit 3
Green Bank
Green Briar
Green Briar Acres
Green Cay Village
Green Cay Village Condo
Green Close
Green Cove Heights
Green Diamond Condo
Green Gables
Green Gate
Green Glade
Green Glades
Green Glades South
Green Haven
Green Haven 3rd Addn
Green Haven 4th Addn
Green Haven Acres
Green Henge
Green Hill
Green Hill Acres
Green Hill Farm
Green Hill Forest
Green Hill Manor
Green Hill Mhp
Green Hill Park
Green Hill Village
Green Hills
Green Hills Estates
Green Hills Park West 4
Green Hills Park West No
Green Hills Park West No 3
Green Hills Park West No 5
Green Hills Sec 2
Green Hills Sec 3
Green Holly Woods Plat O
Green Lakes Condo 1 Thru 21 Or3248p1
Green Lane Meadows
Green Lane Village
Green Meadows
Green Meadows Phase 1
Green Oak Townes
Green Oaks
Green Park Sub
Green Ridge
Green Ridge Estates
Green Spring
Green Spring Estates
Green Spring Valley
Green Top Mhp
Green Trails
Green Tree Ests
Green Tree Run
Green Turtle Cove
Green Turtle Cove Condo
Green Valley
Green Valley North
Green View Terrace
Green Willow Run
Green's Unrec
Greenacres
Greenacres 1
Greenacres 2
Greenacres Pl2
Greenacres2
Greenbank Estates
Greenbelt (Co-Op)
Greenbelt Homes
Greenbelt Lake
Greenbelt Lake Village
Greenbelt Station
Greenberry Hills
Greenberry Woods
Greenbrair
Greenbriar
Greenbriar At Whte Mrsh
Greenbriar Condo
Greenbriar Condo Phase I
Greenbriar Condo Phase Iii
Greenbriar Estates
Greenbriar Glen
Greenbriar Horizons
Greenbriar I Of Sherbrooke
Greenbriar Ii
Greenbriar Unit 28
Greenbriar Unit 34
Greenbriar Unit 42
Greenbriar Unit 5
Greenbriar W Pt
Greenbriar Woodlands
Greenbridge
Greenbrier
Greenbrier Condo
Greenbrier Development Ad
Greenbrier Development Add 1
Greenbrier Estates
Greenbrier Hills
Greenbrier Preserve
Greenbrook
Greenbrook Plat 3
Greencastle Antrim Twp
Greencastle Borough
Greencastle Greens
Greencastle Greens Estates
Greencastle Lake
Greencastle Manor
Greencastle Schools
Greencastle Towns
Greendale Estates Sec Fiv
Greene Acres
Greene Countrie
Greene Countrie Vi
Greene Hill Farm Est
Greene Mill Preserve
Greene Road Manor
Greene Sub
Greene Sub 1st Addn
Greene Sub 2nd Addn
Greene Twp
Greenfield
Greenfield Acres
Greenfield At Collegiate Acres
Greenfield Commons
Greenfield Crossing
Greenfield Farm
Greenfield Harbour
Greenfield Heights
Greenfields
Greengate
Greengate Townhomes
Greenglades
Greenglades Condo 2
Greenglades Condo I
Greenglades Condo Ii
Greenglades Condo Iii
Greenglades Condo Iv
Greenglades Condo No 10
Greenglades Condo No 9 Bl
Greenhaven
Greenhaven Run
Greenhill
Greenhill Crossing
Greenhill Farms Estates
Greenhills
Greenhouse
Greenland 5
Greenlands Hunt Valley
Greenlawn
Greenleigh
Greenleigh At Crossroads
Greenleigh Court
Greenmans Minor Plat
Greenmount West
Greenock
Greenpoint Essential
Greenpoint Essential Hotel
Greenpoint Landing
Greenridge
Greenridge Estates
Greens At Boca Golf And Tennis Club Palm Aire East
Greens At Carolina Club
Greens At Fair Lakes
Greens At Huntingdon
Greens At Indian River
Greens At Leisure World
Greens At Rock Glenn
Greens At Smith
Greens At Wescott Ridge
Greens At Westover
Greens At Wyoming
Greens Cay Of Jonathans Landing
Greens Condo Apts Phase I
Greens Condo Apts Phase Ii
Greens Of Boca Lago Condo
Greens Of Crofton
Greens Of Emerald Hills
Greens Of Inverrary Phase
Greens Of Inverrary Phase I
Greens Of Inverrary Phase Ii
Greens Of Patuxent
Greens Of Warther
Greens Of Westminster
Greens Piscataway
Greens Rest Farm
Greens Sub
Greenspointe Indian Spring
Greenspointe Condo
Greenspring
Greenspring East
Greenspring Valley
Greensward
Greensward Village Condo
Greentee
Greentree
Greentree Condo
Greentree Villas
Greentree Villas Condo
Greenview
Greenview At Presidential
Greenview Cove Of Wellington
Greenview Knolls
Greenview Manor
Greenview Park
Greenview Shores 1 Of Wellington
Greenview Shores 2 Of Wel
Greenview Shores 2 Of Wellington
Greenview Shores Of Wellington
Greenview Terrace
Greenview Village
Greenview West
Greenview West Pud
Greenvillage
Greenville Estates Plat O
Greenville Overlook
Greenway Downs
Greenway East
Greenway Farms
Greenway Heights
Greenway Lakes Sec One
Greenway Lakes Sec Two
Greenway Village
Greenway Village North Condo 1
Greenway Village North Condo 2
Greenway Village South Co
Greenway Village South Condo 1
Greenway Village South Condo 2
Greenway Village South Condo 3
Greenway Village South Condo 4
Greenwich
Greenwich Chase
Greenwich Forest
Greenwich Green
Greenwich Hill
Greenwich Park
Greenwich Ph I Condo
Greenwich South Philadelphia
Greenwood
Greenwood Cove Twnhms Sub
Greenwood Estates
Greenwood Farm
Greenwood Farms
Greenwood Forest
Greenwood Forest S/D Unit
Greenwood Forest S/D Unit 1
Greenwood Hamilton
Greenwood Heights
Greenwood Hill
Greenwood Hills
Greenwood Ridge
Greenwood Townhouses
Greenwood Villas
Gregg Neck
Gregory Addn
Gregory Farms
Gregory Heights
Gregory Subdivision A Replat
Greinwich Village
Grenadier East Condo
Grenadier Estates
Grenadier Gardens
Grenadier Lakes
Grenadier Lakes At Welleb
Grenadier Lakes At Welleby
Grenadier Lakes At Welleby Condo
Grenadier Trace I Condo
Grenata
Gresham Place
Greta Condo
Gretna Springs
Grettas Addn To Riverdal
Grey Rock Flats
Grey Rock Villas
Grey Stone
Greyhawk Landing
Greyknoll Estates
Greyknoll Ests Resub
Greyknoll Golf Ests
Greynolds Arms Co-Op Apts
Greynolds Highlands
Greynolds Highlands Unit 1
Greynolds Park Club Condo
Greynolds Park West
Greystone
Greystone Acres
Greystone Hills Pahse Two
Greystone Manor
Greythorne Woods
Grifffing Bisc Pk Est Amd
Griffin 345 Plat
Griffing Bisc Park Est
Griffing Bisc Pk Est
Griffing Biscayne Park Es
Griffing Biscayne Park Estates
Griffing Biscayne Pk Est
Griffing Biscayne Pk Esta
Griffing Condo
Griffing Estates
Griffing Silver Palm Sub
Griffings Biscayne Pk Est
Griffins Sub
Griggs Farm
Grimm-Miller Addition
Grings Hill Estate
Grist Mill
Gristmill Run
Gristmill Woods
Groffdale
Groffdale Mhp
Grosse Pointe Highlands
Grosvenor
Grosvenor Heights
Grosvenor Mews
Grosvenor Park
Grosvenor Park Townhome Condominiums
Grove
Grove At Arlington
Grove At Grand Bay
Grove At Huntley Meadows
Grove At River Oaks
Grove At Waterstone
Grove At Wilton Manors Condo
Grove City Park
Grove Commercial Center
Grove Estates
Grove Garden Residences C
Grove Gardens Condo
Grove Hill Tower Condo
Grove Isle
Grove Isle Condo
Grove Isle East Condo
Grove Isle East Condominium
Grove Isle Marina
Grove Palms I Condo
Grove Palms Ii Condo
Grove Park
Grove Residence Condo Ii
Grove Residence Spa Hotel
Grove Resort
Grove Resort & Spa Condo
Grove Resort And Spa Hotel
Grove Square Condo
Grove The Delray
Grove Towers Condo
Grove Village Condo
Groveland
Groveland Condo
Groveland Pk
Groveland Ranch Acre
Groveland Sub
Grovemont
Grovenor Estates
Grovenor Estates Unit 2-A
Grovenor House Condo
Grovers Summit
Groves At Old Cutler
Groves At Piney Church
Groves Edge Condo
Groves Of Westlake
Groves Park Phase Ii
Groveton
Groveton Heights
Groveton Woods
Groveville
Grovewood
Gruber Carlberg
Gruversville
Gs111 Green Swamp
Gs130 Green Swamp
Gs132 Green Swamp
Gs17 Green Swamp
Gs18 Green Swamp
Gs38 Green Swamp
Gs40 Green Swamp
Gs46 Green Swamp
Gu
Guardian Estates
Guaruja, So Paulo
Guava Groves Estates
Guavaberry
Guayaney Community
Guaymaral
Guildford At Century Vill
Guildford At Century Village Condo
Guilford
Guilford Hills
Guilford Hills East
Guilford Hills North
Guilford Historic District
Guilford Mews
Guilford Twp
Gulf Cove
Gulf Shores Estates
Gulf Stream Views
Gulfair Est 1st Addn
Gulfcoast Inn Of Naples, The A Condo
Gulfstream Co
Gulfstream Condo
Gulfstream Condo Of Las Olas
Gulfstream Estates
Gulfstream Estates 2
Gulfstream Estates No 2
Gulfstream Homesites
Gulfstream Ocean Trs
Gulfstream Park
Gulfstream Preserve
Gulfstream Preserve Condo
Gulfstream Shores
Gulfstream Shores Condo
Gulfstream Village
Gulfview Estates
Gull Harbor
Gull Point
Gull Wing Villas
Gullway Villa
Gulph Creek
Gulph Mills Vil
Gum Landing
Gum Springs
Gum Springs Farm
Gun Barrel Lane Estates
Gun Club Colony
Gunbys Mill
Gunners Lake
Gunners Lake Village
Gunners View
Gunpowder Cove
Gunpowder Ridge
Gunston Corner
Gunston Heights
Gunston Manor
Gunton Heights
Gweyn Falls
Gwinhurst
Gwyn Oaks
Gwynedale
Gwynedd Acres
Gwynedd Club
Gwynedd Hunt
Gwynedd Valley
Gwynedd Woods
Gwynmont Farms
Gwynn Falls
Gwynn Oak
Gwynn Oak Uplands
Gwynn Park
Gwynnbrook
Gwynnlake Park
Gwynns Falls Park
Gypsy Lane Condos
H & S Estates Unr Sub
H J Kincy's Subdivision
H Street Corridor
H2o Dania Beach
H59c+Gc Santa Fe De Antioq
Habitat
Habitat 1175 Condo
Habitat For Humanity
Habitat For Humanity Of Broward
Habitat Homes I
Habitat Ii Condo
Habitat Ii Phase Iv Condo
Habitat Villas
Habor Villa 1
Hacienda El Corral
Hacienda Lindora
Hacienda Margarita
Hacienda Olonche
Hacienda Portugal
Hacks Point
Hacks Point Beach
Haddad Sub
Haddington
Haddon Hills
Haddonfield Commons
Haddonleigh
Haddontowne
Hadley Farms
Hadley Place
Haf Hop Unit 2
Hagen Ranch Heights
Hager Heights
Hager Meadows
Hager Subdivison
Hagers Crossing
Hagers Crossing Phs1 Blk
Hagerstown
Hague
Hahn's Meadow
Haifa Condo
Hailey's Glen
Haines
Haines Acres
Haines Acres/East York
Hainlin Mill Estates Sec
Hajos Acres
Hal S Thomas Resubdivision Of Lots
Halcon Villas No 5 Condo
Halcyon Hills
Halcyon Of Herndon
Halcyon Of Palm Beach
Haldane La Plata
Haldeman Mhp
Halethorpe
Half Moon Bay
Half Moon Bay Condo
Half Moon Bay Condo Ph I And Ii
Half Moon Towers Condo
Halford Tract
Halfway
Halfway Area
Halifax
Halifax Heights
Halifax Township
Hall Road Property (Hall
Halladale
Hallam & Cos Subdivision Farming &Trucking Lands
Hallam Borough
Hallandale
Hallandale Beach
Hallandale Beach Private
Hallandale By The Sea
Hallandale Garden Park
Hallandale Oasis
Hallandale Park
Hallandale Park 5-20 B
Hallandale Park No 3
Hallandale Park No 4 Amen
Hallandale Park No 5
Hallandale Trailer Estates Inc
Hallendale
Hallfield Manor
Hallie Hill Farm
Halliewood
Hallmark
Hallmark Glen
Hallmark Heights Estates
Hallmark Manor
Hallmark Manor/Westgate
Hallmark Of Hollywood Con
Hallmark Of Hollywood Condo
Hallmark Woods
Hallowell
Hallowing Point River Estates
Halls Add 1-134 D
Halls Hill
Hallwood Heights
Halock No 2
Halock-Sec 1
Halpatiokee Park
Halstead Apts Condo
Halstead At The Metro
Hamburg
Hamburg Boro
Hamilton
Hamilton Area
Hamilton Bay
Hamilton Bay Sec 02
Hamilton Bay Sec 1a And 1b
Hamilton Chase
Hamilton Condo
Hamilton Crossing
Hamilton Estates
Hamilton Fields
Hamilton Greene
Hamilton Heights
Hamilton Hills
Hamilton Park
Hamilton Place
Hamilton Pointe
Hamilton Square
Hamilton Twp
Hamilton Walk
Hamilton's Overlook
Hamiltonban Township
Hamiltowne
Hamlet
Hamlet At Bird-In-Hand
Hamlet At Poinciana
Hamlet At Poinciana Condo
Hamlet At Seagate
Hamlet Hills
Hamlet House
Hamlet Mews
Hamlet North
Hamlet Of Tillery
Hamlet Place
Hamlet Square
Hamlet Woods
Hamlin Hills
Hammarlee Estates
Hammer Point Park
Hammock Beach Club Condo
Hammock Creek
Hammock Creek Pud 06
Hammock Crk 03
Hammock Lake No 2
Hammock Lakes Phase 2 Pd
Hammock Lakes Phase I
Hammock Mobile Home Est
Hammock Oaks
Hammock Oaks Harbor Sec 2
Hammock Of Sandalfoot
Hammock Pointe
Hammock Reserve
Hammock Reserve Ph 1
Hammock Unit 01
Hammocks
Hammocks At Riverglen
Hammocks Of Westlake
Hammocks Sec 1
Hammocks Sec 3
Hammocks Shores
Hammocks Trails Condo
Hammocks-Lake Forest Cond
Hammocks-Lake Forest Condo
Hammon Heights Sec 2
Hammon Heights Sec 3
Hammon Heights Sec One
Hammon Park
Hammond Estates
Hammond Heights
Hammond Woods
Hammonds Mill
Hammonton
Hammonton Lake
Hammonton Meadows
Hampden Gardens
Hampden Heights
Hampden Historic District
Hampden Twp
Hampden Village
Hampshire
Hampshire Arms Cond Apts
Hampshire Arms Cond Apts Unit 211
Hampshire At Princet
Hampshire Estates
Hampshire Gardens
Hampshire Greens
Hampshire Hall
Hampshire Hall Condo
Hampshire Hamlet
Hampshire Heights
Hampshire Knolls
Hampshire Villas Condo
Hampstead
Hampstead Landing
Hampstead Valley
Hampton
Hampton Beach Club
Hampton Beach Club Condo
Hampton Bridge
Hampton Cay
Hampton Chase
Hampton Club
Hampton Court
Hampton Court Condo
Hampton East Condo
Hampton Fairways 2
Hampton Gardens
Hampton Gardens 1 Condo
Hampton Gardens 2 Condo
Hampton Gardens 3 Condo
Hampton Greens
Hampton Grove
Hampton Heights
Hampton Hills
Hampton Hills Condo
Hampton House
Hampton House Condo
Hampton Isles Condo
Hampton Lakes
Hampton Lakes At River Hall
Hampton Lakes Phase Iii
Hampton Meadows
Hampton Oaks
Hampton Park
Hampton Park Pd Phase 1
Hampton Ridge
Hampton Square
Hampton Square Condominiums
Hampton Sub-Plat 1>
Hampton Village
Hampton Woods
Hamptons
Hamptons At Maplewood
Hamptons Of Mclean
Hamptons Of North Lauderd
Hamptons Of North Lauderdale
Hamptons South Condo
Hamptons West
Hamptons West Condo
Hamptons/Metrowest
Hamptontowne
Hanamal 12
Hanbury Court At Winding Hills
Hancock
Hancock Farms
Hancock Hollow
Hancock Subdivision
Handsonhurst Park
Handyman Investor Contractor Special
Hanging Rock
Hanlon
Hannah's Orchard
Hannover
Hanover
Hanover Boro
Hanover Farms
Hanover Heights
Hanover Hills
Hanover Hills Small Farm
Hanover Manor Crossing
Hanover Pointe
Hanover Square
Hanover Village
Hanover Woods
Hanoverville
Hanson Grant/Inside Mariner Cay
Hansons Landing Condo
Happy Creek Knolls
Happy Farms View
Happy Home Heights
Happy Valley
Happy Valley Retreat
Harbeson
Harbie Center Condo
Harbor Beach
Harbor Beach Ext 31-13 B
Harbor Beach Extension
Harbor Beach Inlet
Harbor Club Condo
Harbor Condo
Harbor East
Harbor Estates
Harbor Front
Harbor Haven Condo
Harbor Hills
Harbor House North Condo
Harbor Island
Harbor Island Beach Club
Harbor Islands
Harbor Isle
Harbor Isle Phase 2
Harbor Pines
Harbor Place Condo
Harbor Point West Condo
Harbor Pointe
Harbor Shores
Harbor Side Condo At Belmont
Harbor Station
Harbor Terrace
Harbor Tws At The Waterwa
Harbor Tws At The Waterway
Harbor Tws At The Waterways Condo
Harbor View
Harbor View Apts Condo
Harbor Villa 2
Harbor Village
Harbor Village Marina
Harbor Village Phase Ii Grand Harbor
Harbor Village Sec
Harbor Village Sec E
Harbor Village Sec F
Harbor Village Sec G
Harbor Village Sec I
Harbor Village Sec I 46-8
Harbor Villas Palm Beach Condo
Harbor'edge
Harbor-Villa 1
Harbor-Villa 2
Harborage Yacht Condo
Harborage, The
Harbordale Condo
Harbors Edge
Harborside
Harborside At Hillsboro Beach
Harborside At The Waterw
Harborside At The Waterwa
Harborside Condominium
Harborton Place
Harborview
Harborview At Fisher Isla
Harborwoods
Harbour At Jonathans Landing
Harbour Club
Harbour Club Villas Condo
Harbour Cove
Harbour East
Harbour East House Condo
Harbour Gates
Harbour Hall Condos
Harbour Hall Inlet Club C
Harbour Hall Inlet Club Condo
Harbour Heights
Harbour Heights Add
Harbour Heights Add 35-21
Harbour Heights Add Amen
Harbour Heights Sec 11 Par
Harbour Heights Sec 11 Part2 Rep
Harbour Heights Sec 11 Pt3
Harbour Heights Sec 6
Harbour House
Harbour House Condo
Harbour Inlet
Harbour Island
Harbour Island Amd
Harbour Island At Palm Cove
Harbour Isle
Harbour Isle At Hutchinso
Harbour Isle At Hutchinson Island
Harbour Isle At Hutchinson Island East
Harbour Isle At Hutchinson Island West
Harbour Isle At Hutchinson Island West, A Condomin
Harbour Isle East
Harbour Isle West
Harbour Isles
Harbour Isles At Lake Charles
Harbour Isles Phase 1
Harbour Lakes Estates
Harbour Light Condos
Harbour Oaks
Harbour Point
Harbour Point Condo
Harbour Point Townhomes
Harbour Pointe
Harbour Pointe At River Bridge Condo
Harbour Pointe Of Miami C
Harbour Ridge
Harbour Ridge - Bayhead Village
Harbour Ridge - Buttonbush Village
Harbour Ridge - Deer Moss Village
Harbour Ridge - Dewberry Village
Harbour Ridge - East Hammock
Harbour Ridge - Fairway Village
Harbour Ridge - Figtree Village
Harbour Ridge - Green Briar Village
Harbour Ridge - Lancewood
Harbour Ridge - Laurel Oak
Harbour Ridge - Mile Lake Village
Harbour Ridge - Orchid Trail
Harbour Ridge - Palmetto Village
Harbour Ridge 1
Harbour Ridge 6 Laurel Oak/Royal Fern
Harbour Ridge No 6 Laurel Oak/Royal Fern
Harbour Ridge Plat No 1
Harbour Ridge Y&Cc - Cinnamon Village
Harbour Ridge Y&Cc - Deer Moss Village
Harbour Ridge Y&Cc - Fairway Village
Harbour Ridge Y&Cc - Mariner Village
Harbour Ridge Y&Cc - Mile Lake Village
Harbour Ridge Y&Cc - Palmetto Village
Harbour Ridge Y&Cc - South Shore Village
Harbour Ridge Y&Cc - Sweetbay Village
Harbour Ridge Y&Cc Buttonbush Village
Harbour Ridge Y&Cc-Bayhead Village
Harbour Ridge Y&Cc-Buttonbush Village
Harbour Ridge Y&Cc-Greenbriar Village
Harbour Ridge Y&Cc-Mile Lake Village
Harbour Ridge Y&Cc-Pond Apple Village
Harbour Ridge Y&Cc-South Shore Village
Harbour Ridge Y&Cc-Sweetbay Village
Harbour Ridge Y&Cc/Mile Lake Village
Harbour Ridge Yacht & Cc - Deer Moss Village
Harbour Ridge Yacht & Cc - Dewberry Village
Harbour Ridge Yacht & Cc - Mariner Village
Harbour Ridge Yacht & Cc-Palmetto Village
Harbour Ridge Yacht & Country Club - Bayhead Villa
Harbour Ridge Yacht & Country Club - Fairway Villa
Harbour Ridge Yacht & Country Club - Fig Tree
Harbour Ridge Yacht And Country Club - Pond Apple
Harbour Ridge/Palmetto Village
Harbour Side
Harbour Side Ii
Harbour Springs At Mission
Harbour Square
Harbour Sub
Harbour Subdivision
Harbour Terrace Condo
Harbour Towers Condo
Harbour Villa Section 2
Harbourage Place Condo
Harbours At Aberdeen Condo
Harbourside
Harbourside Condo
Harbourwood Sketch Of Sur
Harbourwood Sketch Of Survey
Hardey
Harding Avenue Condo
Harding Hall Condominium
Harding Lakes
Harding Run
Harding Run 1
Harding Run 2
Harding Tower Condo
Harding Townsite
Harding Villas Condo
Harding Woods
Hardship Plantation
Hardwick Heights
Hardwood Hills
Hare Glen
Harford Commons
Harford Estates
Harford Green
Harford Hills
Harford Landing
Harford Mobile Village
Harford Park
Harford Square
Harford Town
Harford Village
Harger Hills
Harlem 01 02 03 04 05
Harlem 5
Harlem Add
Harlem Park
Harlem S/D No 1-2-3-4 + 5
Harlem S/D No 7
Harlow Pointe
Harmans
Harmans Woods
Harmony
Harmony Acres
Harmony Hall Farm
Harmony Heights
Harmony Heights Addition
Harmony Heights No 4
Harmony Heights Subdivisi
Harmony Heights Subdivision
Harmony Hills
Harmony Island
Harmony Nbhd H-1
Harmony On Lake Eloise Phase 1
Harmony Parc
Harmony Park
Harmony Reserve Pd Phase 2
Harmony Terrace Condo
Harmony Twp
Harmony Village Community
Harmony Woods
Harole's Place
Harper House Condominiums
Harpers Choice
Harpers Ferry Campsites
Harpers Ferry Corporation
Harpers Orchard
Harriel Estates
Harriet Court Condo
Harriette Park No 2 Amd P
Harriette Pk
Harriman
Harrington
Harrington Manor
Harrington Meadows
Harrington Terrace
Harris
Harris Estates
Harris Ocean Park
Harris Ocean Park Estates
Harris Ocean Park Ests
Harris Sub
Harrisburg
Harrisburg City
Harrison
Harrison Township
Harrison Estate
Harrison Estates
Harrison Hills
Harrison Meadows
Harrison Village
Harriston
Harriton Farm
Harrogate
Harrowgate
Harshbarger
Hartford Place
Hartford Thayer Condominium Apartments
Hartford Woods
Hartlake Estates
Hartland
Hartleys
Hartly
Hartmans
Hartranft
Hartsville Park
Hartwood
Hartwood Landing
Hartwood Village
Harundale
Harvest Farms
Harvest Hills
Harvest Meadows
Harvest Pines
Harvest Ridge Estates
Harvest Run
Harvest Section Three Con
Harvestdale
Harvey Cedars
Harveys Peninsula
Harwill Acres
Harwood
Harwood 2nd Addn To River
Harwood C Condo
Harwood E Condo
Harwood F Condo
Harwood J Condo
Harwood Park
Harwood Village
Harwood Village 2 Addn
Hastings Condos
Hatboro Lofts
Hatboro Station
Hatchwood Estates Phase Three
Hatfield Crossing
Haulover
Haut Du Cap
Havana Lofts Condo
Havana Moon Condo
Havana Sun Condo
Havanah Roads Condo
Haven Apartments Condo
Haven Beach
Haven Homes Subdivision
Haven House No 1 Condo
Haven House No 2 Condo
Haven House No 3 Condo
Haven House No 4 Condo
Haven House No 6 Condo
Haven Lake Ests
Haven Lake Park
Haven View Addition No 1
Havenstone
Havenwood Park
Haverford
Haverford Hill
Haverford Reserve
Haverford Vil
Haverhill
Haverhill Riding Estates
Haverhill Road Condo
Havertown
Haviland Hills
Havn Residences & Yacht Club Condo
Havn Residences And Yacht Club
Havre De Grace Heights
Hawaiian Garden
Hawaiian Gardens
Hawaiian Gardens -Petunia
Hawaiian Gardens Condo
Hawaiian Inn Beach Resort Condo
Hawk Ridge
Hawk Ridge Estates
Hawk Run
Hawk Valley
Hawk Valley Estates
Hawkes Bluff
Hawkin Point
Hawkins Gate
Hawks Landing
Hawks Nest
Hawks Ridge
Hawks View
Hawkseye
Hawksnest 1st Addn
Hawkstone Village
Hawley Acres (Unrecorded)
Hawley Heights
Hawthorn
Hawthorne
Hawthorne At Century Vill
Hawthorne At Century Villa
Hawthorne At Century Village
Hawthorne Bay Condo
Hawthorne East Co-Op
Hawthorne Galiano Pointe
Hawthorne Greene
Hawthorne Manor
Hawthorne Park
Hawthorne Ridge
Hawthorne Village
Hawthorne Village Inc Con
Hawthorne Woods
Hawthornes Grant At Bro
Haydn Manor
Hayfield Farm
Hayfields Manor
Hayman Lands
Haymarket
Haymarket Crossing
Haynsworth Beach Sub
Haynsworth Village
Hays Beach
Hays Landing
Hayti
Haywood Heights
Hazel Farm
Hazel Park
Hazel Ridge
Hazel Run Glen
Hazelhurst
Hazelton Park
Hazelwood
Hazelwood Acres
Hazen Ham Division
Hazenthorpe
Hazleton
Heacock Mdws
Headwater Cove
Headwater Village
Healy Heights
Heards Estates
Hearthstone
Hearthstone At Village Square
Hearthstone At Wedge
Hearthstone Manor
Hearthstone Village
Heathcote Village
Heather Croft
Heather Glen
Heather Greens
Heather Hall Condo
Heather Heights
Heather Hills
Heather Hills At Belair
Heather Hills/Brightfld
Heather Knoll
Heather Lakes Unit Ix
Heather Ridge
Heather Way
Heatherfield
Heatherfield Condos
Heatherfield East
Heatherlake At The Meadows
Heatherlea
Heatherwick
Heatherwood Condo
Heatherwood Phase 2
Heathgate
Heathgate Sunflower
Heathgate 2nd Add
Heathgate 3rd Add
Heathgate First Add
Heathrow
Heathsville
Heathwood
Heathwood Reserve Pud
Heavenly Acres Ridge
Hebron Woods
Hedgerow Mews
Hedgerow Woods
Hedgesville
Hedgesville Hills
Hedgeville
Heerman's Subdivision
Heftler Homes At Lago Mar
Heftler Homes At Pembroke
Heftler Homes At Pembroke Shores
Heftler Homes Sec 1
Heftler Homes Sec 3
Heftler Homes Sunset Park
Heftlers Lago Mar West
Hegins
Heidelberg Crossing
Heidelberg Run Eas
Heidelberg Township
Heidi Estates
Heights
Heights At Penderbrook
Heilbron
Heisters Creek
Heitmuller Estates
Helds Sub
Helen Mar Condo
Helena Homes First Addn
Hellam Twp
Hellertown Borough
Hellgate Isle Retreats
Helms Country Estates Add
Helms Country Estates Re-
Helms First Addn
Helms Mountain
Hemingway Estates
Hemingway Landings Condo
Hemingway Point
Hemispheres Condo
Hemispheres Ocean South
Hemlock Farms
Hemlock Hills
Hempfield
Hempfield Crossing
Henderson Park
Hendricks Heights
Hendrix Reserve
Henley's Park
Henlopen Gardens
Henlopen Keys
Henlopen Landing
Henlopen Station
Henry Ford Sub No 2
Henry Land
Hensell Heights
Herald Harbor
Herbert Fields
Hercala Acres
Hereford Estates
Hereford Township
Hereford Zone
Herfa Sub
Heritage
Heritage At Marshall
Heritage At Parke Fa
Heritage At St. Charles
Heritage At Two Rivers
Heritage Bay
Heritage Circle
Heritage Circle Condo
Heritage City
Heritage City Sec 1
Heritage City Sec 2
Heritage Club
Heritage Condo
Heritage Court
Heritage Cr Ests
Heritage Creek
Heritage Crossing
Heritage Enclave
Heritage Estates
Heritage Farm
Heritage Farms
Heritage Gate
Heritage Green
Heritage Grove
Heritage Hamlet
Heritage Harbor
Heritage Harbour
Heritage Heights
Heritage Highlands
Heritage Hills
Heritage Homes
Heritage Hunt
Heritage Lakes
Heritage Landing
Heritage Landings Condo
Heritage Manor
Heritage Oaks
Heritage Oaks At Tradition
Heritage Park
Heritage Place
Heritage Plantation
Heritage Point
Heritage Ridge North Sec 01 Lexington
Heritage Run
Heritage Shores
Heritage Square
Heritage Square Condo
Heritage Trace
Heritage Valley
Heritage Village
Heritage Village Of P B L
Heritage Village Of P B Lakes
Heritage Village Townhomes
Heritage Villas
Heritage Walk
Heritage Woods
Heritage Woods Est
Heritage Woods North
Heritage-Lederach
Herman Heights Sec 1
Herman Hills
Herman Hills 1st Addn
Herman Mnr
Hermitage
Herndon
Herndon Addition To Occo
Herndon Park Station
Heron Bay - Banyan Isles
Heron Bay /Tuscany
Heron Bay Central
Heron Bay East
Heron Bay East Olde Brooke
Heron Bay Five
Heron Bay Four
Heron Bay North Plat 2
Heron Bay North Plat 3
Heron Bay Northeast
Heron Bay South
Heron Bay The Glen
Heron Bay Two
Heron Cay
Heron Cove
Heron Harbor
Heron Harbour
Heron House Condo
Heron Landing
Heron Point
Heron Pointe Palm
Heron Ponds
Heron Preserve
Heron Preserve At Traditi
Heron Preserve At Tradition Phase 2a
Heron Preserve At Tradition Phase 2b
Herons Glen
Heronwood
Herring Creek Estates
Herring Run Park
Hershey
Hershey Downtown
Hershey Village
Hersheys Mill
Herzfelds Add To Lauderda
Hessian Camp
Hessian Hills
Hessian Pines
Hetzel
Hetzel Plaza
Heywood Glen
Hi Greens Of Inverrary Phase Ii
Hi-Greens Of Inverrary
Hi-Lo Acres
Hi-Pine Homesites
Hi-View Acres
Hia 13 Addn Amd Pl Rev
Hialeah
Hialeah 12th Addn
Hialeah 12th Addn Rev & A
Hialeah 12th Addn Rev & Amd Plat
Hialeah 13th Addn Amd Pl
Hialeah 14 Addn
Hialeah 14th Addn
Hialeah 14th Addn Rev Pl
Hialeah 16 Addn Amd & Rev
Hialeah 16th Addn
Hialeah 16th Addn Amd
Hialeah 3rd Addn
Hialeah 54th Street Addn
Hialeah 5th Addn
Hialeah 6th Addn
Hialeah 7th Addn
Hialeah 8th Add
Hialeah 8th Addn
Hialeah 8th Addn Rev Pl
Hialeah 9th Addn
Hialeah Club Villas Condo
Hialeah Condo
Hialeah Deer Pk Addn
Hialeah Estates
Hialeah Heights
Hialeah Homesites
Hialeah Lawn Amd Pl
Hialeah Park
Hialeah Pines Custom Home
Hialeah Rev Pl 12th Addn
Hiatt Pointe At Snowden Bridge
Hibbs Grove Plantation
Hibiscus By The Sea Condo
Hibiscus By The Sea Condominium
Hibiscus Gardens
Hibiscus Gardens Condo
Hibiscus Island
Hibiscus Park
Hibiscus Park Sec 02 & 03a
Hibiscus Terrace Condo
Hickman
Hickory Cluster
Hickory Creek
Hickory Creek Estates
Hickory Glen
Hickory Hall Estates
Hickory Hill
Hickory Hill Estates
Hickory Hill Retreats Unit 5
Hickory Hills
Hickory Hills (Foster Twp)
Hickory Hills Condominiums
Hickory Hills Retreat
Hickory Hollow
Hickory Landing
Hickory Meadows
Hickory Overlook
Hickory Place
Hickory Pointe
Hickory Ridge
Hickory Ridge La Plata
Hickory Run
Hickory Run Forest
Hickory Towne
Hickory Woods
Hicks Estates
Hidden Acres
Hidden Banyan Condo
Hidden Brook
Hidden Court Townhomes
Hidden Cove
Hidden Cove Ests
Hidden Cove Townhouses
Hidden Creek
Hidden Fields
Hidden Forest At Silver Cr
Hidden Forest Estates
Hidden Grove
Hidden Hammocks Estates
Hidden Harbor
Hidden Harbor Condominium
Hidden Harbour Condo
Hidden Harbour Estates
Hidden Harbour Of The Pal
Hidden Harbour Of The Palm Beaches Condo
Hidden Hollow
Hidden Hollow 2
Hidden Key
Hidden Key Condo
Hidden Key North
Hidden Lake
Hidden Lake At Kendall
Hidden Lake Townhomes
Hidden Lake Village
Hidden Lakes
Hidden Lakes At Northtree
Hidden Mdws
Hidden Meadows
Hidden Mill Estates
Hidden Oaks
Hidden Pass
Hidden Pines
Hidden Pines Estates
Hidden Pond
Hidden River
Hidden River Estates
Hidden Spring
Hidden Springs
Hidden Springs Condo
Hidden Stream
Hidden Valley
Hidden Valley Estates
Hidden Valley Farms
Hidden Valley Sec 2
Hidden Valley Sec 3
Hidden Valley Sec 4
Hiddenbrook
Hideaway
Hideaway Bay Beach Club
Hideaway Beach
Hideaway Condo
Hideaway Isles
Hideaway Park
Hideaway Pines Sec 1
High Banks
High Bar Harbor
High Country Estates
High Grove
High Hook Farms
High Knob
High Knob/Old Fields Owners Assoc.
High Land Estates
High Meadows
High Mountain Orchard
High Pine Ests
High Pines Estates
High Pines Rev Plat Of 2n
High Point
High Point Condo
High Point Condo Sec 3
High Point Condo Sec 4
High Point Delray Beach Sec 05
High Point Estates
High Point Of Delray
High Point Of Delray Beac
High Point Of Delray Beach
High Point Of Delray Beach Cond Sec Iii
High Point Of Delray Beach Condo Sec I
High Point Of Delray Beach Condo Sec Ii
High Point Of Delray Beach Condo Sec Iii
High Point Of Delray Sec
High Point Of Delray Sec 4
High Point Of Delray Sec 5 Condo
High Point Of Delray Sec 6 Condo
High Point Of Delray Sec 7 Condo
High Point Of Delray West
High Point Of Delray West Sec 3
High Point Of Delray West Condo Sec 1&2
High Point Of Delray West Condo Sec 3
High Point Of Fort Pierce
High Point Of Fort Pierce Condominium Section 1
High Point Of Fort Pierce Condominium Section 2
High Point Of Fort Pierce Condominium Section 3
High Point Preserve
High Point Sec 7
High Point Sewalls Point
High Point Tr Pk
High Point West Condo
High Pointe
High Pointe At Hop
High Pointe At Jefferson
High Pointe At Rippon Landing
High Pointe At Rojen Farms
High Pointe At St Ge
High Pointe Estates
High Pointe In Hershey
High Pointe North
High Pointe South
High Pointe Subdivision - Phase 2 P.D.
High Pointe West Residential Subdivision
High Ridge
High Ridge Park
High School Pk Track
High Street
High Street Estates
High View
High View At Hunt Valley
High View Manor
Highbridge
Highfield
Highfield House Condominium
Highfields At Rollng Rd
Highgrove
Highgrove Sub
Highland
Highland Adventures
Highland At Landover Station
Highland At Park Central
Highland Beach
Highland Beach Club Condo
Highland Estates
Highland Farm
Highland Farms
Highland Gardens
Highland Gardens Fourth A
Highland Glen
Highland Grove Estates
Highland Hill
Highland Homes
Highland House Of Palm Bea
Highland Lakes
Highland Lakes East
Highland Lakes Reserve Pb
Highland Lakes Sec 12
Highland Lakes Sec 13
Highland Lakes Sec 2
Highland Lakes Sec 3
Highland Manor
Highland Manor Sec 1
Highland Manor Sec 3
Highland Manor Sec 5
Highland Manor Sec 6
Highland Meadows
Highland Meadows Estates
Highland Meadows Estates East
Highland Meadows Estates West
Highland Mews
Highland Oak Gardens Sec
Highland Oaks
Highland Park
Highland Park East
Highland Park Resub
Highland Park Resubdivision
Highland Park Rv
Highland Park Sub
Highland Park Village Con
Highland Park Village Condo
Highland Pines
Highland Pines 2
Highland Pines Park Rv
Highland Pines Sec 1
Highland Place Condo
Highland Ranch Estates
Highland Residences
Highland Ridge Phase 2
Highland Springs
Highland Square
Highland Stone
Highland Terr
Highland Towers Inc
Highland Township
Highland Trailer Park
Highland Village
Highland Woods
Highland Woods Sec 1
Highland Woods Sec 4
Highlander Park
Highlands
Highlands At Back Creek
Highlands At Clarksburg
Highlands At Kendall
Highlands At Kendall 1st
Highlands At Kendall Lks
Highlands At Kendall Lks Condo
Highlands At Quarry Lake
Highlands Of Olney
Highlands Of Tam O Shante
Highlands Of Warrenton Phase 2
Highlands Park
Highlands Park Est
Highlands Park Est Sec B
Highlands Park Est Sec C
Highlands Park Est Sec D
Highlands Park Est Sec E
Highlands Park Est Sec F
Highlands Park Est Sec G
Highlands Park Est Sec H
Highlands Park Est Sec P
Highlands Park Est Sec R
Highlands Park Estate
Highlands Park Estates
Highlands Park Estates Hpe3
Highlands Park Sw Area
Highlands Phase One
Highlands Reserve
Highlands Reserve Phase
Highlands Reserve Pud
Highlands Ridge On Lk Bonnet Unrec
Highlands Row
Highlandtown
Highline
Highmeadow Hills
Highmeadows
Highpoint
Highpoint At Downingtown
Highpoint At New Britain
Highpoint Condo
Highpoint Of Culpeper
Highpointe
Highpointe At Salford
Highpointe Condominium
Highpointe Pud
Highridge Estates
Highside Subdivision
Highspire
Highspire Borough
Highview
Highview At Montgome
Highview Gardens Sec C
Highview Park
Highview Park 48-28 B
Highway 27
Highway Br153
Highway Park 2nd Add
Highway Park South Add
Highway Sub Amd
Hilah Park Addn
Hilcrest Orchards
Hildabrad Park
Hildas Estates
Hildeburn
Hill Crest
Hill Crest Acres
Hill East
Hill House
Hill Oaks
Hill Oaks Condo Phase 1-
Hill Street
Hill Top Estates
Hill Valley Acres
Hill's Add Benedict Sub
Hill-Mont Heights
Hill-N-Dale
Hillandale
Hillandale Forest
Hillandale Heights
Hillandale Homes
Hillbrook
Hillbrook Wilton Manors
Hillcrest
Hillcrest Acres
Hillcrest At L W
Hillcrest Condo No 1
Hillcrest Country Club
Hillcrest Country Club Ap
Hillcrest Country Club Apts
Hillcrest Country Club Apts No 7
Hillcrest Country Club Co
Hillcrest Country Club No
Hillcrest Country Club North
Hillcrest Country Club So
Hillcrest Country Club South
Hillcrest East
Hillcrest East 20
Hillcrest East No 19 Cond
Hillcrest East No 20 Cond
Hillcrest East No 22 Cond
Hillcrest East No 23 Cond
Hillcrest East No 23 Condo
Hillcrest East No 24 Cond
Hillcrest East No 24 Condo
Hillcrest East No 25 Cond
Hillcrest East No 25 Condo
Hillcrest East No 26 Cond
Hillcrest East No 26 Condo
Hillcrest East No 27 Cond
Hillcrest East No 27 Condo
Hillcrest Estates
Hillcrest Gardens
Hillcrest Heights
Hillcrest Homes Of Lake Da
Hillcrest Ii
Hillcrest N0 21 Condo
Hillcrest No 21 Condo
Hillcrest No.21
Hillcrest Of Pompano Condo
Hillcrest Orchards
Hillcrest Subdivision
Hillcrest Towne
Hillcrestshire
Hilldale
Hillen
Hillendale
Hillendale Park
Hillgate
Hillmead
Hillmeade
Hillmeade Manor
Hillmeade Station Plat O
Hillmont
Hillmont Middle River Vis
Hillmont Middle River Vista
Hillmont-Middle River Vista
Hilloch Manor
Hills At Lock Ridge
Hills At Northampt
Hills At Valley View
Hills At Woodgate
Hills Edge
Hills Of Aquia
Hills Of Inverrary
Hills Of Inverrary Tract
Hills Of Jamesfield Manor
Hills Of London Grov
Hills Of Waterford
Hills Over Pratts
Hills Quarter
Hillsboro Associates Plat
Hillsboro Bay By The Sea
Hillsboro Beach
Hillsboro Colonnade Condo
Hillsboro Country Club
Hillsboro Cove Condo
Hillsboro Estates
Hillsboro Harbor
Hillsboro Harbor Unit
Hillsboro Heights
Hillsboro Imperial Apts C
Hillsboro Imperial Apts Condo
Hillsboro Island House
Hillsboro Island House Condo
Hillsboro Isles
Hillsboro Kings Village
Hillsboro Landings
Hillsboro Landings Condo No One
Hillsboro Landings Condo No Two
Hillsboro Le Baron Condo Apts
Hillsboro Light Towers Co
Hillsboro Light Towers Condo
Hillsboro Mile
Hillsboro Mile Ocean Apts Sec 2
Hillsboro Ocean Club Condo
Hillsboro Park
Hillsboro Pines Sec
Hillsboro Shores
Hillsboro Shores Executiv
Hillsboro Shores Sec
Hillsboro Shores Sec B
Hillsboro Square Condo
Hillsboro Windsor Condominium
Hillsborough
Hillsdale
Hillside
Hillside Acres Amd Pl
Hillside Farm
Hillside Farms
Hillside Heights
Hillside House Of Gulfstream Condo Show
Hillside Landing
Hillside Manor
Hillside Manor Mobile Home Park
Hillside Park
Hillside Subdivision
Hillside Terrace
Hillside Twp
Hillside Villas
Hillsmere Estates
Hillsmere Shores
Hilltop
Hilltop Acres
Hilltop Farms
Hilltop Mobile Village
Hilltop Park
Hilltop Ridge
Hilltop Summit
Hilltop Townhomes
Hilltop Village Condominiums
Hilltown
Hillview
Hillview Estates
Hillview Subdivi
Hillwood Manor
Hillymede
Hilton
Hilton Club Q Residences
Hilton Terrace Condo
Hiltonia
Himes Hill
Himmarshee Park
Hines Estates
Hines Place
Hingle Crk Resrv At Oaks
Hinson Add
Hirst Farm
Hisey Park
Historic Belair In The Southend
Historic Cambridge
Historic Charles Town
Historic Chestertown
Historic District
Historic District - West End
Historic District-Bellefonte
Historic Downtown
Historic Downtown Winchester
Historic Falmouth
Historic Frederick City
Historic Fredericksburg
Historic Greenacres
Historic Havre De Grace
Historic Manassas
Historic Medford
Historic Midtown
Historic Newton Square
Historic Oxford
Historic Roadstown
Historic Selma Estates
Historic St. Michaels
Historic Victorian
Historic West End
Historic Winchester
History Heritage Square
Hitchens & Trimper
Hites Chapel Estates
Hites View Estates
Hoadly Falls
Hoars Addition
Hobbits Glen
Hobe Heights
Hobe Hills
Hobe Sound
Hobe Sound Golf Club
Hobe Sound Golf Club 01 & 02
Hobe Village Mobile Home Park
Hockessin Chase
Hockessin Glen
Hoes Heights
Hoffman Heights
Hoffmans Subdivision And Lake View Addition Replat
Hofman Add
Hokum
Holabird Park
Holbrook Estates
Hole In One Circle
Holeusa Estates
Holgate
Holiday Acres
Holiday Beach
Holiday City
Holiday City - Berkeley
Holiday City - Carefree
Holiday City - Holiday Heights
Holiday City - South
Holiday City - West
Holiday City At Boca Raton Sec 5
Holiday City At Boca Raton Sec 7
Holiday Estates 1st Addn
Holiday Harbor
Holiday Hill
Holiday Hills
Holiday Isle Yacht Club Condo
Holiday Lake Area
Holiday Lake Estate
Holiday Out At St Lucie Inc
Holiday Out At St Lucie S
Holiday Out At St Lucie Sec B
Holiday Out At St Lucie Section B
Holiday Park 1 Condo
Holiday Pines
Holiday Pines Subdivision
Holiday Pines Subdivision Phase Iib
Holiday Pines Subdivision Phase Iii
Holiday Plantation
Holiday Pocono
Holiday Springs
Holiday Springs At Suntree
Holiday Springs East
Holiday Springs Village
Holiday Springs Village 1
Holiday Springs Village 1 Condo
Holiday Springs Village 2
Holiday Springs Village 2 Condo
Holiday Springs Village 3
Holiday Springs Village 3 Condo
Holiday Springs Village 4
Holiday Springs Village 4 Condo
Holiday Springs Village 6
Holiday Springs Village 6 Condo
Holiday Springs Village A
Holiday Springs Village S
Holiday Springs Village Sec 3
Holiday Springs Village Sec 5
Holiday Village
Holiday Village E
Holiday Village Of Coral Springs
Holiday Village Sec One
Holiday Village Sec Two
Holladay
Holladay Co Addn
Holland Acres
Holland Cliff Shores
Holland Hill
Holland Point
Holland Preserve
Holland Sub No 2
Holland Township
Hollaway Estates
Holleman Manor
Holleman Manor 2nd Rev
Holleman Manor Addn
Holleman Manor No 2 2nd A
Holleman Manor No 2 2nd Am
Holleman Park
Holleman Park Pb 8-23
Holler
Hollerich Subd
Holleybrooke
Holleybrooke/Cobblestone
Hollin Hall Village
Hollin Hills
Hollindale
Hollingsworth
Hollington
Hollington At The Pointe
Hollins Market
Hollow Tree Farm
Holloway Add To 2nd Add Belle Glade
Holloway Beach
Holloway Terrace
Hollows
Hollows / Polo Club
Holly Acres
Holly Brook
Holly Court At Woodmont
Holly Creek
Holly Creek Sub
Holly Estates
Holly Gaf Acres
Holly Glen
Holly Hill
Holly Hill Condominiums
Holly Hill Estates
Holly Hill Harbor
Holly Hills
Holly House
Holly House Inc Condo
Holly House Inc Condo In
Holly Lake
Holly Lake Estates
Holly Lake Harbor
Holly Lake Resort
Holly Neck
Holly Oak
Holly Oak Tr Pk
Holly Oaks
Holly Park
Holly Pointe
Holly Ridge
Holly Shores
Holly Tree Acres
Holly Village
Holly Village Mobile
Holly Woods
Hollybrook
Hollybrook Condominiums
Hollybrook Estates
Hollybrook Golf
Hollybrook Golf &
Hollybrook Golf & Tennis
Hollybrook Golf & Tennis Club
Hollybrook Golf And
Hollybrook Golf And Tennis
Hollybrook Golf And Tennis Club
Hollybrook Golf&Tennis
Hollybrooke
Hollybrooke Cond
Hollyfield
Hollymead Town Center
Hollynoll
Hollytown 2
Hollyview
Hollywell
Hollywood
Hollywood 1-21 B
Hollywood Academic
Hollywood Acres
Hollywood Beach
Hollywood Beach First Add
Hollywood Beach Gardens
Hollywood Beach Heights Park
Hollywood Beach Heights S
Hollywood Beach Heights Sec
Hollywood Beach Park
Hollywood Beach Second Ad
Hollywood Beach Second Add
Hollywood Center
Hollywood Center Amen Pla
Hollywood Center Amen Plat
Hollywood Central Beach
Hollywood Country Club Di
Hollywood Country Estates
Hollywood East
Hollywood Estates
Hollywood Gardens
Hollywood Gardens Condomi
Hollywood Gardens Condominium I
Hollywood Golf Estates Se
Hollywood Golf Estates Sec Two
Hollywood Heights
Hollywood Heights Add Sec
Hollywood Heights Estates
Hollywood Highlands Park
Hollywood Hills
Hollywood Hills 1965
Hollywood Hills 6-22 B
Hollywood Hills Amen Plat
Hollywood Hills North Sec
Hollywood Hills North Sec One
Hollywood Hills Park
Hollywood Hills Second Ad
Hollywood Homesites High
Hollywood Homesites Secon
Hollywood Lake
Hollywood Lakes Country C
Hollywood Lakes Country Club And
Hollywood Lakes Sec
Hollywood Lakes Section
Hollywood Lakes Section 1
Hollywood Lawns
Hollywood Little Ranches
Hollywood Little Ranches 1
Hollywood On The Hill
Hollywood Parc Condominiu
Hollywood Parc Condominium
Hollywood Park
Hollywood Park 4-19 B
Hollywood Pines 2 Amend
Hollywood Pines No 2 Amen
Hollywood Ridge Farms
Hollywood Shores
Hollywood South Side
Hollywood South Side Add
Hollywood South Side Add No 2
Hollywood Station
Hollywood Station Res Con
Hollywood Station Res Condo
Hollywood Suburbs No 2
Hollywood Terr No 2
Hollywood Terrace
Hollywood Terrace Amen Pl
Hollywood Terrace Amen Plat
Hollywood Towers Condo
Hollywood View
Hollywoods
Hollywoods Point
Holmberg & Mc Kees
Holmberg & Mc Kees Sub 1-
Holmdel
Holme Circle
Holmehurst Estates
Holmehurst South Plat On
Holmes Run Crossing
Holmes Run Woods West
Holmes-Foster
Holmesburg
Holt Est
Holt Estate In
Holtwood
Homberg
Home Acres
Home Acres Revised Plat Of Unit 2
Home Beautiful Park
Home Farm
Home Owners Paradise
Home Place
Home Place Subdivision
Home Tower Condo
Home Towne Square
Homedale
Homeland
Homeland As In
Homeland Historic District
Homeland Park
Homeland Southway
Homeland Village
Homelands
Homeplace At Riverside
Homeplace On Pelhams Reach
Homeport Farm
Homes At Lawrence 2
Homes At Sheridan Ocean Club
Homes Of Lees Crossing 2
Homes Of Lees Crossing 3
Homestead
Homestead Acres
Homestead At Hamilton
Homestead Lakes Farmlife
Homestead Lakes Tennessee
Homestead Mobile Home Park
Homestead Park Of Commerc
Homestead Rev Map
Homestead Village
Hometown
Homewood
Homewood 4th Add
Homewood Addition
Homewood Lakes Sec B-2
Homewood Lakes Sec D
Homriv Subdivision
Honey Brook
Honey Brook Boro
Honey Brook Manor
Honey Hill
Honey Hill Park
Honey Run
Honey Valley Estates
Honeycroft Village
Honeygo Village
Honeyhill Ests Sec 2 1st
Honeysuckle Hill
Honeywood
Honeywood On The Potomac
Hood
Hood College
Hooks
Hooper
Hoopers Island
Hoopersville
Hoopes
Hoopys Addition
Hoosier Heights
Hoot Owl Estates
Hoover Mountain
Hooverville
Hope Hill Crossing
Hope Valley
Hope Valley Hills
Hopewell Grant
Hopewell Hunt
Hopewell Parc
Hopewell Pointe
Hopewell Ridge
Hopewell Township
Hopewell Twp
Hopewell Woods
Hopewells Landing
Hopkins
Hopyard Farm
Hopyard Farm Subd
Horizon Condo
Horizon East Condo
Horizon Hill
Horizon Hills
Horizon House
Horizon House Condo
Horizon On The Bay Condo
Horizon West Condo
Horizons Of Boca Lago Con
Horizons Of Boca Lago Condo
Horizons Of Inverrary
Horizons Of Inverrary Con
Horizons Of Inverrary Condo
Horizons West
Horizons West Condo #2
Horizons West Condo #3
Horizons West Condo #4
Horizons West Condo #5
Horizons West Condo #7
Horizons West Condo #8
Horizons West Condo #9
Horns Point
Horse Country
Horse Creek At Crosswinds
Horse Farm Court
Horse Valley
Horseshoe Acres
Horseshoe Acres West
Horseshoe Acres West Repl (Steeplechase)
Horseshoe Bend
Horseshoe Condominium
Horseshoe Point
Horshamtowne
Host Crossings
Hotel Condominium At Cheeca Lodge, Bldgs 1 8 (6
Hotel Reservation
Hough
House Of Wellness
Houston Acres
Houston Heights
Hovianna Viii Condo
Howard
Howard Crk Estates
Howard Manor
Howard Park
Howard Pines
Howard Pk 1st Addn
Howard Square
Howells Subdivision
Howes Landing
Hoy Road Lots
Hoyles Mill Village
Hp1 Holopaw
Hp101 Holopaw
Hp105 Holopaw
Hp106 Holopaw
Hp107 Holopaw
Hp109 Holopaw
Hp113 Holopaw
Hp114 Holopaw
Hp116 Holopaw
Hp117 Holopaw
Hp118 Holopaw
Hp126 Holopaw
Hp127 Holopaw
Hp130 Holopaw
Hp131 Holopaw
Hp133 Holopaw
Hp165 Holopaw
Hp166 Holopaw
Hp167 Holopaw
Hp168 Holopaw
Hp170 Holopaw
Hp171 Holopaw
Hp173 Holopaw
Hp174 Holopaw
Hp175 Holopaw
Hp177 Holopaw
Hp181 Holopaw
Hp186 Holopaw
Hp189 Holopaw
Hp190 Holopaw
Hp191 Holopaw
Hp193 Holopaw
Hp195 Holopaw
Hp196 Holopaw
Hp198 Holopaw
Hp200 Holopaw
Hp201 Holopaw
Hp202 Holopaw
Hp205 Holopaw
Hp206 Holopaw
Hp207 Holopaw
Hp209 Holopaw
Hp210 Holopaw
Hp211 Holopaw
Hp213 Holopaw
Hp214 Holopaw
Hp217 Holopaw
Hp218 Holopaw
Hp22 Holopaw
Hp220 Holopaw
Hp221 Holopaw
Hp223 Holopaw
Hp224 Holopaw
Hp225 Holopaw
Hp226 Holopaw
Hp227 Holopaw
Hp228 Holopaw
Hp233 Holopaw
Hp236 Holopaw
Hp237 Holopaw
Hp238 Holopaw
Hp239 Holopaw
Hp242 Holopaw
Hp243 Holopaw
Hp245 Holopaw
Hp246 Holopaw
Hp247 Holopaw
Hp248 Holopaw
Hp25 Holopaw
Hp250 Holopaw
Hp250 Holopaw
Hp251 Holopaw
Hp252 Holopaw
Hp253 Holopaw
Hp254 Holopaw
Hp255 Holopaw
Hp256 Holopaw
Hp257 Holopaw
Hp258 Holopaw
Hp259 Holopaw
Hp260 Holopaw
Hp261 Holopaw
Hp262 Holopaw
Hp263 Holopaw
Hp264 Holopaw
Hp265 Holopaw
Hp266 Holopaw
Hp267 Holopaw
Hp268 Holopaw
Hp269 Holopaw
Hp270 Holopaw
Hp271 Holopaw
Hp272 Holopaw
Hp274 Holopaw
Hp275 Holopaw
Hp34 Holopaw
Hp35 Holopaw
Hp46 Holopaw
Hp49 Holopaw
Hp6 Holopaw
Hp7 Holopaw
Hp70 Holopaw
Hp72 Holopaw
Hp74 Holopaw
Hp75 Holopaw
Hp77 Holopaw
Hp79 Holopaw
Hp82 Holopaw
Hp83 Holopaw
Hp84 Holopaw
Hp88 Holopaw
Hp90 Holopaw
Hp91 Holopaw
Hp93 Holopaw
Hp94 Holopaw
Hp96 Holopaw
Hpe5 Highlands Park Estates
Hub Court East
Hudelsons Forest
Hudson Ridge
Hudson Ridge Sub
Hudson Valley
Hudson Village
Hudson/Neck District
Hugger
Hugger Tract
Hughesville
Hughesville Manor Sub
Hulmeville Terr
Humbird Addition
Hume
Hume Springs
Hummelstown Borough
Hungarian Mont Tabor
Hungerford
Hungerford Manor
Hunt At Lake Fairfax
Hunt At Louviers
Hunt Club
Hunt Club Condos
Hunt Club Estates
Hunt Country Estates
Hunt Meadow
Hunt Ridge Preserve
Hunt Tract
Hunt Valley
Hunt Valley Estates
Huntcrest Condominium
Hunter Estates
Hunter Land
Hunter Mill Estates
Hunter Run
Hunter Woods
Hunter's Crest
Hunter's Run
Hunter's Square
Hunters Chase Of Palm Beach Polo & Count
Hunters Creek
Hunters Creek Farm
Hunters Crossing
Hunters Glen
Hunters Greene
Hunters Grove
Hunters Hill
Hunters Knoll
Hunters Lodge
Hunters Manor Resub
Hunters Manor Rev Plat Of
Hunters Manor Rev Plat Of Por
Hunters Mill
Hunters Mill Estates
Hunters Pointe
Hunters Pointe Whcc
Hunters Pond
Hunters Ridge
Hunters Ridge Estates
Hunters Run
Hunters Run Village
Hunters Square
Hunters Trace
Hunters Valley
Hunters Valley Minchews
Hunters Woods Village
Hunters Xing Sub
Hunterwood
Huntfield
Hunting Creek Club Condominiums
Hunting Creek Woods
Hunting Hills
Hunting Hills Estates
Hunting Park
Hunting Ridge
Hunting Ridge Condominium
Hunting Ridge Historic District
Hunting Run Estates
Hunting Run Landing
Huntingdon Brook
Huntingdon Hills
Huntingdon Place
Huntingdon Reserve
Huntingdon Valley
Huntington
Huntington At Mt Vernon
Huntington Club
Huntington Crossing
Huntington Estates
Huntington Hills
Huntington Lake
Huntington Lakes
Huntington Lakes 2
Huntington Lakes Sec Five
Huntington Lakes Sec Five Condos
Huntington Lakes Sec Four Condos
Huntington Lakes Sec One
Huntington Lakes Sec One And Sec 1-A Condo
Huntington Lakes Sec One Condos
Huntington Lakes Sec Three Condos
Huntington Lakes Sec Two
Huntington Lakes Sec Two Condos
Huntington Meadows
Huntington On The Green Co
Huntington Pointe
Huntington Towers Condo
Huntington Walk
Huntington Walk 1
Huntington Walk Pod H
Huntington Woods
Huntland Homes Of Leesbu
Huntleigh
Huntleigh At Creighton Farms
Huntley Square
Huntley Square Condominiums
Huntsberry
Huntsman Condo
Huntsmoor
Huntsmoor Village North
Huntwell West
Hurley Heights
Hurley Ridge
Hurlingham Condo
Hurlock
Hurricane Cove
Hutchins Choice
Hutchinson House East
Hutchinson House West Condo
Hutchinson Island
Hutchinson Island Club
Hutchinson Sub
Huyetts Area
Hwy 441 Se Frontage
Hyacinth-Hampton Hall Hwy
Hyattsville
Hyattsville Arts District
Hyattsville Hills
Hybla Valley Farms
Hyde
Hyde Beach House
Hyde Beach Resort
Hyde Midtown
Hyde Park
Hyde Park First Sec
Hyde Park Manor
Hyde Park Overlook
Hyde Park Towers Condo
Hyde Resort And Residences
Hyder Agr Pud Pl 1
Hyder Agr Pud Pl 3
Hyder Agr Pud Pl 5
Hyder Agr Pud Pl 6
Hyder Agr Pud Pl 7
Hyder Agr Pud South Plat
Hyder Agr Pud South Plat Eight
Hyder Agr Pud South Plat Five
Hyder Agr Pud South Plat One
Hyder Agr Pud South Plat Three
Hyder Agr Pud South Plat Two
Hydes
Hydra Villas At Samari
Hyetts Crossing
Hygate
Hyland Trail
Hyndman
Hynesboro Park
Hypoloxo Island
Hypoluxo Beach Map
Hypoluxo Haverhill Pud 1
Hypoluxo Haverhill Pud 2
Hypoluxo Island Add
Hypoluxo Island Add 2
Hypoluxo Park
Hypoluxo Ridge
Hypoluxo Village 1
Hypoluxo Village 2
Hypoluxos Mariners Cay
Hypoluxos Mariners Cay Co
Hypoluxos Mariners Cay Condo
Hyson
Hythe At Century Village Condo
I P T Sub
Ibec Add No 3
Ibec Addition No 7
Ibec Neighborhood No 1
Ibis - Orchid Reserve
Ibis - The Grande
Ibis Gof & Country Club
Ibis Golf & Country Club
Ibis Golf & Country Club - Orchid Hammock
Ibis Golf & Country Club - Quail Meadow
Ibis Golf & Country Club - The Woodlands
Ibis Golf And Country Club - Hawk's Landing
Ibis Golf And Country Club - Heritage Club
Ibis Golf And Country Club - Legend Club
Ibis Golf And Country Club - Quail Meadow Way
Ibis Golf And Country Club - Sandpiper Cove
Ibis Golf And Country Club - Terra Lago
Ibis Golf And Country Club - The Preserve
Ibis Golf And Country Club - The Woodlands
Ibis Golf And Country Club 11
Ibis Golf And Country Club 12a
Ibis Golf And Country Club 16
Ibis Golf And Country Club 18
Ibis Golf And Country Club 19
Ibis Golf And Country Club 22
Ibis Golf And Country Club 24
Ibis Golf And Country Club 29
Ibis Golf And Country Club 30
Ibis Golf And Country Club 31
Ibis Golf And Country Club 33
Ibis Golf And Country Club 34
Ibis Golf And Country Club 4
Ibis Golf And Country Club 5
Ibis Golf And Country Club 7
Ibis Isle
Ibis Landing
Ibis-Orchid Reserve
Ibiza
Ibiza Condo Phase Ii
Icon Bay
Icon Bay Condo
Icon Beach Residences
Icon Brickell
Icon Brickell Condo
Icon Brickell Condo No 1
Icon Brickell Condo No 3
Icon Brickell Condo One
Icon Brickell No Two
Icon Brickell Tower 1
Icon Condo
Iconbrickell Condo
Iconbrickell Condo No 1
Ida Palmer
Idalia
Ideal Homes Sub
Ideal Homes Sub No 3
Ideal Homes Sub No 4
Ideal Homes Sub No 7
Idlewild At Belair
Idlewild Park
Idlewilde Acres
Idlewood
Idlewood Acres
Idlewyld
Idlewyld 1-19 B
Idlewyld Resub Blks 8 To 11
Idlewylde
Idyllwood
Idylwood
Idylwood Hill
Idylwood Towers
Idylwood Towers Condo
Igi Subdivision
Il Villaggio
Il Villaggio On South Bea
Il Villaggio On South Beac
Ile1 Interlachen Lakes Estates
Ile13 Interlachen Lakes Estates
Ile16 Interlachen Lakes Estates
Ile17 Interlachen Lakes Estates
Ile2 Interlachen Lakes Estates
Ile21 Interlachen Lakes Estates
Ile22 Interlachen Lakes Estates
Ile24 Interlachen Lakes Estates
Ile27 Interlachen Lakes Estates
Ile28 Interlachen Lakes Estates
Ile29 Interlachen Lakes Estates
Ile31 Interlachen Lakes Estates
Ile4 Interlachen Lakes Estates
Ile41 Interlachen Lakes Estates
Ile42 Interlachen Lakes Estates
Ile43 Interlachen Lakes Estates
Ile44 Interlachen Lakes Estates
Ile48 Interlachen Lakes Estates
Ile5 Interlachen Lakes Estates
Ile6 Interlachen Lakes Estates
Illini Association
Illini Condo
Illustre Village Condo
Images Condo
Images Of Kendall Condo
Imagination Farms East
Imber Subd
Imp2 Imperial Acres
Imp31 Imperial Acres
Imp58 Imperial Acres
Imp7 Imperial Acres
Imperial At Promenade Condo
Imperial Embassy
Imperial Gardens
Imperial Group
Imperial House Codno
Imperial House Condo
Imperial House Inc
Imperial Orchards
Imperial Point
Imperial Point 1
Imperial Point 1 Sec
Imperial Point 2 Sec
Imperial Point 3rd Sec
Imperial Point 4th Sec
Imperial Point 5 Sec
Imperial Point 5 Sec 60-4
Imperial Point Colonnades
Imperial Point Colonnades Condo
Imperial Point Condo
Imperial Point Gardens Co
Imperial Point Gardens Condo
Imperial Terraces Condo
Imperial Towers
Imperial Towers Apts Cond
Imperial Towers Condo
Imperial Towers North Con
Imperial Village Condo
Imperial Villas Condo
Imperial Westbury Co-Op
Independence
Independence Bay
Independence Pl
Independence Place
Independence Shores
Independence Square
Independency Sub
Independent Hill
Indian Acres
Indian Bay Point
Indian Beach
Indian Country
Indian Cr Cl Marina Condo
Indian Cr Cl Marina Condo North
Indian Creek
Indian Creek - Augusta
Indian Creek Cl Marina Co
Indian Creek Estate
Indian Creek Estates
Indian Creek Mhp
Indian Creek Ph Iii-B
Indian Creek Ph Iv-B
Indian Creek Plat 3
Indian Creek Plat 7
Indian Falls
Indian Forest
Indian Groves
Indian Hammock Hunt & Riding C
Indian Hammock Hunt And Riding
Indian Hammock Hunt And Riding Club
Indian Harbor Villas
Indian Harbour Beach Sec 7
Indian Head Manor Sub
Indian Head Sec 1
Indian Hill
Indian Hills
Indian Hills/ The Grove
Indian Knolls
Indian Lake
Indian Lake Esates
Indian Lake Est
Indian Lake Estate
Indian Lake Estates
Indian Lake Estates Unid
Indian Lake Estates Unidad
Indian Lake Estates Unit 0
Indian Lake Estates Unit 01
Indian Lake Estates Unit 02
Indian Lake Estates Unit 03
Indian Lake Estates Unit 06
Indian Lake Estates Unit 07
Indian Lake Estates Unit 09 Revised
Indian Lake Estates Unit 1
Indian Lake Estates Unit 11
Indian Lake Estates Unit 13
Indian Lake Estates Unit 2
Indian Lake Estates Unit 3
Indian Lake Estates Unit 6
Indian Lake Estates Unit 9 Revised
Indian Lake Estates Unit03
Indian Lk Village Phase 1
Indian Meadows
Indian Mills
Indian Mound Park
Indian Mound Trails
Indian Mountain Lake
Indian Mountain Lakes
Indian Mountainlakes
Indian Mtn. Lakes
Indian Oaks
Indian Oaks Subdivision
Indian Pines
Indian Pines Condo
Indian Pines Condo All Ph
Indian Pines Village
Indian Point Ph 01
Indian Point West
Indian Pond
Indian Queen
Indian Ridge
Indian River Acres
Indian River Club
Indian River Club Plat 1
Indian River Club Plat 4
Indian River Club Plat 5
Indian River Club Plat 6
Indian River Club Plat 6 Carolina South
Indian River Club Plat No 7 Oak Hammock
Indian River Estates
Indian River Estates Unit
Indian River Estates Unit 02
Indian River Estates Unit 1
Indian River Estates Unit 7
Indian River Estates Unit 8
Indian River Estates Unit 9
Indian River Estates-Unit 07- Blk 52 Lot 39 (Map 3
Indian River Farms
Indian River Farms Co Sub
Indian River Farms Compan
Indian River Farms Company
Indian River Farms Company S/D
Indian River Heights Unit 4
Indian River Highlands Blk 2
Indian River Hundred
Indian River Landing
Indian River Oaks Subd
Indian River Park
Indian River Place, A Condominium
Indian River Plantation Es
Indian River Shores Unit 1
Indian River Waterfront
Indian Rocks
Indian Spring
Indian Spring 1
Indian Spring 7
Indian Spring 9
Indian Spring Hampton Fairways
Indian Spring Park
Indian Spring Terrace
Indian Springs
Indian Summer Vilg Condo
Indian Summer Village Ii
Indian Town Farms
Indian Trail Villas
Indian Valley Greens
Indian Village Ind Head
Indian Waterways
Indian Wells
Indian Wells Unit 8
Indiana Grove Condo
Indiana Lake Estates Lot 15
Indiana Park
Indiantown
Indianwood G & Cc
Indianwood G&Cc
Indianwood Golf & Cc
Indianwood Golf & Country Club
Indigo
Indigo Pointe
Industrial Labelle
Industrial Railroad Sub
Infante Plat
Infinity At Brickell
Infinity At Brickell Cond
Infinity At Brickell Condo
Ingalls Tracts
Ingham Mews
Ingleside
Ingleside Park
Ingleside Park 1st Addn
Ingleside Park Rev
Ingleside Village
Inglewood Gardens
Inglewood Gdns
Ingram Village
Ingrams Point
Inlet At Sebastian Condo
Inlet Beach Club Condo
Inlet Beach Club West Condo
Inlet Cay
Inlet City
Inlet Cove
Inlet Grove
Inlet House
Inlet House Condominium
Inlet Palms Planned Dev
Inlet Palms Planned Development
Inlet Plaza Condo
Inlet Pointe Condo
Inlet Shores
Inlet Shores At Riviera
Inlet Village
Inlet Village South Condo Ph 02 Irp
Inlet Waters
Inlikita Sec A
Inman Grvs Ph 2
Inn Park
Inner Harbor
Innisbrooke/Linton Crest
Inniscrone View
Innisfree
Innovation Town Center
Inspire 55+ At Legacy Park
Int In Common Elements
Intag Gardens 2nd Addn
Interim-Await Specific Zo
Interlachen Gardens
Interlachen Lakes
Interlachen Lakes Estates
Interlachen Lakes Estates, Frederick Town Unit 16
Interlachen Lakes Estates, Frederick Town Unit 17
Interlachen Lakes Ests
Interlachen Lakes Ests, Fl
Interlachen Villas
Interlaken
Interlude
International Condo
International Gardens
International Park Condo
International Park I Cond
International Princess Co
International Studio Apt
International Studio Apt Condo
International Towers Cond
International Village
International Village At
International Village At Inverrary
Interstate Dev Co
Intl Lake Villas Condo #4
Intracoastal 31 Condo
Intracoastal Condo
Intracoastal House Condo
Intracoastal Park
Intracoastal Point Condo
Intracoastal Terrace Condo
Intracoastal Tower
Intracoastal Waterway
Inverness
Inverness Acres Unit 2
Inverness At Sprin
Inverness Forest
Inverness Highlands
Inverness Highlands Unit
Inverness Highlands Unit 3
Inverness Highlands Unit 4
Inverness Highlands Unit03
Inverness Knolls
Inverness Sub
Inverness Village Unit 03
Inverness Village Unit 3
Inverrary 32
Inverrary 32 Sec Three
Inverrary 32 Section Two
Inverrary C C Ph Iv
Inverrary Country Club
Inverrary Gardens Condo I
Inverrary Village
Inverwood Condo
Investor Contractor Specia
Inwood Meadows
Inwood Village
Iona
Ios On The Bay Condo
Irenca Sub
Irene Plaza
Irish Acres
Irish Hills
Iron Bridge Landing
Iron Hill
Iron Mill Townes
Iron Valley Estates
Irongate
Ironhorse
Ironhorse Par B-1
Ironhorse Par B-2
Ironhorse Par C
Irons Lane
Irons Manor 1st Addn
Irons Manor 2nd Addn
Irons Manor 3rd Addn
Irons Manor 4th Addn
Irons Manor 5th Addn
Irons Manor A
Irons Manor High Pine Add
Irons Manor High Pines Ad
Ironville
Ironwedge
Ironwedge Sec Ii
Ironwood
Ironwood Mariner Sands
Iroquois Park
Irvington
Irvington Gardens Condo
Irwin E Steele
Irwins Choice
Isabella At Monticello Mews
Iselin
Isla Bahia
Isla Cabra
Isla Del Mar Condo
Isla Grande
Isla Merita
Isla Merita Condominium I
Islamorada
Islamorada South
Islamorada, Townsite Of
Island
Island Beach Club, A Condominium
Island Breakers Condo
Island Breeze At Deerfiel
Island Club
Island Club 1
Island Club 2 Condo
Island Club Condo
Island Club Four Condo
Island Club Of South Beac
Island Club Of South Beach
Island Club Of Vero Beach Sub Phase I
Island Club One Condo
Island Club Riverside
Island Club The
Island Club Three Condo
Island Club Three Condominium
Island Club Two Condo
Island Creek
Island Creek Neck
Island Crest
Island Crest Condo
Island Dunes
Island Dunes Oceanside Condo Ii
Island Dunes Oceanside Condominium Ii
Island Dunes Oceanside Ii
Island Enclave
Island Estates
Island Estates Subd
Island Heights
Island Hill
Island House
Island House Apt Inc - Co
Island House Condo
Island House Condominium Phase I
Island House Condominium Phase Ii
Island House Condominium Phase Iii (Bldg X)
Island House Condominium Phase Iii (Bldg Xi)
Island House Northeast Condo Apts,
Island House Southwest Condo
Island Lakes Sec 1 3
Island Manor Condo - Sout
Island Of Happiness
Island Of Key Largo Point
Island Of River Bridge
Island Place At Bay Harbo
Island Place At North Bay
Island Point Condo
Island Point South Condo
Island Pointe Condo
Island Pointe Condominium
Island Rd Dev Rev
Island Shores Condo
Island Terrace Condo
Island Towers Inc Condo
Island View
Island View Addn
Island Village Phase Ii
Island Way
Island Woods
Islander Co-Op
Islander Condo Apts
Islandia
Islandia I
Islandia I Condo
Islandia I Condominium
Islandia Ii Condo
Islandia Ii Condominium
Islands At Doral
Islands At Doral 1st Addi
Islands At Doral 1st Addition
Islands At Doral 1st Addn
Islands At Doral Northwes
Islands At Doral Townhome
Islands End
Islands Martinique
Islands-Bermuda Condo
Islands-Jamaica Condo
Islands-Martinique Condo
Islas Canarias Homes
Isle De La Maison
Isle Of Boca Dunes 3
Isle Of Madeira At Kings Isle
Isle Of Normandy Miami Vi
Isle Of Normandy Miami View Sec
Isle Of Normandy Trouvill
Isle Of Normandy-Miami View Sec
Isle Of Paradise Co-Op
Isle Of Paradise Co-Op E
Isle Of Paradise Co-Op F
Isle Of Sandalfoot Condo
Isle Of Sandalfoot Condo 4
Isle Of Venice
Isles Addition
Isles At Grand Bay
Isles At Lago Mar
Isles At Lago Mar Condo
Isles At Palm Beach Gardens
Isles At Waterway Village Pd Plat 1b
Isles At Waterway Village Pd Plat 1c Rep Lat No 1
Isles At Wellington
Isles At Wellington / The Estates
Isles At Wellington 1
Isles At Wellington 3
Isles At Wellington 4
Isles At Wellington 7
Isles At West Port Phase Ii
Isles At Weston
Isles Of Aberdeen East
Isles Of Boca
Isles Of Boca Condos
Isles Of Boca Condos One
Isles Of Capri
Isles Of Inverrary
Isles Of Inverrary I Condo
Isles Of Inverrary Ii Con
Isles Of Tuscany
Isles Of Windmill Ranch 1
Islesworth
Islewood A Condo
Islewood C Condo
Islewood D Condo
Isola Bella, Villages Of Windsor 3
Isola Cancun
Isola Condo
Italian Market
Ivanhoe East At Century V
Ivanhoe East At Century Village
Ivanhoe Estates
Ivanhoe West At Century V
Ivanhoe West At Century Vi
Iverson Mall
Iverson Square
Iverson Square Condominium
Iverson Village Condo
Ives Dairy Townhomes
Ives Estates Sec 1
Ives Estates Sec 2
Ives Estates Sec 4
Ives Estates Sec 5
Ivon Condo
Ivy City
Ivy Condo
Ivy Hill
Ivy Ridge
Ivymount Court
Ivywild
Ivywood
Ixora Park Plat No 7
J & S Park Estates
J A Freres Sub
J A Hudson
J A Smiths Sub
J G Heads Farms
J G Heads Farms Sub
J G Heads Farms Unit A
J L Waddy Sub
J N C Sub
J P Darlington
J R S Plat
J R Sub
J S Click Unrec Sub
J W Ewans Sub
J W Neeleys
J Wayne Adams
J.R. Ranchettes
Jabo
Jac-Mo Homes
Jacagua Arriba Santiago
Jacaranda
Jacaranda Area 12
Jacaranda Area 9
Jacaranda Area 981
Jacaranda Country Club West
Jacaranda Heights
Jacaranda Heights Condo
Jacaranda Lakes Sec 1
Jacaranda Lakes Section Eleven
Jacaranda Lakes Section Five
Jacaranda Lakes Section Nine
Jacaranda Lakes Section T
Jacaranda Parcel 101
Jacaranda Parcel 218
Jacaranda Parcel 252a
Jacaranda Parcel 253
Jacaranda Parcel 274
Jacaranda Parcel 480
Jacaranda Parcel 482
Jacaranda Parcel 541
Jacaranda Parcel 608
Jacaranda Parcel 610
Jacaranda Parcel 610 130-33
Jacaranda Parcel 611
Jacaranda Parcel 614
Jacaranda Prcl 252
Jacaranda Villas
Jacaranda Villas No 2 Con
Jackson
Jackson Arms Apt Condo
Jackson Hall
Jackson Heights
Jackson Hills
Jackson Manor
Jackson Park
Jackson Peacocks Sub
Jackson Peacocks Sub 3-18
Jackson Street
Jackson Street Lofts
Jackson Tower Las Olas Condo
Jackson Township
Jackson Twp
Jackson's Retreat
Jacksons Ridge
Jacksons Run
Jacksonville
Jacob Greasley
Jacobs Meadow
Jacobsville
Jade At Brickell Bay Drive
Jade Beach
Jade Beach Condo
Jade Beach Sunny Isles
Jade Brickell
Jade Condo
Jade Ocean Condo
Jade Residence At Brickell
Jade Residences
Jade Residences At Bricke
Jade Residences At Brickel
Jade Signature Condo
Jade Winds Group
Jade Winds Group -
Jade Winds Group Allamand
Jade Winds Group Allamanda Gardens
Jade Winds Group Bamboo G
Jade Winds Group Bamboo Gardens
Jade Winds Group-Daisy
Jade Winds Group-Daisy Ga
Jade Winds Grp Easter Lil
Jaffe Sub
Jaguar/Yorktown
Jahorina
Jai-Alai Heights
Jai-Alai Heights 1st Addn
Jai-Alai Heights No 2 A R
Jalappa
Jalil Subdivision
Jamaica Bay
Jamaica Bay Mobile Home C
Jamaica Bay Mobile Home Co Op
Jamaica Bay Mobile Home Co-Op
Jamaica House Condominium
Jamaica Lane In
Jamaica Manor Inc Lessee
James Central Towers Cond
James Creek
James Farm
James Lee
James Lee Condo
James P Cleary Sub
James Run Carriage Homes
James Run Townhomes
James Villa
Jamesburg Boro
Jamestown At Heritage Ridge Sec 02b
Jamestown Condo
Jamestowne Estates
Jamestowne Sub La Plata
Jamison Hunt
Jamison Place
Jane Apartments Condo
Janeta
Japonica
Jaragua Plaza Condo
Jardim Paulista
Jardin Del Mar
Jardin Del Mar Cond
Jardines De Caleta Xi
Jarguti Subdivision
Jarman Branch Estates
Jarret Hall Condo
Jarrettsville
Jasmin Acres
Jasmine At The Hammocks
Jasmine At The Hammocks 1
Jasmine Condo
Jasmine Lakes
Jasmine Lakes I Condo
Jasmine Lakes Ii Condo
Jasmine Villas
Jason
Jaxon Park
Jay Bob Sub Part No 2
Jayco Sub
Jd Butlers
Jeanart Park
Jeb Estates
Jeff Estates
Jeffers Glen
Jefferson Boro
Jefferson Chase
Jefferson Corners
Jefferson Corners Heritage Ridge
Jefferson County
Jefferson Court
Jefferson Court Condo
Jefferson Davis Hwy
Jefferson Davis Park
Jefferson Farms
Jefferson Manor
Jefferson Mews
Jefferson Of Coral Springs
Jefferson Park
Jefferson Park Condo
Jefferson Park Townhouse
Jefferson Place
Jefferson Place Condo
Jefferson Run
Jefferson Square
Jefferson Village
Jefferson Village Th
Jeffersonton
Jeffersonton Village
Jefferys
Jellison's Resubdivsion
Jellison's Subdivision
Jem Miami Wolrdcenter
Jem Miami Worldcenter
Jenada Isle
Jenada Villas
Jenada Villas 1 Add
Jenkins Creek
Jenkins Heights
Jenkins Orchard
Jenkins Park Estates (Unrecorded)
Jenkintown
Jenkintown Manor
Jennas Landing
Jennings
Jennings Cutler Estates S
Jennings Pond
Jensen Beach
Jensen Beach Cc Place 07 Lts 01-7
Jensen Beach Club Condo
Jensen Beach Country Club
Jensen Beach Golf & Country Club 02
Jensen Beach Golf And Country Club
Jensen Beach Homesites
Jensen Highlands 02
Jensen Park Estates
Jensen Village
Jerdone Island
Jericho Valley
Jersey City
Jersey Heights
Jesslyn Subdivision
Jessup Mill Estate
Jewell Kirby Keroher
Jewell M Ogden Plat
Jg Estates
Jigsaw Village
Jillshar-Darrylcar
Jim Thorpe Area
Jinama South Subdivision
Jo-Myrt Suites Condo As In Decl
Jockey Club Condo
Jockey Club Condo Unit Ii
Jockey Club Iii
Jockey Club Iii Condo
Joe Louis Farms
Joel Neighborhood
Joes Point
Jog Est
Joggers Run
John A Campbell Little Fa
John Brown Farm
John F Kennedy Estates Se
John Lynn
John Weigle Tract
Johns Composite
Johns Composite Minor 01
Johns Hopkins
Johns West Pud
Johnson & Waddells Addn
Johnson Beach
Johnson Estates
Johnson Heights
Johnson Village
Johnsons Sub
Johnsons Subdivision
Johnsonville
Johnston Heights
Johnston Square
Johnston Woodstock
Jolly Fields
Jomnel Terace
Jonas Mtn Phase 2
Jonathan Street Area
Jonathans Creek
Jonathans Landing
Jonathans Landing-Passage Islands 5
Jonel Terrace 6
Jonella Farm
Jones
Jones Lake
Jones Par A
Jones Par B
Jones Par C-1
Jones Par D-2
Jones Par D-3
Jones Station
Jonestown
Jonestown Borough
Jonesville Sub
Jonquil Gardens Condo
Joppa
Joppa Acres
Joppa Crossing
Joppa Vale
Joppa View
Joppatowne
Jordan Commons
Jordan Run Rd
Joron Plat
Josena Sub
Josephine
Joses Hideaway
Joshlee Subdivision
Joshua
Journey's End
Journeys End
Journeys End 1
Journeys End 3
Journeys End Estates
Joy Homes
Joyce Road
Joycia Apartments Condo
Joynerville
Juan Barron
Juana Subdivision
Juanella
Juanillo
Juanillo Bay
Jubilee Villas Condo
Judicial Court Condos
Judiciary Square
Judith Sound
Judson Mdws
Judy Manors
Julian
Jumeirah Bay Island
Jumeirah Golf Estates
Junction Square
June In Winter Sub
Junewood
Junewood Estates
Jungle Point In Pb16p97 And Jungle Point Rev
Juniata
Juniata Mills
Juniata Terrance
Junior Heights
Juniper At The Hammocks
Juno Bay Colony Condo
Juno Beach - Malbo
Juno Beach 1st Add
Juno Beach Condo
Juno By The Sea Condo Apts
Juno By The Sea North Con
Juno By The Sea North Condo
Juno By The Sea North The
Juno By The Sea North The Manor Condo
Juno By The Sea North The Surf Condo
Juno Dunes
Juno Heights
Juno Isles 1
Juno Ocean Condo
Juno Ocean Key
Juno Ocean Walk
Jupiter
Jupiter Bay
Jupiter Bay East
Jupiter Bay East Condo
Jupiter Bay One Thru Six Condo
Jupiter By The Sea
Jupiter By The Sea Condo
Jupiter Country Club
Jupiter Country Club Condo Ii
Jupiter Country Club Pod E
Jupiter Cove
Jupiter Cove Condo
Jupiter Cresta Unit 2
Jupiter Farms
Jupiter Farms & Groves
Jupiter Harbour
Jupiter Harbour - Bahama Condo
Jupiter Heights
Jupiter Highlands
Jupiter Hills Village
Jupiter I Phase 3
Jupiter In The Pines
Jupiter In The Pines Sec B
Jupiter In The Pines Sec D
Jupiter Inlet Beach Colony
Jupiter Inlet Condo
Jupiter Island
Jupiter Island - Bon Air Beach
Jupiter Island Hobe Sound
Jupiter Key
Jupiter Lakes Townhomes
Jupiter Narrows
Jupiter Oaks As
Jupiter Ocean & Racquet Club
Jupiter Ocean And Racquet Club
Jupiter Ocean And Racquet Club One Condo
Jupiter Ocean And Racquet Club Tennis Villa 1,2,3,
Jupiter Ocean Grande
Jupiter Plantation
Jupiter Plantation First Add
Jupiter Plantation Ph Ii
Jupiter Plantation Ph Iii
Jupiter River Estates
Jupiter River Estates Add
Jupiter River Estates Replat
Jupiter River Park Condo
Jupiter Townsite
Jupiter Village Ph Iii
Jupiter Yacht Club
Jupiter Yacht Club Marina Condo
Jupiter-Palm Bch Motor Coach R
Justa Farms
Justison Landing
K B Raulerson's Addition To Fort Pierce
K F
K Hovnanian Four Seasons
K S Park
K-Legacy
K. Hovnanian's Four Seasons At Virginia Crossing
K. Hovnanian's Four Seasons At Wylder
Kahlua Gardens Condo
Kai At Bay Harbor Condo
Kalorama
Kalorama Triangle
Kalorama/Adams Morgan
Kalten Acres
Kangaroo Plat
Kanner Lake (Aka Willow Pointe)
Kansas City Colony
Kaphoe
Kapok Grove Estates
Karanda Village
Karanda Village 1- C Cond
Karanda Village I-B Condo
Karanda Village I-C Condo
Karanda Village I-D Condo
Karanda Village Ii-B Condo
Karanda Village Iii-A Condo
Karanda Village Iii-B Condo
Karanda Village Iii-E Condo
Karanda Village Iv-A Condo
Karanda Village Iv-B Cond
Karanda Village Iv-B Condo
Karanda Village Iv-C Cond
Karanda Village V-A Condo
Karanda Village V-B Condo
Karanda Village Vi-A Condo
Karanda Village Vi-B Condo
Karanda Village Vi-C Cond
Karanda Village Vii-A Con
Karanda Village Vii-A Condo
Karanda Village Vii-B Con
Karanda Village Vii-D Con
Karibana Beach & Golf
Karibao
Karisa Gardens Condo
Karlan Townhouses Sub
Karnegis Sub
Kaska
Kastle Estates
Kawama Tower
Kawama Yacht Club
Kawan Acres
Kaybe Tulum
Kayla S Place
Kays Est
Kaywood
Kaywood North Estates
Kearneysville
Keedysville
Keen-Wik
Keene Mill Woods
Keene Mill Heights
Keene Mill Station
Keene Mill Village
Keene Mill Woods
Keenwick Sound
Kell Mill Terrace
Kellerton
Kelley Estates
Kelly Glen
Kelly Header Canal
Kellys Landing
Kelsey Acres 2
Kelsey City
Kemp Mill
Kemp Mill Estates
Kemp Mill Farms
Kemper Park
Kempinski Residences
Kemptown
Ken Gar
Ken Mae Garden Condo
Ken-Dade No 2 Condominium
Ken-Lee Gardens Condo
Kenbargan
Kendal Park
Kendal Pines
Kendal Ranches
Kendalaire Villas Condo
Kendale
Kendale Best No 2
Kendale Country Club Ests
Kendale Lakes North Sec 2
Kendale Lakes North Sec 4
Kendale Lakes North Sec 9
Kendale Lakes Sec 4
Kendale Lakes Sec Eight
Kendale Lakes Sec Five
Kendale Lakes Sec One
Kendale Lakes Townhouse C
Kendale Lakes West Townho
Kendale Lk Townhouse Cond
Kendale Oaks
Kendale Park
Kendale Royal Amend
Kendale Sec 2
Kendale South Sec 2 Part
Kendale South Sec 3 Part
Kendale Woods North Condo
Kendall
Kendall Park
Kendall Acres Condo Bldg
Kendall Acres West Condo
Kendall Asseemblage South
Kendall Assemblage
Kendall Assemblage South
Kendall Assemblage North
Kendall Assemblage Sotuh
Kendall Assemblage South
Kendall Assemblaje
Kendall Breeze
Kendall Breeze South
Kendall Building
Kendall Center
Kendall Commons Residenti
Kendall Commons Townhomes
Kendall Country Estates
Kendall Estates
Kendall Family Estates Ph
Kendall Gate Condo
Kendall Green Sec
Kendall Green Sec D 51-6
Kendall Green Sec E
Kendall Greens Condo
Kendall Heights
Kendall Heights Condo
Kendall Knolls
Kendall Lake Addition
Kendall Lake Towers Condo
Kendall Lks E Lakeview Th
Kendall Park Estates
Kendall Park Estates 2nd
Kendall Place
Kendall Point 2nd Addn
Kendall Ridge
Kendall Springs
Kendall Square
Kendall Sunset Homes
Kendall Trace Condo
Kendall Village Townvilla
Kendall West
Kendalland
Kendallwood
Kendallwood Pines
Kendalwood Estates
Kendalwood Pines
Kenemuth W H
Kenilwood
Kenilworth
Kenilworth At Belair
Kenilworth Condo
Kenilworth Estates
Kenilworth Park
Kenland Bend North Condo
Kenland Bend South Condo
Kenland Homes
Kenland Pointe Condo #1
Kenland Pointe Condo Ii
Kenland Pointe Condo Iii
Kenland Walk Condo Ii
Kenland Walk Condo Iii
Kenland Walk Condo Iv
Kenlin Village
Kenmanor
Kenmoor
Kenmore Farms
Kenmore Townhome
Kennebec
Kennedy House Condo
Kennedy Terrace Subdivision
Kennedyville
Kennersley Farm
Kennett Pointe
Kennett Sq
Kenridge
Kensington
Kensington At Woodfield Country Club
Kensington Court
Kensington Courts
Kensington Estates
Kensington Gardens
Kensington Heights
Kensington Hill
Kensington Knolls
Kensington Manor
Kensington Of Royal Palm Beach Condoi
Kensington Park
Kensington Place
Kensington Sec 05
Kensington South
Kensington Square
Kensington Terrace
Kensington View
Kensington Villas
Kensington Walk Condo
Kent
Kent Acres
Kent Condominiums A Thru N
Kent Condos
Kent County
Kent Cove
Kent Estates
Kent Gardens
Kent Island Estates
Kent Point
Kent Point Farm
Kent Village
Kentfield
Kentland
Kentland Farms
Kentland Pond
Kentlands
Kentlands Midtown
Kentlands View
Kentmore Park
Kentmorr
Kentmorr Airpark
Kents Island 15-22 B
Kentucky Springs
Kentview Estates
Kentwood Of Wedgewood Con
Kentwood Of Wedgewood Condo
Kenwood
Kenwood 1st Addn
Kenwood Forest
Kenwood Hall Condo
Kenwood House
Kenwood Park
Kenwood Place
Kenwood Sub
Kenwood Towers
Kenwood Townes
Kerby Hill
Kerill Heights
Kern County
Kernewood
Kerr & Williams Sub
Kerrwood Oaks
Kerwood Manor
Kesler
Kessler Grove Sec 1
Kessler Grove Sec 4
Keswick
Keswick A Condo
Keswick B Condo
Kettering
Kettering By The Park Ii
Kettering Overlook Condo
Kettering-Resub Plat 74
Kettle Run Forest
Kew Gardens
Key Acres
Key Bisc Ambassador Condo
Key Biscayne Commodore Cl
Key Biscayne Commodore Club
Key Biscayne Vi Condo
Key Biscaynes Commodore C
Key Colony Beach
Key Colony Beach 1st Add
Key Colony Beach Botel Subd
Key Colony No 1
Key Colony No 2 Condo
Key Colony No 4 Condo
Key Colony Point
Key Colony Sub 4
Key Colony Townhouse
Key Commons
Key Haven Condo
Key Islander Condo
Key Largo Beach
Key Largo Beach Add
Key Largo Kampground
Key Largo North
Key Largo Ocean Resort
Key Largo Ocean Resort Co
Key Largo Ocean Resort Con
Key Largo Ocean Resorts (94.50)
Key Largo Ocean Shores
Key Largo Ocean Shores Ad
Key Largo Park
Key Largo Park Amd
Key Largo Trailer Village
Key Largo Yacht Club
Key North
Key Vacca
Key West
Key West By The Sea
Key West Village
Keys Cove
Keys Crossing
Keys Garden
Keys Gate
Keys Gate Condo No Four
Keys Gate Condo No One
Keys Gate Condo No Seven
Keys Gate Condo No Six
Keys Gate Condo No Three
Keys Gate Condo No Two
Keys Gate Residential
Keys Gate Subdivision
Keys Landing
Keys Of Marsh Harbor
Keys Sub
Keys-Gate
Keys-Gate No 1
Keys-Gate No 2
Keys-Gate No 3
Keys-Gate North Gate Vlg
Keyser
Keystone
Keystone Arms Condo
Keystone Bay Condo
Keystone Condo
Keystone Courts Condo
Keystone Gardens
Keystone Gardens Condo
Keystone Harbor Club Cond
Keystone Heights
Keystone Island No 1
Keystone Island No 3
Keystone Island No 5
Keystone Manor Condo
Keystone Park Condo
Keystone Point
Keystone Point Sec 1
Keystone Point Sec 2
Keystone Point Sec 3
Keystone Quarters
Keystone Shores
Keystone Towers Condo
Keystone Villas Condo
Keystone Villas Ii Condo
Kghy2 Kings Hwy
Kghy3 Kings Hwy
Kibbee Add No. 2
Kickback Inn & Rv Park Mhp
Kids Kingdom Academy Tami
Kilbirnie Estates
Kilbourne Estates
Kilby Estates
Kilcolman Garden
Kile Knob
Killer & Demmer's Subdivision
Killers Plat
Killian Acres
Killian Green Ests
Killian Greens
Killian Heights 1st Addn
Killian Park
Killian Pines
Kim Acres
Kimberly Forest
Kimberly Forest Sec 2
Kimberly G Henry
Kimberly Lake Villas
Kimberly Meadows
Kimberly Place
Kimberly Townhouses
Kimberly Village
Kimberly Village Sec One
Kimberly Village Sec Two
Kimberly Village Section
Kimberly Village Section Three
Kimberly West
Kimberly Woods Village
Kimberwick
Kimbles Field
Kinbrey Sub
Kincaid Forest
Kincora
Kinderhook
Kindleton
Kindred Cove
King Charles Apts Condo
King Cole
King Cole Condo
King David Of Sunny Isles
King David Towers Condo
King Estates
King Farm
King Farm Baileys Common
King Farm Irvington
King Farm Village
King Farm Village Center
King Farm Watkins Pond
King Farms
King George
King George On The Potomac
King Kennedy
King Manor
King Mason Tract
King Mountain Condo (Aka Monterey Yacht & Country
King Mountain Condo Monterey Yacht & Country Club
King Mountain/Monterey
King Of Prussia
King Park
King Robert
King Street Commons
King Williams Court
King's Bay
King's Crossing
King's Plantation
King's Wood
Kingdom Dream
Kingfisher
Kingfisher Reserve
Kingman Acres Condo
Kingman Commons
Kingman Park
Kings Arms
Kings Bay
Kings Bay Estates
Kings Bay Sub
Kings Castle Condo
Kings Contrivance
Kings Council
Kings Council Condo
Kings Court
Kings Court At Brownstone
Kings Court Replat
Kings Court West
Kings Cove Condo
Kings Creek
Kings Creek Cc
Kings Creek Ests
Kings Creek So Condo
Kings Creek West Condo Bl
Kings Croft
Kings Crossing
Kings Gardens Sec Three
Kings Gardens Sec Two
Kings Gate
Kings Grant
Kings Grant East
Kings Grant La Plata
Kings Grove
Kings Heights
Kings Highway Homesites
Kings Highway Homesites 1
Kings Isle (Isle Of Lombardy)
Kings Isle (Isle Of Marino)
Kings Isle - Isle Of Lombardy
Kings Isle At Isle Of Madeira
Kings Isle Ii-B
Kings Isle Phase 1
Kings Isle Phase 6a
Kings Isle Phase 6b
Kings Isle Phase Iia
Kings Isle Phase Iic
Kings Isle Phase Iii
Kings Isle, Isle Of San Marino
Kings Isle, Isle Of Venice
Kings Lake
Kings Landing
Kings Meadow
Kings Overlook
Kings Park
Kings Park Estates
Kings Park Garden Apts Co
Kings Park Garden Apts Condo
Kings Park West
Kings Point
Kings Point Normandy I
Kings Point & Inverrary
Kings Point - Seville
Kings Point 13
Kings Point 3
Kings Point Brittany
Kings Point Brittany Cond
Kings Point Brittany Condos
Kings Point Burgundy
Kings Point Burgundy Condos
Kings Point Capri
Kings Point Capri Condos
Kings Point Flanders
Kings Point Flanders Cond
Kings Point Flanders Condos
Kings Point Imperial Cond
Kings Point Imperial Condo
Kings Point Monaco
Kings Point Monaco B
Kings Point Monaco B Thru P Condos
Kings Point Monaco Condos
Kings Point Normandy
Kings Point Normandy A Thr
Kings Point Normandy Cond
Kings Point Normandy Condos
Kings Point Piedmont
Kings Point Piedmont Cond
Kings Point Piedmont Condos
Kings Point Saxony Condos
Kings Point Saxony F Condos
Kings Point Seville Condo
Kings Point Seville Condos
Kings Point Trent 'B'
Kings Point Tuscany Condo
Kings Point Tuscany Condos
Kings Point Valencia Cond
Kings Point Valencia Condos
Kings Point Valencia Condos Par 116
Kings Point Waterford Condos
Kings Point, Flanders E
Kings Pointe
Kings Ransom Condo
Kings Ridge
Kings River Haven Mhp
Kings Run
Kings Seat Pleasant
Kings Square
Kings Subdivision
Kings Valley View
Kings Way Condo Apts Inc
Kingsberry
Kingsbrook
Kingsbrooke
Kingsbury
Kingscote
Kingscote Harbor
Kingsessing
Kingsfield
Kingsgate
Kingsland Country Estate
Kingsley
Kingsley At Century Villa
Kingsley At Century Villag
Kingsley At Century Village
Kingsleys Sub
Kingsmill
Kingsmill Lakes At Pga Village
Kingsmill Mhp
Kingspoint
Kingsport
Kingsport Estates Condo
Kingsport Estates Condominium
Kingsridge
Kingston
Kingston Chase
Kingston Hill Ii
Kingston Ridge
Kingston Square Condo
Kingston Terrace
Kingstown
Kingstowne
Kingstream
Kingsview
Kingsview Sub
Kingsview Village
Kingsville
Kingsway
Kingsway Village
Kingswell
Kingswood
Kingswood 3
Kingswood Condo
Kingswood Condo Apt Bldg 5
Kingswood Condo Phase 3
Kingswood Condominium
Kingswood Ii Condos
Kingswood Manor
Kingwood Township
Kinnairds Point
Kinnamon Meadows
Kinsale
Kinsey Heights
Kintnersville
Kirby Estates
Kirby Woods
Kirby Woods Plat 1
Kirbys Addn To Miami Shor
Kirk
Kirk Acreage
Kirk Acres
Kirkland Heights Amd
Kirklyn
Kirkpatrick Estates
Kirkpatrick Farms
Kirkpatrick Sub
Kirkton Lawns
Kirkwood
Kirkwood South
Kirwans Landing
Kis1 Kissimmee
Kissel Hill
Kissel Hill Commons
Kissimmee River Estates
Kissimmee River Shores
Kitching Cove Estates
Kite Acres
Kitts Hummock
Kitty Creek
Kitzmiller
Klair Estates
Klee Mill Terrace
Klein Mills
Klinger Heights
Km 52, El Zonte
Kms Townhouses
Knettishall
Knights Addition To Crysta
Knights Bokeelia Isles
Knights Landing
Knights Park
Knightsbridge
Knightsbridge / Polo Club
Knob Hill Estates At Madison Fields
Knob Hill Sub
Knobley Heights-
Knollac Acres
Knolls 1st Sec Replat
Knolls 1st Section
Knolls 3 Sec
Knolls 4 Sec
Knolls At North Lake Condominium
Knolls Of Birmingh
Knolls Sec 5
Knollwood
Knollwood Club Condo
Knollwood Manor
Knollwood Pud
Knots Landing
Knott's-West Glymont Ind
Knotts Landing
Knowlson Colony
Knox Add
Knoxlyn Farm
Knoxville
Koi
Koi Plat
Koi Residence & Marina
Kokomo Key
Konterra
Koons Park
Kraftlawn
Kreamers Avocado Subd
Kresson Woods
Kressonshire
Krewstown
Kristina Estates
Kristina Estates 3rd Addn
Krizia Sub 1st Addn
Krome Frontage Redland
Krome Grove Estates
Kulpmont
Kunkletown
Kushmer Addit To Bell
Kutztown
Kw Kw Realty Co's First Su
L (Newer)
L Ambiance Of Via Verde
L C Rice Addn No 1
L D C Estates
L D Ray Properties
L Hermitage
L Mongiello Sub
L'Ambiance At Avenir
L'Atelier Condo
L'Eixample
L'Ermitage Palm Beach Condo
L'Hermitage
L'Hermitage Ii Condominium
L1
L2
L3
La
La Altagracia
La Arboleda Condo Ph Ii
La Bahia
La Bahia Condo
La Baia
La Baia Bay Harbor
La Baia Bay Harbor Island
La Baia Bay Harbor Islands
La Baia North
La Belle
La Belle Ranchettes
La Bonne Vie
La Bonne Vie Condo
La Buona Vita Cooperative
La Caada Townhomes
La Calera, Bogota,Colombia
La Cancha Condo
La Cangreja El Guarco
La Carmelita
La Casa Del Rio
La Casa Del Rio Vista Condo
La Cascade
La Cascade Condo
La Cascata
La Castellana Condo
La Ceiba, Tristan Suarez
La Chateau Vert
La Chorrera
La Clara, Palm Beach
La Coquina Co-Op
La Corniche At Boca Pointe
La Costa
La Costa Del Mar Condo
La Costa Ecuatoriana
La Cote Condo
La Entrada Del Mar Condo
La Entrada Del Mar Condominium
La Estancia
La Estancia Golf & Country
La Estancia Golf Resort
La Fleurette
La Fontana
La Fontana Apts Of Palm Beach Inc
La Fontana Condo
La Gloria
La Gorce Golf Sub
La Gorce Island
La Gorce Palace Condo
La Gorce Sub
La Grange
La Hacienda Country Club
La Hacienda Delray
La Mancha
La Mancha 2
La Mar Condo Apts Decl
La Margarita Plat
La Maria
La Mariposa
La Mer Condo Phase I
La Mer Estates South Cond
La Mer Estates West
La Mer Estates West Condo
La Mirada
La Mirada At Boca Pointe
La Mirada At Boca Pointe Condos
La Montage
La Nor Villas
La Palma Condo
La Paloma
La Paloma Sub
La Paz At Boca Pointe
La Pensee Condo
La Perla Condo
La Piazza Navona Condo
La Pinata Cond No 1,2 & 3 As In Decl In
La Pinata Condo
La Placida Section 1 Cond
La Placida Section 2 Cond
La Plata
La Plata Park Sub
La Quinta
La Quinta Condo
La Renaissance
La Residence Condo
La Rive Condo
La Rive Gauche Condo
La Salle Condo
La Salle Park Condo
La Serena
La Sonora
La Terre At Avenir
La Tour Condo
La Trappe Heights
La Vereda, Casa De Campo, Dominican Republic
La Via Condo
La Via Condominium
La Vida
La Villa Roble Unit #4
Labelle
Lacey Forest
Lacey Hill-Connell Unrecor
Lacey Twp
Lacuna / Fairfields Lacuna
Ladds Landing
Ladeca Acres S/D Unrec Sec 29
Ladera
Ladies Acres 1st Amd, The
Ladmark At Doral Condo #4
Lado Del Rio Condo
Lado Del Rio Condominium
Ladysmith
Ladysmith Industrial Prk
Ladysmith Village
Lafayette Arms Co-Op
Lafayette Condo
Lafayette Forest
Lafayette Hill
Lafayette Hills
Lafayette Homesites
Lafayette Park
Lafayette Park Condominium
Lafayette Park West
Lafayette Square
Lafayette Village
Lagathia
Lago Azul Condo
Lago Del Rey Condo
Lago Del Rey Condo #1
Lago Del Rey Condo #2
Lago Del Rey Condo #4
Lago Del Rey North Amsterdam Condo
Lago Grande 5-D
Lago Grande Condo Three B
Lago Grande Condo Three C
Lago Grande Five-B Condo
Lago Grande Five-C Condo
Lago Grande One Condo
Lago Grande Seven-B Condo
Lago Grande Three-A Condo
Lago Grande Two C Condo
Lago Grande Two Condo
Lago Mar
Lago Mar East Lodge Condo
Lago Mar North Lodge Condo
Lago Mar Place Co-Op
Lago Mar Pud
Lago Mar South
Lago Mar South 2nd Addn
Lago Mar West Lodge Condo
Lago Palma
Lago Ranco, Futrono
Lago Verde Villas Condo
Lago Vista
Lago West Cluster Homes
Lago West Cluster Homes P
Lago West Cluster Homes Ph
Lago West Cluster Homes Phase Ii
Lago West Condominium
Lagoon Place
Lagoon Sub
Lagorce Square
Lagos
Lagos Altamira
Laguna Club East Condo
Laguna Condo
Laguna Gardens
Laguna Gardens Condo
Laguna Isles
Laguna Mission Bay
Laguna Of Vero Beach
Laguna Ponds Sec 2
Laguna Ponds Sec I
Laguna Tropical Condo
Laguna Village At Grand Harbor
Laguna Village At Grand Harbor P.D., Plat 34
Laguna Village Phase Two
Laing At Governor Square
Laing At Mile Stone
Lake & Tennis Villas Ph 1
Lake Add To Boynton
Lake Aire Estates
Lake And Hills Country Est
Lake Andrea Ests
Lake Anna Plaza
Lake Anne Of Reston
Lake Arbor
Lake Arrowhead
Lake Ashburton
Lake Ave Add To Wpb
Lake Avenue Lofts Condo
Lake Barcroft
Lake Barton Park
Lake Beach Club Condo
Lake Belvedere Estates 2nd Add
Lake Belvedere Estates 3r
Lake Berkley Resort
Lake Boynton Estates 1
Lake Braddock
Lake Buena Vista Resort Vi
Lake Caloosa Landing Phase
Lake Caloosa Landing Phase 1
Lake Caroline
Lake Catherine
Lake Cecile Ests Sec 1
Lake Charles
Lake Charles Association
Lake Charles Ph 3g
Lake Charles Phase 1a
Lake Charles Phase 1b
Lake Charles Phase 2a
Lake Charles Phase 2b
Lake Charles Phase 2b-1
Lake Charles Phase 2e
Lake Charles Phase 3a
Lake Charleston
Lake Charleston / Lake Point
Lake Charleston / Lake Pointe
Lake Charleston 1 Par C
Lake Charleston 2
Lake Charleston Par D
Lake Charleston Par M
Lake Charleston Tr I 2
Lake Charleston Tr L 1
Lake Charleston Tr S
Lake Charleston Tr W
Lake Charleston Tr X
Lake Charleston Tr Z
Lake Charleston Trs T And
Lake Charleston Trs T And V 1
Lake Charleston Trs T And V 2
Lake Clair Place
Lake Clarke Gardens
Lake Clarke Gardens Condo
Lake Clarke Gardens Condo 10
Lake Clarke Gardens Condo 12
Lake Clarke Gardens Condo 15
Lake Clarke Gardens Condo 16
Lake Clarke Gardens Condo 17
Lake Clarke Gardens Condo 18
Lake Clarke Gardens Condo 19
Lake Clarke Gardens Condo 2
Lake Clarke Gardens Condo 20a
Lake Clarke Gardens Condo 21
Lake Clarke Gardens Condo 22
Lake Clarke Gardens Condo 23
Lake Clarke Gardens Condo 24
Lake Clarke Gardens Condo 3
Lake Clarke Gardens Condo 4
Lake Clarke Gardens Condo 5
Lake Clarke Gardens Condo 7
Lake Clarke Gardens Condo 9
Lake Clarke Isle
Lake Clarke North
Lake Clarke Terr
Lake Clarke Waterway Estates 1
Lake Codorus
Lake Colony Apts One Inc
Lake Colony Apts Three Inc
Lake Colony Apts Two Inc
Lake Colony Ph 1
Lake Colony Ph 3
Lake Colony Ph Ii
Lake Como Woods
Lake Conway Estates
Lake Country Est Unrec
Lake Cove
Lake Cove Of Lake Worth
Lake Deer Estates
Lake Eden Sub 3
Lake Elizabeth Sec 4
Lake Ellen Estates
Lake Emerald
Lake Emerald Condominium
Lake Emerald Condominium No
Lake Emerald Condominium No One
Lake Emerald Condominium No Six
Lake Emerald Condominium No Two
Lake Estates
Lake Estates Add
Lake Fairways Country Club
Lake Ferndale
Lake Floresta
Lake Floresta Park
Lake Forest
Lake Forest At Slw Phase V
Lake Forest At St Lucie W
Lake Forest At St Lucie West Phase 3
Lake Forest At St Lucie West Phase Ii
Lake Forest Condo
Lake Forest Estates
Lake Forest Sec 2
Lake Forest Sec 3
Lake Forest Sec 4
Lake Forest Sec 4 Resub P
Lake Forest Sec One
Lake Forest South
Lake Frances Subdivision
Lake Frederick
Lake Front Royal
Lake Gaston
Lake George Manor
Lake Gibson Poultry Farms Inc Unit No 2
Lake Gilman
Lake Grove
Lake Hancock Preserve
Lake Harbor Cove Condo
Lake Harbour Towers
Lake Harbour Towers Condo
Lake Harbour Towers East Condo
Lake Harmony
Lake Harmony Estates
Lake Hauto
Lake Haven Estates
Lake Haven Mhp
Lake Haven Sub
Lake Heights
Lake Heritage
Lake Heron Condo
Lake Heron Condominiums
Lake Hills
Lake Holiday Estates
Lake House South
Lake House South Condo Spanish River Land Co
Lake Huntley
Lake Huntley Estates
Lake Ida
Lake In The Clouds
Lake In The Woods
Lake In The Woods At Vero Beach Condo
Lake Isaac Estates
Lake Island
Lake Istokpoga Highlands P
Lake Jackson
Lake Jameson Sub
Lake Josephine Subd
Lake June
Lake June Hills
Lake June Pointe
Lake June Pointe Phase Ii
Lake Karylbrook
Lake Kerr Key
Lake Land
Lake Land Or
Lake Laura Condo No 2
Lake Laurence Est 1st Add
Lake Lillian A Rep
Lake Linganore
Lake Linganore Eaglehead
Lake Linganore Oakdale
Lake Linganore Woodridge
Lake Lucerne Estates
Lake Lucerne Sec 1
Lake Lucerne Sec 2
Lake Lucerne Sec 3
Lake Lucerne Sec 4
Lake Lucerne Sec 7
Lake Lucie Estates
Lake Lucy Manor
Lake Manassas
Lake Mango Shores
Lake Marian Shores
Lake Marion / Poinciana
Lake Marion Terrace
Lake Marks At Westwind
Lake Mary Forest At Southwood, Phase 1
Lake Mayan Apts Co-Op
Lake Mccoy
Lake Meade
Lake Merial Phase One
Lake Montaza Estates Section
Lake Montclair
Lake Montebello
Lake Monticello
Lake Naomi
Lake Normandy Estates
Lake Of Inverrary
Lake Of The Woods
Lake Okeechobee Hammock
Lake Orange Estates
Lake Orleans
Lake Orleans East 1st Sec
Lake Osborne Ct Lantana
Lake Osborne Estates
Lake Osborne Estates 4
Lake Osborne Estates 6
Lake Osborne Manor
Lake Osborne Terrace
Lake Park
Lake Park Condo No 1 - Bl
Lake Park Gardens 2 Inc C
Lake Park Gardens 4 Inc Condo
Lake Park Gardens 5 Inc C
Lake Park Sec 2
Lake Permisson
Lake Pine
Lake Pine Village
Lake Pines
Lake Place
Lake Place Condo
Lake Placid
Lake Placid 35-23 B
Lake Placid Waterwa
Lake Point Round Hill
Lake Point Tower Condomin
Lake Point Tower Condominium
Lake Pointe
Lake Pointe At Town Center
Lake Pointe At Wisp
Lake Pointe Condo
Lake Pointe Condominium
Lake Pointe Condominium N
Lake Pointe Sec 1
Lake Pointe Sec 4
Lake Pond
Lake Rachard
Lake Redman
Lake Regency Woods
Lake Ridge
Lake Ridge Crossing
Lake Ridge-Thousand Oaks
Lake Rogers
Lake Rogers Isle Unit A
Lake Rogers Isle Unit C
Lake Royal East 1st Addn
Lake Sapphire West Residential Subdivision
Lake Sebring Acres
Lake Sebring Area East
Lake Serene
Lake Sheldon
Lake Sherwood Hills Grove
Lake Shore
Lake Shore Drive
Lake Shore Estates
Lake Shore Heights Condo
Lake Shores Lantana
Lake Side
Lake Surprise Estates
Lake Tahoe Estates
Lake Tower Condo
Lake Towers Condo
Lake Tropicana Ranchettes
Lake Tulane Estates
Lake Valley
Lake Verona East Condo +
Lake Victoria Townhomes
Lake View Center Phase 1
Lake View Condo Apts
Lake View Heights Sub
Lake View Manor
Lake View Manor Interior
Lake View Of Calif Club C
Lake View Park Sec 1
Lake View Sub
Lake View Sub Amd
Lake Villa
Lake Villa Two Condo
Lake Village Condo
Lake Village Manor
Lake Village Square
Lake Wales
Lake Walker
Lake Wallenpaupack
Lake Wilderness
Lake Windwood
Lake Windwood Condo
Lake Wood
Lake Worth
Lake Worth Beach
Lake Worth Heights
Lake Worth Hills 2nd Add
Lake Worth Mariner Vlg
Lake Worth Town
Lake Worth Town Of
Lake Worth Town Of Add 1
Lake Worth Village
Lake Wynonah
Lakebridge
Lakecrest
Lakefield Of The Landings At Wellington 1
Lakefield Of The Landings At Wellington 2a
Lakefield Of The Landings At Wellington 3a
Lakefield Of The Landings At Wellington 3b
Lakeford
Lakeforest At St Lucie West
Lakeforest At St Lucie West Phase 1
Lakeforest At St Lucie West Phase V
Lakeforest At St Lucie West Phase Vi
Lakeforest At St Lucie West Viii
Lakeforest Phase Iv
Lakeforest Pointe
Lakefront Boathouse Park
Lakeland
Lakeland Estates
Lakeland Forest
Lakeland Park
Lakeland Place
Lakeland Resub
Lakeland Ridge
Lakeland Woods
Lakelands
Lakelands At Easton
Lakelands Great Seneca
Lakelands Ridge
Lakepark At Townpark
Lakepark At Tradition 1
Lakepark At Tradition 3
Lakepark At Tradition Plat 1
Lakepark At Tradition Plat 3
Lakeport
Lakeridge Falls
Lakeridge Greens
Lakeridge Greens At Pipers Glen
Lakeridge Sec 4
Lakes At Alluvium
Lakes At Boca Raton Par E
Lakes At Boca Raton Par K
Lakes At Boca Raton Ph 4
Lakes At Brookhaven
Lakes At La Paz
Lakes At Parkland
Lakes At Pembroke
Lakes At Pga
Lakes At Pga Village
Lakes At Red Rock
Lakes At Sandridge
Lakes At Sandridge Phase 1 Pd Sub (The)
Lakes At St Lucie West
Lakes At St Lucie West Plat No 22
Lakes At St Lucie West Plat No 23
Lakes At St Lucie West Plat No 54
Lakes At Stansbury Shore
Lakes At The Bluffs
Lakes At Tradition
Lakes By The Bay Amber
Lakes By The Bay Cee
Lakes By The Bay Day
Lakes By The Bay Eve Repl
Lakes By The Bay Faye Rep
Lakes By The Bay Gee
Lakes By The Bay Jay
Lakes By The Bay Kaye
Lakes By The Bay Sec 10
Lakes By The Bay Sec 2
Lakes By The Bay Sec 4
Lakes By The Bay Sec 5
Lakes By The Bay Sec 6
Lakes By The Bay Sec 7
Lakes By The Bay Sec 8
Lakes Condo
Lakes Garden
Lakes Meadow Vilg Homes C
Lakes Of Acadia Unit 3 Th
Lakes Of Acadia Unit 4 The
Lakes Of Acadia Unit 5, T
Lakes Of Acadia Unit 6
Lakes Of Avalon
Lakes Of Avalon Sec 3
Lakes Of Boca Barwood 1
Lakes Of Carriage
Lakes Of Carriage Hills
Lakes Of Deer Creek
Lakes Of Deer Creek Condo
Lakes Of Delray
Lakes Of Delray Watersedge
Lakes Of Delray-Ashland B
Lakes Of Environ Condo
Lakes Of Environ Condominium Association
Lakes Of Inverrary
Lakes Of Inverrary Condo
Lakes Of Jacaranda
Lakes Of Jacaranda Condo
Lakes Of Laguna
Lakes Of Lantana Ph 2-A
Lakes Of Lantana Ph 2-B
Lakes Of Lantana Phase 1a
Lakes Of Lantana Replat Of Reserved Lots In Ph
Lakes Of Mount Dora
Lakes Of Newport
Lakes Of Newport I Condo
Lakes Of Newport Ii
Lakes Of Oakland Forest C
Lakes Of Sherbrooke
Lakes Of Sherbrooke Ph 6
Lakes Of Sherbrooke Ph 7
Lakes Of Tara Unit 2
Lakes Of The Meadow - Ne
Lakes Of The Meadow Patio
Lakes Of The Meadow Sec 1
Lakes Of The Meadow Sec 4
Lakes Of The Meadow Sec 5
Lakes Of The Meadow-Meado
Lakes Of Westchester
Lakes Of Western Pines Re
Lakes Of Woodhaven I And
Lakes Of Woodhaven I And Ii Condo
Lakes On The Green Gwendo
Lakes On The Green North
Lakes On The Green Replat
Lakeshore
Lakeshore At Narcoossee Ph 1
Lakeshore At Sands, A Condominium
Lakeshore At The Fountain
Lakeshore At The Fountains
Lakeshore At The Fountains Replat
Lakeshore At University P
Lakeshore At University Park
Lakeshore Club Condo
Lakeshore Colony I Condo
Lakeshore Condo
Lakeshore Condo #2
Lakeshore Condo #4
Lakeshore Condo #9
Lakeshore Condo 10
Lakeshore Condo 3
Lakeshore Condo 4
Lakeshore Condo 6
Lakeshore Condo 7
Lakeshore Condo I
Lakeshore Lodge Co-Op
Lakeshore Narcoossee Ph 3
Lakeshore North
Lakeshore Preserve
Lakeshore Sec Four
Lakeshore Sec One
Lakeshore Townhomes Condo
Lakeshore Trailer
Lakeshore Village
Lakeshore Village Of Meadowood Phase 1
Lakeshore Woods
Lakeshores
Lakeside
Lakeside Apartments
Lakeside At Rivers
Lakeside At South Riding
Lakeside At The Hammocks
Lakeside At Trappe
Lakeside Co-Op
Lakeside Condo 2 Of Banyan
Lakeside Condo 2 Of Banyan Springs
Lakeside Condo 3 Of Banyan Springs
Lakeside Condo 6 Of Banyan Springs
Lakeside Condo 8 Of Banyan Springs
Lakeside Condo 9 Of Banyan Springs
Lakeside Condo At Lauderd
Lakeside Condo Irp
Lakeside Condominiums
Lakeside Corporate Park
Lakeside Development
Lakeside Estates
Lakeside Gardens
Lakeside Green
Lakeside Green 1
Lakeside Green 2
Lakeside Green 7
Lakeside Green 9
Lakeside Harbor
Lakeside Hills
Lakeside Hills Estates
Lakeside Hills Sec 10
Lakeside Hills-Flora Homes
Lakeside Landing
Lakeside Manor
Lakeside Manor North
Lakeside Manor North Cond
Lakeside Manor South Condo
Lakeside Palms
Lakeside Park
Lakeside Plaza
Lakeside Point Add To Lantana
Lakeside Point Apt 11 Condo
Lakeside Point Apt 12 Condo
Lakeside Point Apt 14 Condo
Lakeside Point Apt 4 Condo
Lakeside Point Apt 6 Condo
Lakeside Point Apt 8 Cond
Lakeside South
Lakeside Subdivision
Lakeside Terrace
Lakeside Village
Lakeside Village Condo
Lakeside Village Condo 10
Lakeside Village Condo 4
Lakeside Village Condo 5
Lakeside Village Condo 6
Lakeside Village Condo 7
Lakeside Village Condo 8
Lakeside Village Condo 9
Lakeside Village Mhp Co-Op
Lakeside Village Mobile Home Park Co-Op
Lakeside Village Of Davie
Lakeside Vllage Condo 10
Lakeside Xi Condo Ph Iii
Laketree
Lakeview
Lakeview At Brandywine
Lakeview At Buckskin Ridge
Lakeview At Hammocks Cond
Lakeview At The Gardens C
Lakeview At The Hammocks
Lakeview Club Condo
Lakeview Colony
Lakeview Courts At Jacara
Lakeview Estates
Lakeview Estates Condo
Lakeview Estates Ph 1
Lakeview Ests
Lakeview Farms Develop
Lakeview Gardens At Miami
Lakeview Gardens Condo
Lakeview Greens Condo 1
Lakeview Heights
Lakeview Heights Add 1
Lakeview Heights Add 4
Lakeview Heights No 2
Lakeview Homes
Lakeview Homes At
Lakeview Homes At Centura Parc V
Lakeview Homes Phase 1
Lakeview Mhp
Lakeview Mobile Park
Lakeview Of Culpeper
Lakeview Of The Calf Club
Lakeview Park
Lakeview Pedestal Homes
Lakeview Place
Lakeview Ridge
Lakeview Sub
Lakeview Subdivision
Lakeview Townhomes Condo
Lakeview Townhouses Condo
Lakeview Trailer Park
Lakeview Village
Lakeview West
Lakewinds
Lakewood
Lakewood At Emerald Hills
Lakewood At Emerald Hills Condo
Lakewood At Palm Beach Condo
Lakewood Cove
Lakewood East Sec 1
Lakewood East Sec 2
Lakewood Est Sub
Lakewood Estates
Lakewood Estates Patio Ho
Lakewood Ests
Lakewood Farm
Lakewood First
Lakewood Gardens 3
Lakewood Gardens Pl 1 In
Lakewood Gardens Pl 2 In
Lakewood Hills
Lakewood Landing
Lakewood Manor
Lakewood Midrise
Lakewood Midrise Condo
Lakewood Of Palm Springs
Lakewood On The Green
Lakewood On The Green Con
Lakewood On The Green Sec
Lakewood Park
Lakewood Park Addition No
Lakewood Park Unit 1
Lakewood Park Unit 10
Lakewood Park Unit 11
Lakewood Park Unit 12
Lakewood Park Unit 12a
Lakewood Park Unit 2
Lakewood Park Unit 3
Lakewood Park Unit 4
Lakewood Park Unit 5
Lakewood Park Unit 6
Lakewood Park Unit 7
Lakewood Park Unit 8
Lakewood Park Unit 9
Lakewood Terrace Sheet 01
Lakewood Terrace Unit 2
Lakewood Unit 5
Lakewood Village
Lakewood Village Of Coral
Lakewood Villas Condo
Lakewood West Palm Beach
Lakt Thonotossasa
Lalor Tract
Lambertille
Lamberts Hill
Lambertville
Lambertville City
Lambiance Beach Condo
Lambiance Townhomes Kenda
Lamond/Riggs
Lamorada
Lamott
Lamp Estates
Lamplighter Village
Lanair Park
Lancaster
Lancaster / Westlake Village
Lancaster At Century Vill
Lancaster At Century Village
Lancaster City Annex
Lancaster City Ward 2
Lancaster City Ward 6
Lancaster City Ward 7
Lancaster City Ward 8
Lancaster City Ward 9
Lancaster County
Lancaster Gate
Lancaster West End
Lancasters
Land
Land -O-Lakes Estates
Land Is Not Developed Yet. No Subdivision Yet.
Land Of Luray
Land Of Towngate
Land Section 6-North
Land Section 8
Landenberg
Landens Ridge
Landfare
Landgon Farm
Landing
Landing South
Landings
Landings At Deptford
Landings At Mattapex
Landings At River Bridge
Landings Condo
Landings Condo Lt
Landings First Sec
Landings Of Largo Ii
Landingville
Landis Farms
Landisburg
Landisville
Landmark
Landmark At Doral
Landmark At Doral Central
Landmark At Doral Condo
Landmark At Doral Condo N
Landmark At Hillsboro
Landmark At Hillsboro Con
Landmark At Hillsboro Condo
Landmark At The Gardens
Landmark At The Gardens Condo
Landmark Mews
Landmark Ranch Estates
Landmark Ranches
Landon Woods
Landover
Landover Estates
Landover Hills
Landover Hills- Green Hi
Lands End
Lands Of The President
Lands Of The President / Envoy
Lands Of The President / Envoy Condo
Lands Of The President C
Lands Of The President Co
Lands Of The President Cond 7
Lands Of The President Condo 1
Lands Of The President Condo 2 ,
Lands Of The President Condo 2 , Washington Tower
Lands Of The President Condo 3
Lands Of The President Condo 6
Lands Of The President Condo 7
Lands Of The President Condo 8
Lands Of The President/Consulate Condo
Lands President Condo 01
Landsdale
Landsdowne
Landsdowne Station
Landview Estates
Lane At Four Stairs
Lane-Mar Estates
Lanedon
Langdon
Langford
Langford Landing
Langhorne Gables
Langhorne Gdns
Langhorne Manor
Langhorne Terrace
Langley Farms
Langley Forest
Langley Manor
Langley Oaks
Langley Park
Langston Hughes
Langstoon
Langtree
Lanham
Lanham Acres
Lanham Village
Lanham Woods
Lanier Farms
Lanier Heights
Lanikai Villas Condo
Lanning Square
Lanoka Harbor
Lansbrook East
Lansdale
Lansdowne
Lansdowne On The Potomac
Lansdowne Park
Lansdowne Square
Lansdowne Town Center
Lansdowne Woods
Lansford
Lansford Borough
Lantana
Lantana Amnded Plat In
Lantana Cove
Lantana Farms Pud
Lantana Heights
Lantana Heights 6
Lantana Heights 7
Lantana Heights 8
Lantana Homes 3
Lantana Homes 6
Lantana Pines 1 Sportsmens Club
Lantana Point
Lantern Hill
Lantern Ridge
Lantern Walk
Lantern Walk 2
Lappeenranta Condo
Lar-Kee Lakes 2nd Addition
Lar-Kee Lakes 3rd Addition
Larch Drive Development
Larchmont
Larchmont Estates
Larchmont Sq
Largo Crescent
Largo Gardens
Largo Sound Park
Largo Sound Village
Largo Town Center
Largo Town Center Condominiums
Largo Woods
Larkdale Unit 2
Larkdale Unit 4
Larkee Lakes
Laro Sub
Laroc Estates
Larrimore's Point
Laruel Lakes
Las Brisas
Las Brisas At Doral Condo
Las Brisas Country Club
Las Brisas Of Boca Condo
Las Brisas Village Condo
Las Brisas@ Country Club
Las Canas
Las Canas I, Casa De Campo, Dominican Republic
Las Canas Ii In Casa De Campo, La Romana, Dominica
Las Casas At Kendall
Las Casitas 1
Las Casitas 4
Las Casitas Pl 4
Las Entradas
Las Estrellas Condo
Las Flores Ranchos
Las Haciendas Townhouse C
Las Iguanas
Las Lomas
Las Mercedes Townhouses
Las Olas
Las Olas Beach Club
Las Olas Beach Club Condo
Las Olas By The River
Las Olas By The River Con
Las Olas By The River Condo
Las Olas By The Sea Ext
Las Olas Condo
Las Olas Grand Condo
Las Olas Isles
Las Olas Manor 2 Condo
Las Olas Park Corr Plat
Las Olas River House
Las Olas River House Cond
Las Olas River House Condo
Las Palmas
Las Palmas 76
Las Palmas Equestrian
Las Palmas Sub
Las Palmitas
Las Ramblas Via Ventura
Las Terrazas At Vizcaya
Las Terrazas At Vizcaya C
Las Terrazas At Vizcaya Condo
Las Tortugas
Las Verdes
Las Villas At Kenilworth
Las Villas Of La Mancha S
Las Villas Segovia Condo
Las Vistas
Las Vistas A In Inverrary Condo
Las Vistas At Doral Condo
Las Vistas B In Inverrary
Las Vistas D In Inverrary
Las Vistas F In Inverrary
Las Vistas H In Inverrary
Las Vistas H In Inverrary Condo
Las Vistas K In Inverrary
Las Vistas K In Inverrary Condo
Las Vistas L In Inverrary
Las Vistas P In Inverrary
Las Vistas P-R In Inverra
Laser Condo
Latchs Lane
Latham Pl
Latimer Farms
Latitude 24 (Replat Of Po
Latitude Delray
Latitude On The River
Latitude On The River Con
Latitude On The River Condo
Latitude One West Brickel
Lauder Gate Isles
Lauder-Gate
Lauderdale
Lauderdale 2-9 D
Lauderdale Beach
Lauderdale Beach Estates
Lauderdale Beach Ext
Lauderdale Beach Ext 27-4
Lauderdale Beach Ext Unit
Lauderdale Beach Surf Apt
Lauderdale By The Sea
Lauderdale Gardens
Lauderdale Golf Estates
Lauderdale Golf Estates 2nd Add
Lauderdale Groves Amen Pl
Lauderdale Harbors
Lauderdale Harbors Sec A
Lauderdale Harbors Sec A Resub
Lauderdale Harbors Sectio
Lauderdale Harbors Section
Lauderdale Harbours
Lauderdale Heights
Lauderdale Homesites
Lauderdale Homestites
Lauderdale Isles
Lauderdale Isles 1 31-23
Lauderdale Isles No 2
Lauderdale Isles No 2-Blk
Lauderdale Isles No 2-Blk 6
Lauderdale Lakes East Gat
Lauderdale Lakes East Gate
Lauderdale Lakes North Ga
Lauderdale Lakes North Gate
Lauderdale Lakes Northgate Sec 6
Lauderdale Lakes West Gat
Lauderdale Manor Homesite
Lauderdale Manors
Lauderdale Manors Add
Lauderdale Manors Add Rev
Lauderdale Manors Add-Res
Lauderdale Manors Add-Rev
Lauderdale Manors Add-Rev Plat
Lauderdale Manors Amd Pla
Lauderdale Manors Amd Plat
Lauderdale Manors Amen Resub
Lauderdale Manors Amend P
Lauderdale Manors Resub
Lauderdale Manors Revised Plat
Lauderdale North Park
Lauderdale North Park Sec
Lauderdale North Park Sec 4
Lauderdale North Park Section 6
Lauderdale Oak Cond Xii
Lauderdale Oaks
Lauderdale Oaks Condo 4
Lauderdale Oaks Condo 5
Lauderdale Oaks Condo 7
Lauderdale Oaks Condo I
Lauderdale Oaks Condo Ii
Lauderdale Oaks Condo Iii
Lauderdale Oaks Condo Xii
Lauderdale Oaks Condo Xii-B
Lauderdale Oaks Condo Xiv
Lauderdale Oaks Condo Xix
Lauderdale Oaks Condo Xv
Lauderdale Oaks Condo Xvi
Lauderdale Oaks Condo Xviii
Lauderdale One
Lauderdale One Condo
Lauderdale Park 6-33 1/2
Lauderdale Pines
Lauderdale Shores Corr Plat
Lauderdale Shores Reamen Plat
Lauderdale Tower
Lauderdale Tower Condo
Lauderdale Villas
Lauderdale West
Lauderdale West 2 Sec
Lauderdale West 3 Sec
Lauderdale West Condo No
Lauderdale West Condo No I
Lauderdale West Condo No Ix
Lauderdale West Condo No Xii
Lauderdale West Condo No Xiii
Lauderdale West Sec 4
Lauderhill East
Lauderwood Amd 36-14 B
Lauderwood Amen
Laura Lane Unrec On Am-52
Laural Lakes
Lauraville Amnded Pl
Lauraville Gardens
Lauraville Historic District
Laureate Park Ph 9
Laurel
Laurel Acres
Laurel Branch
Laurel Brook
Laurel Brook Estates
Laurel Commons
Laurel Court
Laurel Creek
Laurel Crossing
Laurel Estates
Laurel Gardens
Laurel Glen
Laurel Grove
Laurel Hill
Laurel Hills
Laurel Hills 2nd Add
Laurel Hills 4th Add
Laurel Hills 5th Add
Laurel Knoll East
Laurel Lake
Laurel Lake Manor
Laurel Lakes
Laurel Lakes Plat 2
Laurel Lakes Plat 4
Laurel Manor
Laurel Mills
Laurel Oaks
Laurel Oaks East
Laurel Oaks North
Laurel Overlook
Laurel Park
Laurel Point
Laurel Pond
Laurel Ridge
Laurel Ridge Estates
Laurel Run
Laurel Springs Estates
Laurel Terrace Condo
Laurel Valley
Laurel Villa Inc
Laurel Village
Laurel Woods
Laureldale
Laurels At Margate
Laurels At Margate Condo
Laurels At Sherwood Condo
Laurels At Sherwood Condominium
Laurelton
Laurelwood
Laurelwood Unit 2
Laurelwoods Ii
Laurich
Laurich Estates
Laurich Gems
Laurich Gems North
Laurich Hills
Laurich Meadows
Lauxmont Farms
Lavale Gardens
Lavender Plaza
Laverock
Lavers Delray Racquet Clu
Lavers Delray Racquet Club Condo
Lavers Resort & Racquet Club
Lawn Acres
Lawn Acres 36-3 B
Lawncrest
Lawndale
Lawndale 3rd Addn
Lawndale 4th Addn
Lawndale Acres
Lawnford Acres
Lawnton
Lawnvale Estates
Lawnview
Lawnwood
Lawnwood Addition
Lawrence C Moore Sub
Lawrence Est Land Co
Lawrence Est Land Co Sub
Lawrence Est Land Cos Sub
Lawrence Estate Land Co
Lawrence Estate Land Cos
Lawrence Estates Land Co
Lawrence Estates Land Cos
Lawrence Gardens
Lawrence Industrial Subdivision
Lawrence Park
Lawrence Park Amd
Lawrence Sq Vil
Lawrenceville Gree
Layhill Overlook
Layhill South
Layhill View
Laytonia
Laytons Lake
Laytonsville Grove
Laytonsville Outside
Laytonsville Town
Lazarus On Richmond
Lazy 7 Estates
Lazy Lake
Lc Whites
Le Bocage Rev Pl
Le Cartier Condo
Le Cercle By The Beach Co
Le Cercle By The Beach Condo
Le Chalet 4-A
Le Chateau Condo
Le Chateau Royal Condo
Le Club At Old Cutler Con
Le Club I
Le Club International Con
Le Club International Condo
Le Cotillion Co-Op
Le Frontenac Condo
Le High
Le High Acres 2
Le Jardin
Le Jardin House Condo
Le Jardine
Le Jeune Addn Sec 1
Le Jeune House Condo
Le Jeune Manors
Le Jeune Terrace
Le Jeune Villas
Le Lac
Le Maisonneuve Condo
Le Montcalm Condo
Le Palais
Le Parc
Le Parc At Brickell
Le Parc At Brickell Condo
Le Point Condo
Le Roi
Le Sanctuaire Condo
Le Terrace Condo
Le Trianon Condo
Le Village De Provence
Le Village De Provence / Chateau Wood
Le Village De Provence 2
Leachburg
Leacock
Leader Heights
Leader Heights Crossing
Leafy Road Estates
Leaseflorida
Leavells Crossing
Lebanon
Lebanon City
Lebanon City - Ward 2
Lebanon City, Ward 2
Lebanon County
Lederach Station
Lederach Village
Ledroit Park
Lee
Lee Bell Homes
Lee County
Lee County Unicoporated
Lee County Unincorporated
Lee County Unincorporated - L
Lee County Unincorporated - L (Newer Subdivisions)
Lee County Unincorpored-L
Lee Graham Square
Lee H Lahman Sub
Lee Heights
Lee Heights Subd
Lee Hgts
Lee High Acres
Lee Manor
Lee Manor Condo
Lee Manor Isles
Lee Overlook
Lee Park Condo
Lee Square
Lee's Crossing
Lee's Hill
Lee's Hill South
Lee's Parke - The Falls
Lee's Parke Executives
Leedom Ests
Leeds Point
Leehigh
Leehigh Acres
Leehigh Village
Leeland Heights
Leeland Heigts
Leeland Hights
Leeland Station
Lees Parke
Leesbg Pro Ctr
Leesborough
Leesburg Chesterbrook 02 C
Leesburg Country Club
Leesburg Gateway
Leesburg Historic District
Leesport
Leeward At Island At Doral
Leeward At Islands At Dor
Leeward Point
Leeward Point Condo
Leewood
Leewood Forest Sec 5
Lefler & Jones Prop
Legacy Acres
Legacy At Gateway
Legacy At Mannington Village
Legacy At Odessa National
Legacy At Wtrfrd Pne
Legacy Court
Legacy Cove
Legacy Estates
Legacy Farms
Legacy Oaks
Legacy Park Phase One
Legacy Place
Legacy Woods
Legato Corner
Legend Manor
Legends At Mansfield
Legends At Pga National
Legends At The Gardens
Legends At The Gardens Co
Legends At Turf Valley
Legends At Weston Hills
Legends Condo
Legigh Acres
Legion Acres
Lehich Acres
Lehich Acres Unit 8
Lehigh
Lehigh Acres
Lehigh Acreas
Lehigh Acres
Lehigh Acres 12
Lehigh Acres 1st Addition
Lehigh Acres Estates
Lehigh Acres Unit
Lehigh Acres Unit 1
Lehigh Acres Unit 10
Lehigh Acres Unit 11
Lehigh Acres Unit 11 Blk 4
Lehigh Acres Unit 12
Lehigh Acres Unit 12 Blk 1
Lehigh Acres Unit 12, Block 48, Lot 17
Lehigh Acres Unit 13
Lehigh Acres Unit 14
Lehigh Acres Unit 15
Lehigh Acres Unit 15 Blk 76 Pb 18 Pg 33 Lot 4 + 5
Lehigh Acres Unit 16
Lehigh Acres Unit 2
Lehigh Acres Unit 3
Lehigh Acres Unit 4 Blk
Lehigh Acres Unit 4 Blk 14
Lehigh Acres Unit 4 Blk 22
Lehigh Acres Unit 5
Lehigh Acres Unit 6
Lehigh Acres Unit 7
Lehigh Acres Unit 8
Lehigh Acres Unit 8 Blk 39
Lehigh Acres Unit 9
Lehigh Acres Unit 9 Blk 26
Lehigh Acres Unit 9 Blk 32
Lehigh Acres Unit 9 Blk 33
Lehigh Acres Unt 4
Lehigh Acres,
Lehigh Acres,Fl
Lehigh Acress
Lehigh Camille Gardens
Lehigh Crossing
Lehigh Estates
Lehigh Estates Unit 2
Lehigh Estates, Unit 7
Lehigh Manor
Lehigh Palm Square
Lehigh Park
Lehigh Property Blv
Lehigh Township
Lehighton
Lehighton Boro
Lehihg Acres Unit 5
Leiby's
Leigh Acres
Leigh Acres Unit 4
Leigh Court
Leigh Estates
Leihgh Acres
Leilani
Leilani Heights
Leipsic
Leishear Village
Leisure Beach
Leisure Beach Condo
Leisure Beach South
Leisure Beach South Condo
Leisure By The Sea Condo
Leisure By The Sea East Condo
Leisure City Sec 1
Leisure City Sec 2
Leisure City Sec 3
Leisure City Sec 4
Leisure Gardens Condo
Leisure House Condo
Leisure Knoll
Leisure Lakes
Leisure Lakes Northeast
Leisure Lakes Sec
Leisure Lakes Sec 03
Leisure Lakes Sec 04
Leisure Lakes Sec 06
Leisure Lakes Sec 07
Leisure Lakes Sec 08
Leisure Lakes Sec 11
Leisure Lakes Sec 13
Leisure Lakes Sec 14
Leisure Lakes Sec 16
Leisure Lakes Sec 17
Leisure Lakes Sec 18
Leisure Living Estates
Leisure Mar Condo
Leisure Point
Leisure Sands Condo
Leisure Shore
Leisure Shores Condo
Leisure Towers Condo
Leisure Village
Leisure Village East
Leisure Village Mhp Unrec Co-Op
Leisure Village Mobile Hm Pk Unrec Co-Op
Leisure Village West - Manchester
Leisure World
Leisuretowne
Leisureville
Leisureville Lake Condo
Leisureville Fairway
Leisureville Fairway Eight Condo
Leisureville Fairway Nine
Leisureville Fairway One Condo
Leisureville Fairway Six
Leisureville Fairway Six Condo
Leisureville Fairway Ten Condo
Leisureville Fairway Two Condo
Leisureville First Sec
Leisureville Fourth Sec
Leisureville Golf View
Leisureville Golf View Co
Leisureville Golf View Condo
Leisureville Golf View North
Leisureville Lake Condo
Leisureville Lake Unit F Apt 105
Leisureville Pompano
Leisureville Second Sec
Leisureville Third Sec
Leitch Tract
Lejeune Gdn Estates Amd P
Lejeune Place Condo
Lejeune Plaza Condo
Lemasters
Lemon City Whites
Lemont
Lemoyne Borough
Lena Lane East
Lena Manor
Lenah
Lenah Mill - The Executives
Lenape Valley Farm
Lenape Vil
Lenape Woods
Lenards Addn
Lenker Estates
Lenker Manor
Lennar At Westview
Lennings Knoll
Lennox Park
Lennox Park Mhp
Lenola
Lenox Manor
Lenox On The Beach Condo
Lenox Place At Sunnyside
Lenox View Condo Lenox Man
Lenox View Condominium
Lenox Villas Condo
Lenwood Park
Leola
Leomar Homes
Leonard William F % Delray Colonial Inc
Leonardo Estates
Leonards Grant
Leonards Tract
Leonardtown
Leonardtown Farms
Leonardtown Landing
Lerettes Sub
Leroy Harris Property
Les Chalets Ii
Les Chateaux At Int Garde
Les Fontaines
Les Fontaines Condo
Les Jardins Condo
Les Pelicans (The Pelicans) Condo
Les Pelicans Condo
Leslie Estates 4
Leslie Estates Sec 1
Leslie Estates Sec 14
Leslie Estates Sec 2
Leslie Estates Sec 4
Leslie Estates Sec 5
Leslie Estates Sec 9
Leslie Estates Sec Five
Leslie Estates Sec Four
Leslie Estates Sec Seven
Leslie Ests Sec Six
Leslie Lake North
Leslie Manor
Leslie Patio Homes Sec 1
Leslie Patio Homes Sec 3
Leslie Patio Homes Sec 4
Lester
Lester Pud 6
Letarte Plat
Leto Acres
Letort Meadows
Letort Springs Farm
Leverett House Condo
Leverings
Levindale
Leward At Island At Doral
Lewes Beach
Lewes Crossing
Lewes Waterfront Preserve
Lewinsville
Lewinsville Heights
Lewinsville Square
Lewis & Burkhard
Lewis Park
Lewis Pointe
Lewis Property
Lewis Shore
Lewis Shore Estates 2
Lewis Shore Estates 3
Lewis Shore Estates La Vista Addn 1
Lewis W Barfield Prop Unrec
Lewisberry
Lewisberry Boro
Lewisdale
Lewistown
Lewistown Boro
Lewistown Estates
Lewistown Heights
Lewistown Valley
Lexcellence Condo
Lexington
Lexington 7
Lexington Club
Lexington Club 3
Lexington Club Villas Con
Lexington Club Villas Condo
Lexington Condo
Lexington Estates
Lexington Green Condo
Lexington Hill
Lexington Homes Estates
Lexington Lakes
Lexington Lakes Condo
Lexington Lakes Ph 04
Lexington Lakes Ph 34
Lexington Meadows
Lexington Mews
Lexington Park
Lexington Place Subdivision - Phase Ii
Lexington Pointe
Lexington Square
Lexington Sub
Lexington Villag
Lexington Woods
Lhermitage Condominiums
Lhermitage I Condominium
Lhermitage Ii Condominium
Liberia
Liberty
Liberty Bay
Liberty Center
Liberty City
Liberty East
Liberty Estates
Liberty Gardens
Liberty Green
Liberty Grove
Liberty Hall
Liberty Heights
Liberty Hill
Liberty Homes Estates Sec
Liberty Homes Estates Sec 5
Liberty Knoll
Liberty Manor
Liberty Mobile Home Park
Liberty Oaks
Liberty Park
Liberty Park Estates Sec
Liberty Park Estates Sec 2
Liberty Pk Amd Pl 1st Add
Liberty Place
Liberty Plaza
Liberty Run
Liberty Square
Liberty Square Condo
Liberty Township
Liberty Villae
Liberty Village
Liberty West
Liberty Woods
Library Commons
Lido Bay
Lifestyle At Sully Station
Lighthouse Colony
Lighthouse Colony Co-Op
Lighthouse Commons
Lighthouse Cove
Lighthouse Cove At Tequesta Condo
Lighthouse Crossing
Lighthouse Estates
Lighthouse Lakes
Lighthouse Manor
Lighthouse Point
Lighthouse Point 2 Sec
Lighthouse Point 2nd Sec
Lighthouse Point 3rd Sec
Lighthouse Point 4th Sec
Lighthouse Point 5th Sec
Lighthouse Point 6th Sec
Lighthouse Point Estates
Lighthouse Point Ext
Lighthouse Point First Sec
Lighthouse Point Gardens
Lighthouse Point Gardens North
Lighthouse Point Gardens South
Lighthouse Point Plaza Condo
Lighthouse Point Yacht Cl
Lighthouse Sound
Lighthouse Terrace Co-Op
Lighthouse Tr Pk
Lighthouse Villages
Lighthousebay
Lightle Subdivision St Lucie Village
Lightsey Family Ranch
Lightship Cove
Lilac Gardens Condo
Lillian Court At Tysons
Lily Ponds
Lilyfield
Lima Addition
Limberland
Lime Bay
Lime Bay Condominium
Lime Bay Condominium 2
Lime Bay Condominium 3
Lime Bay Condominium 5
Lime Bay Condominium 6
Lime Bay Condominium 7
Lime Bay Condominium 8
Lime Grove
Lime Grove Estate Sec 1
Lime Grove Estates Sec 2
Lime Grove Gardens
Lime Spring Village
Limerick
Limerick Ctr
Limestone
Limestone Acres
Limestone Cay
Limestone Hills
Limestone Hills West
Limestone Terrace
Limetree Condo
Limewood Grove
Limonar Estates
Limpopo North
Lincoln
Lincoln At Century Village Condo
Lincoln Bay Towers Condo
Lincoln City Sec A
Lincoln City Sec G
Lincoln City Sec H
Lincoln Court
Lincoln Crest Mhp
Lincoln Estates
Lincoln Estates Mhp
Lincoln Ests
Lincoln Garden Co-Op
Lincoln Heights
Lincoln Heights Resub
Lincoln Manor
Lincoln Palace Condo
Lincoln Park
Lincoln Park Add To Homes
Lincoln Park Corr Plat
Lincoln Park First Add
Lincoln Park No 2
Lincoln Park Replat
Lincoln Park Sixth Add
Lincoln Park Third Add
Lincoln Place
Lincoln Place Condo
Lincoln Plaza Condo
Lincoln Road Villas Condo
Lincoln Road Villas South
Lincoln Sub
Lincoln Terrace
Lincoln Terrace Sub
Lincoln Towers Condo
Lincoln Towers Condominium
Lincoln West Towers Condo
Lincolnia
Lincolnia Hills
Lincolnia Park
Lincolnshire>
Linconia Park
Linda Knolls- Worrells A
Linda Terrace
Lindac Sub
Lindal Apts Condo
Lindale Heights
Lindas Casas
Lindbergh's Landing
LindberghS Landing
Linden
Linden Estates
Linden Gardens
Linden Green
Linden Grove
Linden Hall
Linden Heath
Linden Hill Villag
Linden Knoll
Linden Row Condominium
Lindentowne
Lindfield Unit Four
Lindgren East
Lindisfarne On Fisher Isl
Lindsey Lanes Subdivision Phases Ii-C And Ii-D
Line Lexington
Linganore Garden Condominiums
Linganore View
Linglestown
Link At Colmar
Link At W Squared
Links At Emerald Dunes Condo
Links At Gettysburg
Links At Savanna Club
Links Place
Linkside
Linkwood
Linns
Linnwood
Linover
Linscott Addn
Linstead
Linstead On The Severn
Linthicum
Linthicum Heights
Linthicum Heights Annex
Linthicum Oaks
Linton At Ballenger
Linton Woods Condo
Linway Park Of Mclean
Linwood
Linwood Gardens No 1
Linwood Gardens No 2
Linwood Knolls
Linwood Landing
Lions Crossing
Lions Gate
Lionsgate
Lisa Lake Mbh Park
Lisardo Sub
Lisbon Estates
Lisette Condo
List
Lister Estates
Lititz
Lititz Borough
Lititz Mobile Home Park
Lititz/Brickerville
Lititz/Pebble Creek
Lititz/Warwick Twp
Little Britain
Little Brook
Little Club Condo
Little Club Condo The
Little Egg Harbor
Little Egg Harbor Tw
Little Elk Creek V
Little Falls
Little Flower Mobile
Little Gap Estates
Little Georgetown Estates
Little Hollywood
Little Italy
Little Lake Weir
Little Mahanoy Towns
Little Meadows
Little Mill
Little Mill Woods
Little Oaks
Little Orange Lake
Little Pines Farms
Little Pond
Little Pond Park Residences Condo
Little Ranch Estates
Little Ranches
Little Ranches 1st Add
Little Ridge Estates
Little River Farms
Little River Fruit Lands
Little River Gardens
Little River Gardens Amd
Little River Sq Cond
Little River Trs
Little River Turnpike
Little Rocky Run
Little Salisbury
Little Susan
Little Venice
Little Venice No2
Little Vienna Estates
Littlebrook
Littlestown
Littlestown Borough
Live Oak
Live Oak Acres Unit 1
Live Oak Condo Eleven
Live Oak Condo Five
Live Oak Condo Nine
Live Oak Condo Seven
Live Oak Condo Twelve
Live Oak Condominium
Live Oak Condominium One
Live Oak Condominium Two
Live Oak Of The Hammocks
Livermore Estates
Livingston Grove
Livingston Heights
Livingston Homestead Resub
Lkes Edge Ranch
Lks Of Meadow Vilg Homes Condo 9
Lktl1 Lake Tulane
Llanerch
Llangollen Estates
Llano Grande Liberia
Llanwelyn Gardens
Lloret
Lloyd Estates
Lloyd Estates Add Corr Plat
Loblolly Bay
Loblolly Pines
Loch Glade Sanctuary
Loch Haven
Loch Hill
Loch Linden
Loch Lomond
Loch Lomond Sec 3
Loch Lynn Heights
Loch Raven
Loch Raven Heights
Loch Raven Manor
Loch Raven Village
Lochearn
Lochern
Lochloosa Lakefront
Lochmoor
Lochwood
Lock Harbor
Locke Landing
Lockes Crossing
Locklears Knoll
Locks Landing
Locks Landing 01
Locksley
Locksley Hall
Locust Commons
Locust Dale
Locust Grove
Locust Grove Estates
Locust Hill
Locust Hill Estates
Locust Lake Village
Locust Meadows
Locust Point
Locust Ridge
Locust Run
Locust Springs
Locust Street
Locustwood
Lodestone
Lodestone On The Golf Course
Lodestone Sub
Lodge Forest Manor
Lodgecliff
Loft District
Loftridge
Lofts
Lofts At Creekside
Lofts At Hollywood Statio
Lofts At Hollywood Station
Lofts At Mayfair Condo
Lofts At Metrowest
Lofts At Reston Station
Lofts At Village Walk
Lofts On Brickell Ii Cond
Log Harbor Condominium
Log Run
Logan
Logan Circle
Logan Crest
Logan Crest Rev Pl
Logan Greene
Logan Meadows
Logan Square
Logan Woods
Logan's Rest
Logan/Dupont
Logan/Shaw
Logan/U Street
Loganberry Village
Logans Reserve
Loggers Run / Ponderosa
Lohr's Orchard
Loisdale Estates
Loladero Manor
Loma Del Escobero-Envigado
Loma Vista Section One
Lomas De Chapultepec
Lombardo Subd Sec A
Lombardy Replat
Lonaconing
London Estates 1st Addn
London Grove Twp
London Square
London Towers
London Towers Condo
London Town West
London Towne
London Vil
London Woods
Londonderry Estates
Londontown
Lone Palm Park Unit No 1
Lone Pine
Lone Pine Estates
Lone Star Ranch
Long Acres
Long Bar Harbor
Long Beach
Long Beach Colony
Long Beach Estates
Long Beach Heights
Long Beach Township
Long Branch
Long Branch Village
Long Cove
Long Cove Estates
Long Creek
Long Estates
Long Farm
Long Gate
Long Green Valley
Long Key Estates 2nd Add
Long Key Proj Prop Line S
Long Key Prop Plat Of Sur
Long Lake Estates
Long Lake Estates 1 As
Long Lake Palms/ Ponte Vecchio
Long Lake Ranches Plat On
Long Lake Ranches Plat Th
Long Lake Ranches Plat Three
Long Level
Long Meadow Estates
Long Meadows
Long Neck Shores
Long Point On The Magothy
Long Reach
Long Reach House Condominiums
Long View
Long View Shores
Longacre Village
Longbeach Condominius
Longboat Estates
Longfellow
Longfield Woods
Longford Crossing
Longleaf-Plat 1>
Longmead
Longmead Crossing
Longmeadow
Longridge At Belair
Longshore At Jonathans Landing
Longshoremens
Longstown Village
Longview
Longview Beach
Longview Beach Chaptico-Bushwood
Longview Place
Longview Ridge
Longway
Longwood
Longwood 2 Condo
Longwood Condominiums
Longwood Crossing
Longwood House Condo
Longwood Knolls
Longwood Preserve
Longwood Three Condo
Longwood Towers Condo
Longwood Village
Longwood Village Phase 1
Longwood Village Phase 3a
Look Homesites
Look Homesites No 3
Lookout Bay Condo
Lorane Orchard
Lorcom Grove
Lorcom House
Lord Baltimore
Lord Fairfax Estates
Lords Landing
Lords Landing Village
Loreley Beach
Lorfax Heights
Lori-Lynn Condo
Lorida
Lorraine Park
Lorton
Lorton Overlook
Lorton Town Cntr Landbay
Lorton Valley
Lorton Valley North
Los Altos Villas, Casa De Campo, Dominican Republi
Los Arboles Condo
Los Cayos
Los Cedros
Los Cinco The File
Los Corales
Los Jardines Estates
Los Lagos, Casa De Campo, Dominican Republic
Los Mangos 1, Casa De Campo, Dominican Republic
Los Mangos Patio Villas And Townhomes
Los Molles
Los Naranjos
Los Olas
Los Palacios Condo
Los Palacios I Condo
Los Palacios Ii Condo
Los Paseos
Los Paseos Of Via Verde Replat
Los Pelcanos, Bocagrande
Los Portales Sec B Condo
Los Rayos De Sol
Los Suenos
Los Suenos Condo
Lost Lake
Lost Lake At Hobe Sound
Lost Mountain
Lost River Bend
Lost River Cove
Lost River Cove Ph 02
Lost River Glen
Lost River Manors
Lost River Valley (Lrvpoa)
Lost River Valley Properties Association
Lost Tree
Lost Tree Club Condo 1 Old Port Village Pt
Lost Tree Estates
Lost Tree Preserve
Lost Tree Preserve Pd Phases 4 And 5
Lost Tree Preserve Pd, Phase 1
Lost Valley
Lot 15 Hills Of Windsor S/D. Qc 1034-2102, Wd 1486
Lot 16, Blk 1661, 33rd Add To Port Charlotte
Lot 17 Blk 459- Port Charlotte Sub 09
Lot 2 Of Santana Acres Pb-B43p1 699p151 658p236 66
Lot 3 Blk 2394 49th Add To Port Charlotte Ori 2005
Lot 4 Blk 212
Lot 5 Blk 521 11th Add To Port Charlotte
Lot A Of Tract 18 East 1/2
Lote San Jose
Lothian Estates
Lothian Woods
Lotis Wellington
Lots 11,12,13, Blk B'', Of The Farms At Quincy, Un
Lotte 21-22 Zona Federal
Lottsford
Lottsford Community
Lottsford Townhouses
Lotus
Lotus Boca Raton
Lotus Edge
Lotus Gardens Condo
Lotus Palm
Loucroft Farms
Loudon's View
Loudoun
Loudoun County
Loudoun Crossing Condominium
Loudoun Manor
Loudoun Parkway Center
Loudoun Tech Center
Loudoun Valley Carlisle
Loudoun Valley Estates
Loudoun Valley Estates 2
Loudoun Valley Ridges
Loudoun View Condo Flats
Lough Erne Section One
Louis L Lee
Louisa
Love Creek Park
Love Creek Woods
Lovelace Lodges
Loveladies
Loveton Farms
Lovettsville
Lovettsville Town Center
Lovins Townhouses Condo
Lower Allen Township
Lower Bank
Lower Charles Village
Lower Chelsea
Lower Mahanoy Township
Lower Marlboro Landing
Lower Matecumbe Beach
Lower Moyamensing
Lower Paxton Township
Lower Valley
Lower Windsor
Lower Windsor Twp
Lowes Island
Lowes Island/Cascades
Loxahatchee
Loxahatchee / Acreage
Loxahatchee / The Acreage
Loxahatchee Acreage
Loxahatchee Club
Loxahatchee Club At Maplewood 1 Ph 2
Loxahatchee Club At Maplewood 3 Ph 2
Loxahatchee Club At Maplewood 4 Ph 2
Loxahatchee Club At Maplewood 5 Ph 2
Loxahatchee Club At Maplewood 6 Ph 2
Loxahatchee Club At Maplewood 7 Ph 2
Loxahatchee Club At Maplewood 8 Ph 2
Loxahatchee Club At Maplewood 9 Ph 2
Loxahatchee Farms East
Loxahatchee Groves
Loxahatchee Groves In
Loxahatchee Lakes
Loxahatchee, Royal Palm Bch
Loxahatchee, The Acreage
Loy Estates Ii
Loy Landing
Lrvpoa
Lsolei At Hallandale Beac
Ltc Ranch West Phase 1
Ltc Ranch West Phase 1 Brystol At Wylder
Ltc Ranch West Pod 2 Phases 1 And 2
Ltc Ranch West Pod 6a Phase 1
Ltc Ranch West Pod 9 Phases 2 And 3
Lualeah A Sub
Luc1 Lake Lucy Shores
Lucas Lake Est
Lucaya Lake Club Phase 1a
Lucaya Pointe - Phase 2
Lucaya Village 1-B Condo
Lucaya Village 1-C Condo
Lucaya Village 1-D Condo
Lucaya Village 1-E Condo
Lucaya Village 2-A Condo
Lucaya Village 2-B Condo
Lucaya Village 2-D Condo
Lucaya Village 2-E Condo
Lucaya Vlg Ph 2
Lucerne Condo
Lucerne Gardens
Lucerne Greens Condo
Lucerne Homes East 2
Lucerne Homes East 4
Lucerne Lakes Fairway Club
Lucerne Lakes Golf Colony
Lucerne Lakes Golf Colony Condos
Lucerne Lakes Golf Colony Condos 1 Thru 12 And 14
Lucerne Lakes Home Village Ii 2nd Add
Lucerne Lakes Homes Villa
Lucerne Lakes Homes Village I 6th Add
Lucerne Park
Lucerne Park Condos
Lucerne Park Condos 1
Lucerne Park Condos 1, 1a
Lucerne Park Condos 1, 1a, 2 Thru 15 & 23 Thru 28
Lucerne Park Condos 1,1a,2 Thru 15 And 23 Thru 28
Lucerne Park Condos 1,1a,2thru 15 And 23 Thru 28
Lucerne Park Conds 1, 1a, 2 Thru 15 & 23 Thru 28
Lucerne Pointe Condo C
Lucerne Pointe One,Two,Three Four,Seven,Eight,Nine
Lucille Island
Lucille Park
Lucindia
Lucketts
Lucky Estates
Lucky Star Estates
Lucky Start At Sunrise Es
Ludlam Acres
Ludlow
Ludlum Lake Townhouses Se
Ludlum Plaza
Lumber City
Lumberville
Lumberyard Condos
Lumiere
Luminara
Lumus Park
Luna Ocean Residences Con
Lunar Manor
Luray
Luray Landing
Lurgan
Lurgan Twp
Lush Apartments
Lutherville
Lutherville Heights
Lux
Lux At The Grove Condo Bl
Luxmanor
Luxor Homes
Luxuria
Luxury Coral Living Condo
Luz De Andalucia Condo
Lyfe Beach Resort
Lyfe Resort
Lykens Borough
Lyn Woods
Lynbrook
Lynbrook Court Condo Ph I
Lynbrook Landing
Lynch
Lynch Cove
Lynch Point
Lyndale Addition
Lyndale Second Addition
Lyndam Hill
Lyndhurst
Lyndhurst A Condo
Lyndhurst Condos
Lyndhurst E Condo
Lyndhurst K Condo
Lyndon Park U/R
Lyndwood
Lyndwood Manor
Lynhaven
Lynn Forest
Lynn Haven Plat #2
Lynnbrook
Lynnbrook Sub
Lynne Acres
Lynnfield
Lynnmoor 1st Add
Lynnwood
Lynwood
Lynwood Estates
Lynx Golf Estates
Lyon Estates
Lyon Park
Lyon Village
Lyondale Meadows
Lyons Creek Hundred
Lyons Creek Mobile Estates
Lyons Creek Overlook
Lyons Industrial Park
Lyons Park First Add
Lyons Ranches
Lyons West
Lyons's Unrec
Lyonswood
M & S Sub
M Resort Residences Condo
M&P Pike
M.A. Burdens Sub.
M/L Unrec John B Coffey Sub
M2 M2-Downtown Stuart
M5-Hobe Sound
Mabel Bridge Phase 2 - A Replat
Mac Farlane Homestead
Macao
Macarthur
Macarthur Park
Macedonia Baptist Church Subdivision
Macfarlane Homestead
Macgregor Downs
Machacek
Machodoc Estates
Macintosh Crossing
Macoy
Macridge Estates
Macson Heights
Macungie Village
Maddex Farm
Maddock Add 4
Maddock Add Wpb
Madison
Madison Bay Landing
Madison Condo
Madison Condominium
Madison Court
Madison Crescent
Madison Crescent Condominium
Madison Downtown Condo
Madison Eastend
Madison Edinburg
Madison Estates
Madison Green
Madison Green 1
Madison Green 1 Pars A, H And K
Madison Green 1 Pars F And J
Madison Green 1 Pars F, G And I
Madison Heights
Madison Lakes
Madison Lane
Madison Manor
Madison Mews
Madison Park
Madison Park Historic District
Madison Place Phase 2
Madison Ridge
Madison Station
Madison Village
Madison Woods
Madrid
Madrid Terrace Condo
Magaluf Towers Condo
Maggie Anna
Magness Farms
Magness Mill
Magnolia Bay
Magnolia Bay Condomimium
Magnolia Bend
Magnolia Condo
Magnolia Court At Waterway Village
Magnolia Estates
Magnolia Farms
Magnolia Gardens
Magnolia Gardens Consolid
Magnolia Gardens Consolidated
Magnolia Gardens Unit 05
Magnolia Gdns Consolidate
Magnolia Green
Magnolia Heights
Magnolia Hill
Magnolia Lakes
Magnolia Lakes At St Lucie Wes
Magnolia Lakes At St Lucie West Phase 2
Magnolia Lakes Phase 1 St
Magnolia Lakes Phase 1 St Lucie West No 151
Magnolia Lakes Phase 2b
Magnolia Landing
Magnolia Lane Condo
Magnolia Manor
Magnolia Meadows
Magnolia Park At Wildewood
Magnolia Park Central Ph B
Magnolia Place
Magnolia Point At The Preserve
Magnolia Ridge
Magnolia Ridge Of Palm Ci
Magnolia Ridge Of Palm City Pud
Magnolia Springs
Magnolia Sub
Magnolia Terrace
Magnolia Woods Condominiums
Magnolias
Magnolias At Lansdowne Woods
Magothy Beach
Magothy Forge
Magothy Manor
Magothy Marina Condo
Magothy Park
Magruder East-Plat 1>
Magruders Overlook
Mahanoy
Mahanoy City
Mahanoy Plane
Maheu Estates
Maheu Estates Add 1
Maheu Sub Sec A
Mahogany Isle Homes Condo
Mahogany Key Condo #7
Maiden Choice Village
Maidencreek Estates
Maidstone
Maidstone Farm
Main Farm
Main St Village
Main Street
Main Street Green
Main Street Lofts Condo
Main Street Villag
Main Subdivision
Main Tree Farm
Mainlands Of Tamarac Lake
Mainlands Of Tamarac Lakes
Mainlands Of Tamarac Lakes Section 4
Mainlands Of Tamarac Lakes Third Sec
Mainsail Condominium
Mainstreet
Maison Grande
Maison Grande Condo
Maizefield
Majestic Court
Majestic Cove Condos
Majestic Estates
Majestic Estates 1st Addn
Majestic Estates 3rd Addn
Majestic Gardens
Majestic Gardens Condomin
Majestic Gardens Condominium
Majestic Gardens Condominium H
Majestic Isles
Majestic Isles 1
Majestic Isles 2
Majestic Isles 3
Majestic Meadows
Majestic Oaks Subdivision
Majestic Ridge
Majestic Tower
Majestic View
Majestic Woods
Majesty West
Majorca Estates
Majorca Isles I Condo
Majorca Isles Ii Condo
Majorca Isles Iii Condo
Majorca Isles Iv Condo
Majorca Towers Condo
Majors Choice
Makefield Glen
Makefield Manor
Malabar
Malaga Towers Condo
Malaluka Gardens
Malbrook
Malcolm Peacocks
Maldonado Punta Del Este
Mali Kai Condominium
Malibu Gardens Condo
Malibu Groves 4th Add
Malky Condo
Mallard Bay
Mallard Cove Condominiums
Mallard Creek
Mallard Creek M D 21 & 21a
Mallard Lakes
Mallard Landing
Mallard Point
Mallard Pointe
Mallard Pond
Mallard Ridge
Mallards Landing
Mallory Creek At Abacoa 2
Mallory Square
Maloney Sub
Malvern
Malvern Boro
Malvern Chase
Malvern Hill
Malvern Of Madison
Malvern Walk
Malverne Homes
Malvina Park
Manada Court Villas
Manahawkin
Manahawkin - Atlantic Hills
Manahawkin - Downtown
Manahawkin - Fawn Lakes
Manahawkin - Island Crest
Manahawkin - Mallard Island
Manahawkin - Manahawkin Mhp
Manahawkin - Perrys Lake
Manahawkin - Stafford Park
Manahawkin - The Escapes
Manahawkin - The Landings
Manahawkin - West Bay Village
Manalapan
Manana
Manana Estates 2
Manana Estates 3
Manaranda Village
Manaranda Village Condo
Manassas
Manassas City
Manassas Gateway
Manassas Park
Manassas Park Sec 5
Manatawny Village
Manatee Bay
Manatee Bay Club
Manatee Bay Rev
Manatee Condo
Manatee Isles
Manatee Key
Manatee Mobile Home Park
Manatee Pointe At Lago Mar Condo
Manayunk
Manchester
Manchester Boro
Manchester Election District
Manchester Estates
Manchester Lakes
Manchester Manor
Manchester Meadows
Manchester Park
Manchester Square
Manchester Twp
Mandalay
Mandalay Subdivision
Mandarin Lakes
Mandarin Oriental Residences West Palm Beach
Mandarlie Mattamy At Southern Grove Plat 1 Replat
Manderlie
Manglaralto
Mango Gardens
Mango Heights
Mango Hill
Mango Hill Condo #8
Mango Hill Condo No 2
Mango Key Condominium
Mango Lake
Mango Villas Townhouse
Mangone And Sons Plat No
Mangonia Hills
Mangonia Park
Mangowood
Mangowood Pt 2
Mangrove House Condo
Mangus Sub Sec 1
Mangus Sub Sec 2
Manhattan Beach
Manhattan Woods
Manheim
Manheim Borough
Manheim Twp
Mann A T Addition
Mann Sub
Mann Township
Manning Overlook
Manning Square Towns
Manoa
Manokeek
Manokin
Manokin Village
Manor Club Condo
Manor Forest
Manor Grove Village
Manor Grove Village 1
Manor Grove Village Four Condo
Manor Grove Village One
Manor Grove Village One I
Manor Grove Village One Inc
Manor Grove Village Three Condo
Manor Grove Village Two Condo
Manor Hall
Manor House Condo
Manor Lake
Manor Oaks
Manor Overlook
Manor Park
Manor Twp
Manor Wood Estates
Manor Woods
Manors
Manors At Ballenger Creek
Manors At Mcnair Farms
Manors At Montgomery
Manors At Saratoga
Manors At Stonegate
Manors Of Inverrary
Manors Of Inverrary 1-11
Manors Of Inverrary Condo
Manors Of Inverrary I-1
Manors Of Inverrary I-10
Manors Of Inverrary I-2
Manors Of Inverrary I-3
Manors Of Inverrary I-4
Manors Of Inverrary I-5
Manors Of Inverrary I-7
Manors Of Inverrary I-8
Manors Of Inverrary I-9
Manors Of Inverrary Xi
Manors Of Inverrary Xii
Manors Townhouse 14-15 Co
Manresa Overlook
Mansfield
Mansfield At Century Vill
Mansfield At Century Village Condo
Mansfield Club
Mansfield Manor
Mansfield Park
Mansfield Park Condo
Mansfield-Plat 1>
Mansion Estates Replat 2
Mansion Farms
Mansion Heights
Mansionette Homes Sec 2
Mansions At Acqualina
Mansions At Evergrene Condo
Mansions At Sion
Mansions At Sion First Ad
Manson 1 Condo
Mantel Condo
Mantell
Mantua
Mantua Hills
Mantyharju Lantana
Manzo Mar
Map Of Larkins Pines
Map Of Miami Dade Co. Fl.
Map Of Miami Dade Co. Fl. Pb B-41
Map Of Perrine
Maple Commons
Maple Dam
Maple Del
Maple Glen
Maple Glen Ct
Maple Grove
Maple Heights
Maple Heights- Addn
Maple Highlands
Maple Hill
Maple Island
Maple Lawn
Maple Leaf Villas Condo Association, Inc
Maple Plains
Maple Pointe
Maple Ridge
Maple Ridge 167-38 B
Maple Ridge At Ave Maria
Maple Ridge At Ave Maria Phase 6b
Maple Ridge At Ave Maria P
Maple Ridge At Ave Maria Ph 7b
Maple Ridge Reserve
Maple Run
Maple Shade
Maple Shade Village
Maple Springs
Maple Sq Mhp
Maple Valley Estates
Maple Wood
Maple Wood Villas
Maplecrest
Mapleflower
Maplehurst
Maples Mhp
Mapleside
Mapleton
Mapleview
Maplewood
Maplewood Ph 1
Maplewood Townhouses
Maplewood Village
Mar Del Plata Condo
Mar Len Gardens
Mar-Azul Condo
Mar-Jo-Dor Acres
Mar-Len Gardens
Mar-Len Gardens No 1 Corp
Mar-Len Gardens No 10 Cor
Mar-Len Gardens No 12 Cor
Mar-Len Gardens No 2 Corp
Mar-Len Gardens No 3 Corp
Mar-Len Gardens No 4 Corp
Mar-Len Gardens No 5 Corp
Mar-Len Gardens No 6 Corp
Mar-Len Gardens No 7 Corp
Mar-Len Gardens No 7 Corp Co-Op
Mar-Len Gardens No 8 Corp
Mar-Len Gardens No 8 Corp-Co-Op
Mar-Len Gardens No 9 Corp
Mar-Len Gardens No 9 Corp-Co-Op
Mara Lago Cay
Marabou Meadows
Maracay Campestre
Maralagfo Cay
Maralago Cay
Maralex Gardens Estates
Maralex Homes
Maranatha Apts Inc
Marathon Beach
Marathon Estates
Marathon Village
Marave Lxr Condo
Marave Lxr Residences
Marave Lxr Residences Cond
Marave Lxr Villa 40
Marave Villa 37
Maravilla Estates
Maravilla Gardens
Maravilla Gardens Sub
Maravilla Gardens Subdivision Unit 3
Maravilla Gardens Unit 1 Resubdivision
Maravilla Heights Subdivision
Maravilla Subdivision
Maravilla West
Marbella
Marbella Park 5 Th Add
Marbella Apts Condo
Marbella Bay
Marbella By The Grove Con
Marbella Condo
Marbella Cove
Marbella Ii
Marbella Sub
Marbella Tower Condo
Marble Hill
Marbrisa Prd
Marbrisa Unit One
Marbury
Marcano Estates
March Estates Amen
March Harbour
Marchand
Marchwood
Marcia-Jane Sub
Marco Beach
Marco Beach Unit 2
Marco Beach Unit 7
Marco Island
Marco Polo
Marconi Park East
Marconi Park West
Mardella Run
Marden Heights
Marea Condo
Marenas Resort Residences Condo
Marfe Sub
Margaret Manor
Margaretta Mhp
Margaritas
Margaritas, Lima Peru
Margate
Margate 1st Add 39-1 B
Margate 3rd Add
Margate 3rd Add-Resub Of
Margate 4th Add
Margate 4th Add 46-27
Margate 5th Add
Margate City
Margate Estates Sec 2
Margate Estates Sec Three
Margate Gardens Apartment
Margate Gardens Condo
Margate Realty No 2
Margate Shores
Margate Shores 4th Add
Margate Sixth Add Sec 3
Margate Sixth Add Sec 6
Margate Sixth Add Sec Two
Margate Village Phase I C
Margate Village Phase I Condo
Margate Village Phase Ii
Margate Village Phase Ii Condo
Margaux
Maria Luisa Estates Sec 2
Mariana Park
Marianas Homes
Mariellen Park
Marietta
Marietta Borough
Marigold
Marigold Gardens
Marigold Gardens Condo
Marina At Bluffs 05-26
Marina At Peppers Creek
Marina At The Bluffs
Marina At The Bluffs Condo
Marina At Twelve Oaks Con
Marina At Twelve Oaks Condo
Marina Bay Club Condo Hot
Marina Bay Cond Decl Filed 3-20-81
Marina Bay Condo
Marina Blue Condo
Marina Cap Cana
Marina Cove At Harbor Vil
Marina Del Mar Condo
Marina Del Mar Condomini
Marina Del Palma
Marina Gardens 2
Marina Grande On The Halif
Marina Grande On The Halifax
Marina Grande Resorts
Marina Grande Riviera Beach Condo
Marina Lakes 1st Addn
Marina Landings
Marina Oaks Condo
Marina Palms
Marina Palms Residences
Marina Palms Residences N
Marina Palms Residences North Condo
Marina Palms Residences S
Marina Palms Residences South Condo
Marina Palms Yacht Club
Marina Palms Yatch
Marina Real Condo No 1
Marina South Ii
Marina Subd No 2
Marina Tower Condo
Marina Towers
Marina Village
Marina Village At Boynton
Marina Village At Boynton Beach
Marina Village At Boynton Beach Condo
Marina Village At Boynton Beach Condominium
Marina Village At Boynton Beach Marina
Marina Villas At Hawks Cay
Marinablue Condo
Marine Colony
Marine Colony Condo
Marine Colony Condominium
Marine Colony Villas Co-O
Marine Oaks Village
Marine Tower
Marine Tower Condo
Marinello Estates
Mariner
Mariner At Jupiter Yacht Club Condoiu
Mariner Bay
Mariner Cay 03 Condo
Mariner Cay Condo
Mariner Cay Yacht Club
Mariner Court Condo
Mariner I Condo
Mariner Iv Condo
Mariner Sands
Mariner Sands 01
Mariner Sands 03
Mariner Sands Club Villas Condo
Mariner Sands Country Club
Mariner Sands Fairway Apts 02 Condo
Mariner Sands Fairway Villas 03 Condo
Mariner Village
Mariner Village Garden Co
Mariner Village Garden Condo #3
Mariner Village Of Martin County Condo
Mariner Village Th Condo
Mariners Cove
Mariners Cove 1
Mariners Cove Of Eagle La
Mariners Lake Heights
Mariners Landing
Mariners Retreat
Mariners Watch
Mariners Way Condo
Marioin Oaks
Marion Hills
Marion Oakes Wra (9050)
Marion Oaks
Marion Oaks #9
Marion Oaks 07
Marion Oaks Un 02
Marion Oaks Un 04
Marion Oaks Unit
Marion Oaks Unit 01
Marion Oaks Unit 07
Marion Oaks Unit 09
Marion Oaks Unit 11
Marion Oaks Unit 12
Marion Oaks Unit 4
Marion Oaks Unit 4 Int Lots
Marion Oaks Unit 7 Int Lot
Marion Pl
Marion Place
Mariposa Pointe At Weston
Mariquita, Tolima, Colombia
Marisol Ph 2
Marissa Estates
Marivi Gardens
Marjohn Park
Mark 70
Mark Resort
Mark-Alan Manor
Market Center Condominium
Market Square
Market Street At Town Center
Markham A Condo
Markham B Condo
Markham C Condo
Markham D Condo
Markham F Condo
Markham H Condo
Markham K Condo
Markham L Condo
Markham View Condominiums
Markhams Grant
Marks Sub
Marlboro Estates
Marlboro Heights
Marlboro Meadows
Marlboro Ridge
Marlboro Ridge Estates
Marlboro Riding
Marlboro West
Marlborough
Marlborough Point
Marlborough Towne
Marldale Sub
Marleigh
Marley
Marley Park Beach
Marley Run
Marlin Bay Apts Co-Op
Marlin Chase
Marlin Park
Marlin Ridge
Marlo Heights
Marlow
Marlow Heights
Marlow Towers
Marlow Towers Condominiums
Marlow-Olson Condo
Marlowe Woods
Marlton
Marlton Hills
Marlton Lakes
Marlton Leas
Marlton Meadows
Marlton Meeting
Marlton South
Marlton Town Center
Marlton Village
Marlton Woods
Marlwood Estate
Marlyn Terrace
Marovelli Forest
Marple
Marplewoods
Marquesa Condo
Marquesa Condo Sub
Marquis At Vienna Station
Marquis Condo
Marseilles Deco Condo
Marsh Cove
Marsh Farm Estates
Marsh Harbour
Marsh Harbour 3 Condominiu
Marsh Harbour 4 Condo
Marsh Harbour 49 Condo
Marsh Harbour Trs A Thru
Marsh Island
Marsh Island In Lewes
Marsh Island Pd
Marsh Landing
Marsh Landing At The Reserve Phase 2
Marshall
Marshall Creek Far
Marshall Grove Estates
Marshall Heights
Marshall Manor
Marshall Park
Marshall Terrace
Marshall View I
Marshall Woods
Marshall's Corner
Marshall's Landing
Marshall's Landing Sub
Marshall, Va
Marshalls Commons
Marshalls Everglade
Marshalls Everglade Sub 2
Marshallton
Marshallton Hgts
Martha A Pearce Sub
Martha Bright Farms
Marthas Landing
Marthas Vineyard
Martic Twp
Martin Bros Ludlam Acres
Martin County Ranch Commu
Martin County Ranch Community
Martin Cox Dev
Martin Downs 29a
Martin Downs 48
Martin Downs Plat No 20 (Aka Monarch Country Club)
Martin Downs Plat No 29 (Aka Monarch Country Club)
Martin Downs-Mallard Creek
Martin Suburban Acres
Martin/Marangos Plat
Martindale
Martingham
Martinique
Martinique 2
Martinique 2 Condo
Martinique At Abacoa 1
Martinique At Abacoa 2
Martinique At Oasis
Martinique At Oasis Repla
Martinique Ii Condo
Martinique No 2 Condo
Martinique Village I Condo
Martinique Village Ii A Condo
Martinique Village Ii B Condo
Martinique Village Ii C Condo
Martinique Village Ii D C
Martinique Village Ii D Condo
Martinique Village Ii E Condo
Martinique Village Ii F C
Martinique Village Ii F Condo
Martinique Village Ii Wynmoor
Martinique Village Iii Co
Martins Beach
Martins Crossing
Martins Port
Martins Ridge
Martinsburg
Martinsburg City
Martinsburg Corp
Martinsburg Pike
Martinsburg Station
Marty Axman
Marumsco
Marumsco Acres
Marumsco Hills
Marumsco Village
Marumsco Woods
Marvin Gardens La Plata
Marwood
Mary And William Brickell
Mary Ann Estates 1st Addn
Mary Ann Estates First Ad
Mary Chappell Subdivision
Mary Homes Sub Sec A
Mary Knoll
Mary Knolls
Mary Lea Park
Mary Washington Square
Mary's Landing
Mary-Catherine Estates
Maryland Avenue
Maryland City
Maryland Farms
Maryland Farms Condo
Maryland Gardens Sub
Maryland Manor Mobile Home Park
Maryland Park
Marysville Boro
Maryvale
Marywood
Masaya Nicaragua
Mashta Island
Mashta Island A Replat Of
Mason Dixon Court
Mason Farm
Mason Hills
Mason Run
Mason Square
Mason Sub Amended Plat
Masons Passage
Masontown
Masri Estates
Mass Ave Forest
Massachusetts Avenue Heights
Massachusetts Condo
Massada Condo
Massadale
Massanetta Springs
Massanutten
Massanutten Farms West
Massanuttern
Masseria Monticelli Ostuni
Masseys Mill
Masters At Eagleton 1
Masters At Eagleton At Pga National
Masters Retreat
Masthope Mtn. Community
Mata Grande, Ambergris Caye, Belize
Matanzas
Mate Ocean Bay Subd Sec 1
Matecumbe Ocean Bay (75.0)
Matecumbe Ocean Bay Sec 2
Matecumbe Sandy Beach
Mates Beach 4
Matlacha
Mattamy At Southern Grove
Mattawoman Woods Ind Head
Matteo Court
Matteo Court At Barwick
Matthews Manor
Matthews Meadows
Matthewstown Run
Mattison Estate - Upper Dublin
Maugans Meadows
Maugansville
Maule Fed Hwy Industrial
Maurertown
Maury Heights
Maxa Meadows
Maxwell Hall
Maxwell Place
May's Quarter
Maya Marca Condo
Mayaca Homesites
Mayaca Manor Unrecorded
Mayan Towers Condo I
Mayapple Woods
Mayberry
Mayberry At Mason Dixon
Mayberry At Stewartstown
Maybury Mansions
Maybury Mansions Condo
Mayetta
Mayfair
Mayfair (East)
Mayfair (West)
Mayfair Apt Co-Op
Mayfair At Evesham
Mayfair At Parkland
Mayfair At Wellington
Mayfair At Wellington Condo
Mayfair Gardens
Mayfair Glen
Mayfair House Condo
Mayfair Of Boca Raton Condo
Mayfair Plat 7
Mayfair-Plat One
Mayfield
Mayfield Historic District
Mayfield Manor
Mayfield Trace
Mayflower Square
Maynor Estates
Maynor Sub
Mayo
Mayo Apartments Assoc Inc
Mays Add
Mays Chapel
Mays Chapel North
Mays Chapel Village
Mays Landing
Mays Landing Village
Maysland
Maytown Village Square
Mazel
Mc Allister Terr Amend
Mc Allister Terrace
Mc Call Park
Mc Connellsburg
Mc Cormick Mile
Mc Donald Park
Mc Duffie Pl
Mc Estates Subdivision
Mc Henry
Mc Kinley Heights
Mc Lartys
Mc Lean Chase
Mc Lean Commons
Mc Lean Court
Mc Lean Hamlet
Mc Lean Province
Mc Lean West
Mc Residential
Mcallister Terr
Mcansh Park
Mcansh Park Replats Of
Mcansh Pk Replat Of Blks 24 & 28
Mcarthur Park Misty Lk Co
Mccahill Estates
Mccarty's Court Subdivisi
Mccauley Crossing
Mccaulley Court
Mcclure Manors
Mcconkey
Mccoy
Mccray Court Subdivision
Mccustion Manor
Mcdaniel
Mcdaniel Heights
Mcdonald Heights
Mcdonald Knolls
Mcdonalds
Mcdonogh
Mcdonogh Oaks
Mcdonogh Township
Mcdonough Township
Mcelderry Park
Mcgranahan Add
Mcgrath Lake Jackson Sho
Mcgregor Estates
Mcguckian
Mcintosh Heights
Mcjunkin Farms Plat
Mckeever Terr
Mckeil Pointe
Mckendree
Mckendree Village
Mckenney Forest
Mckenney Hills
Mckenzie Dev
Mckinney's Grove
Mckinsey Park
Mckinsey Woods
Mckoy Land Co Sub
Mclean Crest
Mclean Estates
Mclean Gardens
Mclean Hills
Mclean House
Mclean House North
Mclean Manor
Mclean Park Manor
Mclean Place
Mclean Place Townhome
Mclean Province
Mclean Station
Mcmeekin Plantation
Mcmullen Square
Mcnair Farms
Mcnair Farms Landbay
Mcnair Farms Landbay 5
Mcnair Farms West
Mcneal Farm
Mcnicol Place Mhp
Mcnurlen Farms Subdivision
Mcrelroy
Mcsherrystown Borough
Mdg Corporate Center
Meade's Crossing
Meadfield
Meadow Acres
Meadow At Dahlgren
Meadow Branch
Meadow Branch South
Meadow Bridge
Meadow Bridge Woods
Meadow Brook
Meadow Brook Condo
Meadow Brook Estates
Meadow Brook Sec 1
Meadow Creek
Meadow Creek Estates
Meadow Crest
Meadow Drive I And Ii
Meadow Glen
Meadow Ground
Meadow Hall
Meadow Hills
Meadow Knoll Townhomes
Meadow Lake
Meadow Lake Estates
Meadow Lane Farms
Meadow Lark Park
Meadow Mountain
Meadow Park
Meadow Park 3
Meadow Pines
Meadow Ridge Estates
Meadow Ridge Villas
Meadow Ridge Villas Codm
Meadow Run
Meadow Run West
Meadow View
Meadow Walk
Meadow Walk Phase 1
Meadow Wood
Meadow Wood Manor #4
Meadow Wood Manor Sec 2
Meadow Wood Manor Sec 4
Meadow Wood Manor Sec 6
Meadow Wood Manor Sec 7
Meadow Wood Manor Sec 8
Meadow Wood Manor Sec 9
Meadow Wood Manor Sec I
Meadow Wood Of The Landings At Wellingto
Meadow Woodmanor Sec 2
Meadow Woods
Meadow Woods Apt
Meadowbranch
Meadowbrook
Meadowbrook Acres
Meadowbrook At Belair
Meadowbrook At Pga Condo
Meadowbrook Condo Apts Bl
Meadowbrook Condo Apts Bld
Meadowbrook Condo Apts Bldg 10
Meadowbrook Condo Apts Bldg 2
Meadowbrook Condo Apts Bldg 7
Meadowbrook Estates
Meadowbrook Lakes
Meadowbrook Lakes 2
Meadowbrook Lakes Condo
Meadowbrook Lakes View
Meadowbrook Lakes View Co
Meadowbrook Lakes View Condo
Meadowbrook Lakes View K
Meadowbrook Park
Meadowbrook Sub
Meadowbrook Towers Condo
Meadowbrook Towers Condo G
Meadowbrook Village
Meadowbrook Woods
Meadowbrooke
Meadowbrooke Hunt
Meadowbrooks Lakes
Meadowcroft
Meadowfield
Meadowgate
Meadowland Cove 1 Of Well
Meadowland Cove 1 Of Wellington
Meadowland Cove 2 Of Well
Meadowland Cove 2 Of Wellington
Meadowland Cove Pl 2 Of Wellington
Meadowland Sub
Meadowlands Commercial Pl
Meadowood
Meadowood Village
Meadowridge
Meadowridge Condo
Meadowridge East Condo
Meadows 300 1
Meadows At Bayard
Meadows At Bulle Rock
Meadows At Morris Farm
Meadows At Port St Lucie Buildings L/M
Meadows At Shawnee
Meadows At Southfield
Meadows At Town Run
Meadows At Town Run Ii
Meadows At White Oak Sub
Meadows At Wicklow
Meadows Condo
Meadows Edge
Meadows In Bowmansville
Meadows Neighborhood
Meadows Of Beautiful Bronson
Meadows Of Chantilly
Meadows Of Crystal Lake
Meadows Of Culpeper
Meadows Of Miramar
Meadows Of Miramar Phase
Meadows Of Port St Lucie Buildings D-R
Meadows Of Westlake
Meadows Of Wilton
Meadows On The Green Cond
Meadows On The Green Condo
Meadows On The Green Condominium
Meadows Park
Meadows Prcl 51 Md 42
Meadows Unit 02
Meadowsatchestnutrid
Meadowsgreen
Meadowvale Manor
Meadowview
Meadowview Estates
Meadowview Park
Meadowview Village
Meadowview/West Creek V
Meadowyck
Meals Development
Meander
Meander Farm Estates
Meanderings Of The Yough
Mearfield
Mecca City
Mechanicsburg Borough
Mechanicsville
Mecklenburg Heights
Mecuda Estates
Med Gardens Sec 2
Med South
Medalist Club
Medalist Village
Medalist Village Club
Medellin
Medfield
Medford
Medford Commons
Medford Farms
Medford Lakes
Medford Mill
Medford Run
Medford Village
Medford Walk
Media
Media Heights
Media Walk
Medinah Homes
Mediterania
Mediterranea
Mediterranea Condo
Mediterranean Apartments
Mediterranean Condo
Mediterranean Village Con
Mediterranean Villas Cond
Mediterrania
Medley Estates
Medwick
Medwick Garth
Meed Racquet Club 4
Meekins Add No 1 Amen
Meekins Hills
Meeting House Heights
Meeting House Hill
Meetinghouse Court
Megeath
Meghans Place
Mehlville
Mei Condo
Melaleuca Gardens Condo
Melaleuca Gardens Resub
Melbourne Estates
Melbourne Manor
Melbourne Place
Melbourne Place Ii
Melclare
Melear
Melear | Borgata
Melford Town Center
Melia
Melody Manor
Melody Manor Estates
Melodylakescntryclub
Melrose
Melrose Gardens Amd Pl
Melrose Heights
Melrose Heights 3rd Addn
Melrose Heights 3rd Sec
Melrose Heights 4th Sec
Melrose Heights 5th Sec
Melrose Hts 4th Sec
Melrose Manor
Melrose Park
Melrose Park Sec 1
Melrose Park Sec 4
Melrose Park Sec 5
Melrose Park Sec 6 Green
Melrose Park Sec 7
Melrose Park Sec 8
Melrose Park Sect 1
Melrose Park Section 2
Melrose Park Section 3
Melrose Place South Condo
Melrose Point
Melrose Point Condo
Melrose Pud Par D
Melrose Pud Pod E
Melrose Pud Pod F
Melrose Pud Venetian Isles
Melrose Pud Verona Lakes Tr B2
Melrose Pud Verona Lakes Tr C1
Melwood Junction
Melwood Manor Plat One>
Melwood Manor Plat Two>
Melwood Springs- Plat 5
Melwood Springs- Plat 8
Melwood Springs- Plat 9
Memorial Heights
Memphord Estates
Menaggio, Lake Como
Mendenhall
Mendenhall Village
Mendoza Condo
Mene
Menga
Menores Condo
Meravan Farms
Meravita At Boca Raton
Mercer
Mercer Park
Mercersburg
Mercerville
Merchantville Border
Merco At Aventura
Meredith Ridge
Meridian
Meridian 5 Condo
Meridian Beach Condo
Meridian Condo 13
Meridian Condo 3
Meridian Condo 4
Meridian Crossing
Meridian Delray Condo
Meridian Heights
Meridian Of Palm Beach Co
Meridian Of Palm Beach Condo
Meridian Park
Meridian Park Condo
Meridian Park/Sandalwood
Meridian Plaza Condo
Meridian Valley Sq
Meridian Walk At Princeton
Merion Hill
Merion Park
Merion Park Manor 2nd Add
Merion Station
Meritage
Merklin Subdivision
Merlin Park Revised
Mermaid Run
Merrell Park
Merrick Manor Condo
Merrick Preserve
Merrick Preserve Condo
Merrick Square
Merridale
Merrifield View
Merrill Pines Comdominium
Merrimac
Merrimack Park
Merrion Centre Professional Park
Merritt Isle
Merriweather Park
Merry Go Round Farm
Merry Meadows
Merry Oaks
Merrybrook
Merrymans Mill
Merrywood On The Potomac
Merwood Park
Messina Place
Met 1
Met 1 Condo
Metes & Bound
Metes & Bounds
Metes And Bounds
Metes And Bounds Saint Lucie County
Metorail Hwy & Nwly Of Spu
Metro At Lake Eola Condo
Metro Country Club
Metro Pointe
Metro Row
Metro Square
Metro Walk At Moorefield Station
Metropark At Arrowbrook
Metropica
Metropica North Tower One
Metropolis Dadeland
Metropolis I At Dadeland
Metropolis Ii At Dadeland
Metropolis Ii At Dadeland Condo
Metropolitan At College Park
Metropolitan Condo
Metrowest
Metrowest Square
Mews At Wyckford C
Mexico
Mexico Farms
Meyerson Manor
Mezzano Condo
Mi-Place At Downingtown
Miacasa Sub
Miami
Miami Ave Sub
Miami Beach Improvement C
Miami Beach Townhomes Con
Miami Dade Unincorporated
Miami Everglade Land Comp
Miami Everglade Land Company In Sec 30
Miami Everglade Land Company Sub In Sec 17
Miami Everglade Land Company Sub In Sec 19
Miami Evglade Land Compan
Miami Gardens
Miami Gardens Estates
Miami Gardens Estates Sec
Miami Gardens Estates Sec 8
Miami Gardens Manor Sec 5
Miami Gdns Mnr Sec 2
Miami Heights
Miami Highlands Sec A
Miami Lakes - Loch Lomond
Miami Lakes Eagle Nest Se
Miami Lakes Golf Course V
Miami Lakes Lake Hilda To
Miami Lakes Lake Martha S
Miami Lakes Loch Andrews
Miami Lakes Loch Lomond E
Miami Lakes Loch Lomond East
Miami Lakes Loch Ness Sec
Miami Lakes Prof Center C
Miami Lakes Sec 2
Miami Lakes Sec 4
Miami Lakes Sec 7
Miami Lakes Sec One
Miami Lakes Windmill Gate
Miami Lakes-Lake Glenn El
Miami Land & Dev Co
Miami Land & Dev Co Sec 0
Miami Land & Dev Co Sec 3
Miami Land & Dev Cos Sub
Miami Land & Development
Miami Land And Developmen
Miami North
Miami North Pb B-41
Miami North, E11even
Miami Ocean View Co Amd
Miami Park Sec 1
Miami Park Sec 2
Miami Plat Of S2 Of Blks
Miami Shores
Miami Shores Condo
Miami Shores Estates
Miami Shores Extension
Miami Shores Heights
Miami Shores Hgts
Miami Shores Mirror Lake
Miami Shores Sec 1 Amd
Miami Shores Sec 3
Miami Shores Sec 4 Amd Pl
Miami Shores Sec 5
Miami Shores Sec 6
Miami Shores Sec 6a
Miami Shores Sec 8 Rev
Miami Springs Baptist Chu
Miami Suburban Acres
Mica At Silver Spring Metro
Mica Codm @ Silver Spring
Mica Sub 1st Addn
Michael Farms
Michaelsons Woods
Michaelton Manor
Michaux State Forest
Michelle Condo
Michelle Gardens First Ad
Michelle Jardins
Michigan Park
Michigan Park Hills
Michigan Place Condo
Michigan West Condo
Mickels 3rd Add To Wilton
Mid Beach
Mid Golf Sub
Mid Golf Sub 1st Addn
Mid Lake
Mid Mari Condo
Mid-Rivers Yacht & Cc Ph 01-02 Evergreen Club
Mid-Rivers Yacht And Coun
Mid-Rivers Yacht And Country Club (Aka Evergreen C
Mida Farms
Midblock Miami Condo
Middle Creek Ests
Middle Creek Manor
Middle Creek Preserve
Middle Creek Vistas
Middle East
Middle Paxton Twp.
Middle Ridge Estates
Middle River
Middle River Estates
Middle River Gardens 22-4
Middle River Heights
Middle River Homes Condo
Middle River Manor
Middle River Manor Add
Middle River Manor Condo
Middle River Park
Middle River Plaza
Middle River Retreat
Middle River Terrace Amd
Middle River Tower Condo
Middle River Villas Condo
Middle Ward
Middleboro Manor
Middleborough
Middlebridge
Middlebrook Commons
Middlebrook Hill
Middlebrooks Garden
Middleburg
Middleridge
Middlesex
Middlesex Twp
Middleton Farm
Middleton Plantation
Middleton Valley
Middleton Woods
Middletons Sub Of City Of Sebastian
Middletown
Middletown Borough
Middletown Crossin
Middletown Glen
Middletown Historic Disctrict
Middletown Reserve
Middletown South
Middletown South Sub
Middletown Valley
Middletown Village
Middletown Woods
Middleway
Midfield
Midlake Condos
Midland 1st Add
Midland Heights
Midland Park
Midland-Hollywood Heights
Midport Place 1
Midport Place I, A Condominium
Midsummer Hill
Midtown
Midtown Alexandria Station Condominium
Midtown At Doral
Midtown At Reston Town Center
Midtown Bethesda North
Midtown Brandywine
Midtown Condo
Midtown Doral
Midtown Doral Condo 2.
Midtown Doral Condo 4
Midtown Edmondson
Midtown Harrisburg
Midtown Historic District
Midtown Lofts Condo
Midtown Miami East
Midtown Park By Proper
Midtown Square
Midway
Midway Acres No 1 S/D
Midway Estates
Midway Forest Condo
Midway Heights
Midway Manor
Midway Mobile Village
Midway Village
Midway Village Ph 2 Condo
Midway-Homesite
Mil-Lake Estates 1
Milana Condo
Milano
Milano At Deering Bay Con
Milano Boutique Condo
Milano Condo
Milano Condominium
Milano Duomo Area
Milbrook
Milburn Terrace
Mildred Condo
Mile Apts Condo
Mile End Subdivision
Mile Run
Mile Tree Village
Miles Grant Condo
Miles Grant Condo 01
Miles Grant Condo 02
Miles Grant Country Club Apts Condo
Milesburg
Milestone
Milestone Codm
Milford
Milford Boro
Milford Gardens
Milford Mill
Milford Ponds
Milford St Prof Cm
Military Hill
Military Park Third Nichols Add
Military Trail
Military Trail Pud
Mill Bottom
Mill Branch
Mill Branch Crossing
Mill Branch Estates
Mill Condo
Mill Creek
Mill Creek Acres
Mill Creek At Cooper City
Mill Creek Estates
Mill Creek Ests
Mill Creek Falls
Mill Creek Park
Mill Creek South
Mill Creek Towne
Mill Crk/Colonial Sec Iii
Mill Estates
Mill Garden
Mill Garden Townhouses
Mill Hill
Mill Island At Worman's Mill
Mill Lake
Mill Lake Manor
Mill Landing
Mill Mountain Orchard
Mill Point
Mill Point Shores
Mill Pond (Saw Creek)
Mill Race Estates
Mill Race Farms
Mill Ridge
Mill Run
Mill Run Acres
Mill Stream
Mill Street Heights
Millbourne
Millbranch At Greenlawn
Millbridge
Millbrook
Millbrook Chase
Millbrook Manor
Millbrook Manor Mhp
Millbrook Subdivision
Millcreek
Millcreek Estates
Millcreek Ranches
Millcreek Township
Millecento
Millenia Park
Millenia Park Condominium
Millenia Park Tower Ii
Millennial Tower Dr
Millennium Condo
Millennium Tower Condomin
Millennium Tower Residenc
Millennium Tower Residence
Millennium Tower Residences Condo
Millennium Townhomes Cond
Miller
Miller & Bailes Addn To G
Miller Cove 1st Addn
Miller Cove Estates
Miller Dreams Sec 2
Miller Drive Estates
Miller Drive Ests 1st Add
Miller Estates
Miller Estates Sec
Miller Gardens Condo
Miller Grove
Miller Heights Sec 2
Miller Heights Sec 3
Miller Heights Sec 5
Miller Heights Sec 7
Miller Lake Condo
Miller Sixty-Seven Townho
Miller Sixty-Seven Townhou
Miller Villas Condo
Miller's Hill Sub
Miller's Subdivision
Millerdale
Millers Creek Park
Millers Crest
Millers Hill
Millers Island
Millersburg Borough
Millerstown
Millersville
Millersville Borough
Millgrove Gardens
Millheim
Millhouse Manor
Millicent Condo Lts 4,5 And 6 Blk 3 Twn Of Boy
Millille
Millington
Millivlle
Millmont
Millrace
Mills At Rose Valley
Mills Choice Codm
Mills Farm
Mills Manor Estates
Millside
Millside Heights
Millstone
Millstone At The Glens
Millstone Landing
Millstone Landing Pd Phase 1
Millstone Meadows
Millstone Village
Milltown
Millviile
Millvile
Millville
Millville Arts Distr
Millville By The Sea
Millville City
Millwood
Millwood Towne
Millwood Village
Milmont Park
Milon Venture
Milos Haven
Milton Heights
Milton-Montford
Milville
Mimi Sub
Mimo On The Beach Iii Con
Mimosa Addition To Mt Carmel Woods Sub
Mimosa Condo
Mindy Meadows
Mine Mtn
Mine Ridge
Mineral County
Mineral Spring Village
Mineral Springs
Mineral Springs Plantation
Mineral Springs Vill Th
Miners Village
Minersville
Mingo
Mini Assemblage Pud
Mini Assemblage Pud 1
Mini Assemblage Pud 3
Mini Assemblage Pud 6
Mini Assemblage Pud Pl 7
Mini Farms
Minnesota Park
Minnieville Manor
Minotola
Minquadale
Mint Condo
Mint Condominium
Mintbrook
Minto Plantation 1
Minto Plantation-1
Minto Plantation-2
Mira Lago Condo
Mira Mar
Mira Villas Condo
Mirabella At Mirasol A
Mirabella At Mirasol Pl C
Miracle Manor 4th Addn
Miracle Manor 5th Addn
Mirador 1000 Condo
Mirador 1035 Condo
Mirador 1200 Condo
Mirador Del Libertador
Mirador Plaza Condo
Mirage At Oasis
Mirage At Sailboat Cove
Mirage Condo
Miralago
Miralon
Miramar
Miramar Club #6 Condo
Miramar Club Condominium
Miramar Club Condominium One
Miramar Ii
Miramar Ii The
Miramar Ii, The
Miramar Isles Sec 1
Miramar Isles Sec 2
Miramar Isles Sec 3
Miramar Isles Sec 5
Miramar Landing
Miramar Ocean View Studio
Miramar Park
Miramar Park 2nd Add
Miramar Park First Add
Miramar Park Fourth Add
Miramar Park Third Add
Miramar Patio Homes
Miramar Residential Plat
Miramar Royale
Miramar Sec 10
Miramar Sec 11
Miramar Sec 12
Miramar Sec 13
Miramar Sec 14
Miramar Sec 19
Miramar Sec 2
Miramar Sec 22
Miramar Sec 3
Miramar Sec 4
Miramar Sec 4 43-16 B
Miramar Sec 5
Miramar Sec 6
Miramar Sec 7
Miramar Sec 8
Miramar Sec 9
Miramar Shores
Miramar Terrace Condo
Miramar The
Miramar Townhomes
Miramare Ocean Studio
Miramare Ocean View Studi
Mirasol
Mirasol Ocean Towers Cond
Mirasol Par 10
Mirasol Par 14
Mirasol Par 16
Mirasol Par 20
Mirasol Par 23
Mirasol Par F
Mirasol Pars H And I
Mirassou Condo
Mirelda Estates
Mirens Place
Mirror Lake
Mirror Lake Estates Sec 1
Mirror Lake Estates Sec T
Mirror Lake Farms
Mirror Lake Forest
Mirror Lakes
Mirror Lakes 1
Mirror Lakes 2
Mirros Lakes
Miry Crossing
Mirza Acres
Misco
Misik's Re-S/D Of Maravilla Park Blk 4 Lot 9
Mission Bay
Mission Bay 2
Mission Bay Par F Ph 1
Mission Hill
Mission Hills
Mission Place
Missionwood At Miramar Co
Missoni Baia
Mistwood Forrest
Misty Lake Condo
Misty Lake South Condo Ph
Misty Oaks
Misty Oaks At Palm-Aire Co
Misty Oaks At Palm-Aire Condo
Misty Pines
Mitchell Acres
Mitchell Estates
Mitchell Lake Estates
Mitchell Lakes
Mitchell Manor
Mitchell's Corner
Mitchellville
Mitchellville East
Mixco
Mizner Country Club
Mizner Court
Mizner Court Condo
Mizner Estates
Mizner Falls
Mizner Grand Condo
Mizner Grande Estates
Mizner Lake Estates
Mizner Pointe
Mizner Pointe Of Boca Via
Mizner Pointe Of Boca Via Ancho
Mizner Tower Condo
Mizner's Preserve
Mizners Preserve
Mnr Forest 1
Mnr Forest 3
Mnr Forest 4
Mnr Forest Condo I
Mobile Estates
Mobile Gardens
Mocking Bird
Mockingbird Hill
Mockingbird Trail
Model Land Co
Model Land Company
Modelo Park
Modena Park
Modern 75 At Doral
Modern Doral 45
Modern Gardens At Delray
Moffett Place Condo
Mohican Hills
Mohnton
Mohnton Lawn
Molesworth Hills
Molter Subd
Monaco Estates At Kendall
Monaco Gardens
Monad Terrace
Monaghan Twp
Monarch
Monarch Country Club
Monarch Country Club Aka Martin Downs Plat No 29
Monarch Glen
Monarch Lakes
Monarch Parcels 55 & 56 Martin Downs Plat 75 (Aka
Monarch Ridge
Monarch, Martin Downs 29a
Monarch; Martin Downs 47a
Monasterio Sub
Monceaux
Moncures Ballston
Mondamin Farms
Mondamin Place
Mondawmin
Mondrian Residences Cancun
Monet Oaks As
Mongiello Gardens 1st Add
Monika Courts Condo
Monkton
Monmouth Estates 2
Monmouth Junction
Monmouth Meadows
Monmouth Mobile Home
Monmouth Village
Monnah Park
Monocacy Landing
Monocacy Overlook
Monocacy Park South
Monroe
Monroe At Virginia Square
Monroe Heights
Monroe Heights In
Monroe Investment Co
Monroe Knolls
Monroe Lakes
Monroe Landing
Monroe Manor
Monroe Park
Monroe Place
Monroe Point
Monroe Township
Monroe Twp
Monroe Village
Mont Alto
Mont Alto Borough
Montagues Village Unit 1
Montauk Harbor
Montchanin
Montchanin Estates
Montclair
Montclair Country Estates
Montclair Gardens Condo
Montclair Phase 1
Montclair St1
Monte Alina Pozuelo De A
Monte Carlo
Monte Carlo Country Club
Monte Carlo Country Club Unit 1
Monte Carlo Country Club Unit 2
Monte Carlo Country Club Unit 3
Monte Vista Heights
Montebello
Montebello Condo
Montebello Lake
Montecarlo Condo
Montecasino
Montecito
Montecito Palm Beach Cond
Montecito Palm Beach Condo
Montecito Palm Beach Condominium
Montego Bay
Montego Bay At Boca Pointe
Montego Bay At Boca Pointe Condo
Montego Bay, St. James
Montego Club Condo
Montego Cove Condo
Montego Cove Condo All Ph
Monteith Farm
Monterey
Monterey At Malibu Bay Co
Monterey Bay Pud
Monterey Circle
Monterey Condo Three
Monterey Gardens Of Pinec
Monterey House Condo
Monterey Lake
Monterey On The Lake
Monterey One Condo
Monterey Pointe 2
Monterey Pointe 4
Monterey Two Condo
Monterey Village Two
Monterey Village-One Cond
Monterey Village-Two Cond
Monterey Villas
Monterra Plat
Monterrey
Monterrey 2nd Addn
Monterrey 4th Addn
Monterrey 5th Addn
Monterrey 6th Addn
Monterrey Condo
Montery On The Lake
Monteverde
Montez Gardens
Montgomery
Montgomery Brooke
Montgomery Chase Codm
Montgomery Crossing
Montgomery East Sec 2
Montgomery Glen
Montgomery Greene
Montgomery Hill
Montgomery Hills
Montgomery Knolls
Montgomery Meadows
Montgomery Mutual
Montgomery Mutual Coop
Montgomery Oaks
Montgomery Place
Montgomery Ridge
Montgomery Row
Montgomery Run
Montgomery Square
Montgomery Twp
Montgomery Village
Montgomery Walk
Montgomery White Oak
Montgomery Woods
Monticello Agr Pud Plat Six
Monticello Estates
Monticello Forest
Monticello Park
Monticello Park Amd
Monticello Park Amended P
Monticello Woods
Montjoy
Montour Heights
Montoya Estates Unit 1
Montoya Estates Unit 2
Montpelier
Montpelier Highlands
Montpelier Hills
Montpelier Hills- Plat 5
Montpelier Village
Montpelier West
Montpelier Woods
Montrose
Montrose Manor
Montrose Square
Montrose Village
Montross
Montura
Montura Ranch
Montura Ranch Est 1 St S/
Montura Ranch Est 1 St S/D
Montura Ranch Estate
Montura Ranch Estates
Montura Ranch Estates 1 St
Montura Ranch Estates 1 St S/D
Montura Ranch Unrec Sec 13
Montura Ranch Unrec Sec 14
Montura Ranch Unrec Sec 15
Montura Ranch Unrec Sec 24
Montura Ranch Unrec Sec 25
Montura Ranch Unrec Sec 26
Montura Ranch Unrec Sec 27
Montura Ranch Unrec Sec 3
Montura Ranch Unrec Sec 31
Montura Ranch Unrec Sec 35
Montura Ranch Unrec Sec 36
Montura Ranch Urrec Sec 36
Montura Ranche Estates
Montura Ranches
Montura Ranches Estate
Montura South
Montura South Half
Montura South Half (10080)
Montura South Half (100804
Montura South Half (100804.00)
Montura South Half 100804
Montvue
Montyville Estates
Monument Crossing
Moody Drive Homes
Moody River Estates
Moon Bay Of Miami Condo
Moon Lake Estates
Moon Ranch Estates
Moonglow Condo
Moonlit Waters Co-Op
Moonraker Condo
Moore Haven
Moore Haven River Gardens
Moore Haven Yacht Club
Moorefield Station
Moorefields Landing
Moores Landing
Moores Meadows
Moores Mill Crossing
Moores Orchard
Moorestown Greene
Moorfield
Moorings At Lantana
Moorings At Lantana Condo 2
Moorings At Lantana Condo 3
Moorings At Lantana Condominium 2
Moorings At Lantana Townhouses
Moorings Delray Beach
Moorings Of Jupiter
Moorings Of Occoquan Con
Moors Pointe Condo
Morada No 2 Condo
Morales Sub
Morans
Moreland Gardens
Moreland Manor
Morell Park
Morgan Heights
Morgan Hill
Morgan I
Morgan Ii
Morgan Park
Morgan Terrace
Morgan Village
Morgan's Crossing
Morgan's Subdivision
Morgandale Condo
Morgans Ridge
Morgans Ridge Sub
Morganshire
Morganton
Morlyn Hills
Morning Dove Estates
Morning Star Condo
Morningside
Morningside Amd
Morningside Palm Breezes Club 2b
Morningside Palm Breezes Club Phase 2a
Morningside Sub
Morningside Village
Morrell Park
Morris Hgts
Morris Hill
Morris Homesites Div 3
Morris Mill
Morris Place
Morrisdale
Morrison
Morrisville
Morton
Mortonville
Morven Park Reserve
Morwood
Mosaic
Mosaic At Merrifield
Mosaic On Miami Beach Con
Mosby Meadows
Mosby Ridge Condo
Mosby Station
Mosby Woods
Mosby Woods Garden
Mosbys Landing
Moshannon Forest Ii
Mosher
Moss & Heisler
Moss Creek
Moss Mill Holw
Moss Spring Estates
Motorcoach Resort St Lucie West
Motorcoach Resort St Lucie West Ph 3
Mount Alverno
Mount Augustine
Mount Carmel
Mount Carmel Area
Mount Carmel Borough
Mount Carmel Pa
Mount Clare
Mount Eyre Manor
Mount Friendship
Mount Harmony Farm
Mount Hebron
Mount Hebron Park
Mount High
Mount Holly
Mount Holly Gardens
Mount Holly Terrace
Mount Hope
Mount Ida
Mount Idy Tr Pk
Mount Joy Borough
Mount Joy Township
Mount Joy Twp
Mount Marie
Mount Oak Estates
Mount Penn Heights
Mount Pleasant
Mount Pleasant Est
Mount Plymouth
Mount Pocahontas
Mount Rainier
Mount Ridge
Mount Vee Manor
Mount Vernon
Mount Vernon Court
Mount Vernon Grove
Mount Vernon Lakes
Mount Vernon Park
Mount Vernon Place Historic District
Mount Vernon Triangle
Mount View
Mount Vineyard
Mount Washington
Mount Winans
Mount Zephyr
Mountain Brook Estates
Mountain Cove
Mountain Crest
Mountain Home Subdivision
Mountain Lake Park
Mountain Lick Run
Mountain Meadows
Mountain Park
Mountain Run
Mountain Shadows
Mountain Subdivision
Mountain Valley
Mountain View
Mountain View Addition
Mountain View Estates
Mountain View Mhp
Mountain View Terrace
Mountain Village
Mountaindale
Mountaineer Heights
Mountainside
Mountainview
Mountclair Villas Condo
Mounts Pud
Mountville
Mova By B&B Italia
Mower Meadows
Mowry
Mowry Drive Estates
Mowry Villas
Moyaone Reserve
Moylan
Mpme
Mr C Residences
Mr C'S Residences
Mr. C
Mr. C Residences
Mr. C Residences Bayshore
Mr. C Residences Boca Raton
Mr. C Tigertail Tower
Mrs E F Marshalls Sub Rev Plat
Mrs Elva A Truax
Mt Airy
Mt Airy (East)
Mt Airy (West)
Mt Airy Estates
Mt Airy Estates Plat 10
Mt Allen Heights
Mt Calvert Estat
Mt Carmel Sub
Mt Gap
Mt Gretna Area
Mt Holly Springs
Mt Lake Park
Mt Moriah On The Potomac
Mt Penwell
Mt Pleasant
Mt Pleasant Beach
Mt Pocahontas
Mt Rainier
Mt Rainier- Rogers 1st A
Mt Rock Manor
Mt Rose
Mt Vernon
Mt Vernon Forest
Mt Vernon Grove
Mt Vernon Lakes
Mt Vernon On The Potomac
Mt Vernon Square
Mt Vernon Valley
Mt Wolf
Mt Wolf Boro
Mt. Pocahontas
Mt. Hope Estates
Mt. Pleasant Estates
Mt. Prospect
Mt. Ringgold
Mt.Lake Park
Mudano Pl
Muhlenberg Park
Muir
Muirfield 3
Muirfield 4
Muirfield Condo
Mulberry Knoll
Mulberry Park
Mulberry Station
Mulick
Mullica Hill Farms
Mullica Twp
Mullica Woods
Multiple
Mundys Point
Municipio Sadaima
Munne Sub
Munnelly Manor
Munroe Gardens
Munson Hill
Munson's
Murano
Murano At Delray Beach Condo
Murano At Hampton Park No
Murano At Hampton Pk No 4
Murano At Hampton Pk No 4 Condo
Murano At Hampton Pk No 5
Murano At Hampton Pk No 6
Murano At Portofino Condo
Murano Bay
Murano Grande At Portofin
Murano Grande At Portofino
Murano Grande At Portofino Condo
Murdock Heights
Muriel Terrace
Murphy Henry S Prop
Murray Hill
Murray Hills Heights
Murray Manor
Murray Point
Murrays Estates
Murry Hills
Murry Hills Apt Bldg 2 Condo 104
Murry Hills Apt Bldg Condo
Muse
Muse Condo
Musket Ridge
Musselman Square
Musser Park
Mustaine's Subdivision
Mutiny Park Condo
My Brickell Condo
My Lady's Manor
Mybrickell
Mybrickell Condo
Myerlee Park Homes
Myers
Myers Estates
Myers Estates Sub
Myerstown Borough
Myersville
Myra Dells Sub
Myrtle Grove
Myrtle Grove 1st Add
Myrtle Grove 1st Addn
Myrtle Grove 2nd Addn
Mystic Condo
Mystic Harbour
Mystic Island
Mystic Island - Hickory Island
Mystic Island - Tall Timbers
Mystic Island - Tavistock
Mystic Pines At The Reserve
Mystic Place Condo
Mystic Pointe
Mystic Pointe Condo
Mystic Pointe Condo No On
Mystic Pointe Condo No One
Mystic Pointe Condo No Th
Mystic Pointe Condo No Tw
Mystic Pointe Marina Cond
Mystic Pointe Tower 100
Mystic Pointe Tower 400
Mystic Pointe Tower 400 C
Mystic Pointe Tower 400 Condo
Mystic Pointe Tower 500
Mystic Pointe Tower 500 C
Mystic Pointe Tower 600
Mystic Pointe Tower 600 C
Mystic Pointe Tower 600 Condo
Mystic Shores
Mystique
N
N /A
N Bay White House Condo 2
N Manheim Twp
N Miami Estates
N One
N/A
N/A `
N0ne
Na
Nadenbousch Pines
Naked Creek
Nancy Terrace
Nandua Bay
Nanjemoy Acres Sub
Nanlyn Farms
Nanticoke Acres
Nanticoke Acres Annex
Nanticoke Business Park
Nantucket Mews @ Crofton
Naples Manor
Naples Manor Unit 1
Naples Manors Lakes
Naples Park
Naples Park Unit 1
Napoli Gardens At Coral S
Naranja Gardens
Naranja Lakes Condo No 5
Naranja Park 2nd Addn
Naranja Pk
Naranja Terrace
Narberth Condominium
Narcissus Gardens Condo
Narcoossee
Naroca Estates Sec 1
Narrows Glen
Narrows Pointe
Nasher Plat
Nassau Acres
Nassau Grove
Nassau Heights
Nassau House Condominium
Nassau Ii
Nassau Village West Ii Co
Nassau Village West Ii Condo
Nassau Village Wynmoor Co
Nassau Village Wynmoor Condo
Natalie Estates
Natalie Estates Mobile Home Park Co-Op
Natalie Estates Ro Association, Inc.
Natalie Estates Sub
Natalie Homes
Natchez Co-Op
Nathaniel Mountain Heights
Nathans Hill
Natiio
Natiivo
Natiivo / Gale Residences
Natiivo At The Gale Hotel
Natiivo Condo
Natiivo Gale
Natiivo Gale Miami
Natiivo Miami
Natiivo Miami Condo
Natiivo | Gale Miami
Natiivo/ Gale
Natiivo/ Gale Miami
Natiivo/Gale
Natiivo/Gales Residences
National Golf And Country
National Harbor
National Park Seminary
National Research
Nativa
Nativo Condo
Nativo Condo Gale Hotel
Natoma Manors
Natoma Manors Re Sub
Natoma Park
Nattivo
Natura
Natura 2 Condo
Natura Condo No 1
Natura Condo No 2
Natura Condo No 4
Natures Hideaway Condominium
Natures Walk
Nauck
Nautica
Nautica 1
Nautica 2
Nautica Condo
Nautica Isles 2
Nautica Isles 3
Nautica Isles West 1
Nautica Isles West 2
Nautica Isles West 3
Nautica Lakes Pud 1
Nautica Lakes Pud Pl 2
Nautica Plat
Nautica Sound 02
Nautica Sound 1
Nautica Sound 2
Nautical Towers Condo
Nautilus
Nautilus 220
Nautilus 220 Condo
Nautilus 220 Condominium
Nautilus Addn
Nautilus Extension 2nd
Nautilus Extension 4th
Nautilus Sub
Naval Square
Navarre
Navarro Isle
Navarro Sub
Navy Yard
Nazareth Area
Ne Miami
Neabsco
Neabsco Commons
Neabsco Landing
Near Clifton
Near Deering Bay
Near Falls Church
Near Judith Sound
Near Park Airbnb
Near Potomac River
Near Raystown Lake
Neavitt
Neck District
Needleworks Lofts
Neeld Estate
Neffsville
Negro Mountain
Neigbor To Seven Pines Island
Neighbor To Seven Pines Island
Neighborhood
Neighbors Of Creekview Court
Neilland Park
Nells Acres
Nelson
Nelson Homesites
Nelson Industrial Sites S
Nelsons
Neo Condo
Neo Condo Neo Loft
Neo Vertika Condo
Neovita
Neptune City
Neptune Development
Neptune Villas Co-Op
Nesbitt Station
Nesco Village
Neshaminy
Neshaminy Falls
Neshaminy Valley
Neshaminy Woods
Neshanic Station
Nesquehoning
Nether Providence
Nethergate
Nettle Gardens Condo
Neverlett
Nevins Mill
Nevis Condo
New Alamo Sub
New Alexandria
New Baltimore Knolls
New Belle Meade Sub
New Bridgeville
New Britain
New Britain Estates
New Brittany Ii
New Browardale
New Carrollton
New Castle
New Chestnut Terra
New Colony Village
New Covenant Church Plat
New Cumberland Borough
New Daleville
New Egypt
New England Estates
New Freedom Boro
New Freedom Villg
New Gretna
New Hampton
New Hampton At Century Iv
New Hampton At Century Vi
New Hampton At Century Village
New Hanover
New Haven
New Haven Sub
New Holland Borough
New Hope
New Hope Hills
New Liberia
New Liberty City
New Little River Ac Pl
New Market
New Market West
New Melbourne Beach
New Miami Shores Estates
New Minersville
New Monrovia
New Monrovia Rev
New Northwood
New Orchard Estates
New Oxford
New Oxford Area
New Oxford Borough
New Paseos Castellanos Co
New Philadelphia
New Pittsburg
New Post On The Rappahannock
New Providence Village
New River Estates
New River Estates Sec 2
New River Estates Sec 6
New River Estates Section
New River Estates Section Three
New Shenandoah
New Silver Crest
New Silvercrest Rev
New So Miami Heights Sec
New Southwest
New St Augustine
New Town
New Town Meadows
New Wave Condo
New World Condo Apts Ii
New World Condo Apts Iii
New World Condo Apts Iv
New Worrld Condo Apts Iii
New York Condo
Newark
Newark Preserve
Newberry
Newberry Court
Newberry Estates
Newberry Estates Mhp
Newberry Twp
Newbold
Newbridge
Newbury Farms
Newcastle At Century Vill
Newcastle At Century Village Condo
Newdale Acres
Newells Creek
Newer Subdivision
Newer Subdivisions
Newfield
Newfield Crossroads
Newfield Crossroads Ph 1a-3
Newfield Crossroads Phase 1a-3
Newfield Crossroads Phase 2a-1
Newfound Harbor
Newgate
Newhaven 07b Ph 01 At Abacoa
Newhaven 7a
Newhaven 7b Ph 1
Newhaven 7b Ph 2
Newington Commons
Newington Forest
Newington Heights
Newington Station
Newlin Greene
Newmans Survey
Newmans Survey No 1 & 2
Newmans Survey Sub No 1 &
Newmans Survey Sub No 1 & 2
Newmanstown
Newport
Newport 2nd Rev
Newport A Condo
Newport At Lauderhill
Newport At Lauderhill Con
Newport At Lauderhill Condo
Newport Bay Club
Newport Condo
Newport Cove
Newport E Condo
Newport Estates
Newport G Condo
Newport H Condo
Newport Heights
Newport Hills
Newport I Condo
Newport J Condo
Newport Jensen (Aka Indian River Point)
Newport Jensen Rev
Newport K Condo
Newport N Condo
Newport News
Newport Q Condo
Newport R Condo
Newport Ridge
Newport S Condo
Newport Square
Newport Towne
Newport U Condo
Newport U Condo /Century Village
Newport/Downe Twp
Newportville
Newth Gardens C Condo
Newton Creek
Newton Heights
Newton Lake
Newton Manor
Newton Road Subdivision
Newtonville
Newtown Commons
Newtown Crossing
Newtown Estates
Newtown Gate
Newtown Grant
Newtown Hgts
Newtown Historic Distric
Newtown South Side Add To
Newtown Sq
Newtown Station
Newtown Walk At Ellis Preserve
Newtowne
Newtowne Square
Newville
Nexo
Nexo Residence
Nexo Residences
Nicetown
Nicetown-Tioga
Nicholas Manor
Nicholas Park
Nichols 1st Add To Delray
Nichols 2nd Add To Delray
Nichols Estate
Nichols Golf Estates
Nichols Heights
Nichols Heights Addn
Nicholson Square Village
Nile Gardens Sec 2
Nine At Mary Brickell Vil
Nine At Mary Brickell Vill
Nine At Mary Brickell Village Condo
Nine Island Avenue Condo
Nine Mary Brickell
Nine Mile Hill
Nine Mile Run
Ninth Green At Crystal La
Ninth Ward
Nirvana Condo No Five Con
Nirvana Condo No Four Con
Nirvana Condo No One Cond
Nirvana Condo No Three Co
Nirvana Condo No Three Condo
Nirvana Condo No Two Cond
Nissley Run
Nistals Map Subdivision Of
Nithsdale
Nittany Glen
Nittany Grove
Nittany Residence Club
Nittany View Meadow
Nixon Park
Njmp
No
No 1 Palm-Aire At Coral K
No 1 Palm-Aire Country Club
No 1 Palm-Aire Village Co
No 1 Palm-Aire Village Condo
No 10 Palm-Aire Country C
No 10 Palm-Aire Country Club
No 100 Palm-Aire Country
No 102 Palm-Aire Country Club
No 103 Palm-Aire Country Club
No 105 Palm-Aire Country
No 11 Palm-Aire Country C
No 11 Palm-Aire Country Club
No 112 Palm-Aire Country Club
No 113 Palm-Aire Country Club
No 114 Palm-Aire Country
No 115 Palm-Aire Country Club
No 116 Palm-Aire Country Club
No 117 Palm-Aire Country
No 122 Palm-Aire Country Club
No 123 Palm-Aire Country Club
No 124 Palm-Aire Country Club
No 125 Palm-Aire Country Club
No 129 Palm-Aire Country Club
No 13 Palm-Aire Country C
No 13 Palm-Aire Country Club
No 14
No 14 Palm-Aire Country Club
No 15 Palm-Aire Country Club
No 16 Palm-Aire Country C
No 16 Palm-Aire Country Club
No 17 Palm-Aire Country Club
No 18 Palm-Aire Country C
No 18 Palm-Aire Country Club
No 19 Palm-Aire Country C
No 2 Palm-Aire At Coral Key
No 2 Palm-Aire Country Club
No 2 Palm-Aire Village Condo
No 20 Palm-Aire Country C
No 20 Palm-Aire Country Club
No 21 Palm-Aire Country Club
No 22 Palm-Aire Country C
No 22 Palm-Aire Country Club
No 23 Palm-Aire Country Club
No 27 Palm-Aire Country C
No 27 Palm-Aire Country Club
No 3 Palm-Aire At Coral Key
No 3 Palm-Aire Country Cl
No 3 Palm-Aire Country Club
No 30 Palm-Aire Country Club
No 31 Palm-Aire Country Club
No 34 Palm-Aire Country C
No 34 Palm-Aire Country Club
No 35 Palm-Aire Country Club
No 38 Palm-Aire Country C
No 38 Palm-Aire Country Club
No 39 Palm-Aire Country C
No 39 Palm-Aire Country Club
No 4 Palm-Aire Country Cl
No 4 Palm-Aire Country Club
No 40 Palm-Aire Country C
No 40 Palm-Aire Country Club
No 41 Palm-Aire Country Club
No 42 Palm-Aire Country Club
No 49 Palm-Aire Country Club
No 5 Palm-Aire At Coral Key
No 5 Palm-Aire Country Cl
No 5 Palm-Aire Country Club
No 50 Palm-Aire Country C
No 51 Palm-Aire Country C
No 51 Palm-Aire Country Club
No 52 Palm-Aire Country Club
No 53 Palm-Aire Country Club
No 6 Palm-Aire Country Cl
No 6 Palm-Aire Country Club
No 60 Palm-Aire Country C
No 60 Palm-Aire Country Club
No 61 Palm-Aire Country Club
No 66 Palm-Aire Country C
No 68 Palm-Aire Country Club
No 7 Palm-Aire Country Club
No 70 Palm-Aire Country C
No 70 Palm-Aire Country Club
No 71 Palm-Aire Country Club
No 74 Palm-Aire Country Club
No 76 Palm-Aire Country Club
No 77 Palm-Aire Country Club
No 78 Palm-Aire Country Club
No 78a Palm-Aire Country Club
No 79 Palm-Aire Country C
No 79 Palm-Aire Country Club
No 8 Palm-Aire Country Cl
No 8 Palm-Aire Country Club
No 80 Palm-Aire Country Club
No 81 Palm-Aire Country C
No 83 Palm-Aire Country Club
No 86 Palm-Aire Country C
No 88 Palm-Aire Country C
No 9 Palm-Aire Country Cl
No 9 Palm-Aire Country Club
No 90 Palm-Aire Country C
No 91 Palm-Aire Country Club
No 93 Palm-Aire Country Club
No 94 Palm-Aire Country C
No 94 Palm-Aire Country Club
No 95 Palm-Aire Country Club
No 97 Palm-Aire Country C
No 97 Palm-Aire Country Club
No 99 Palm-Aire Country C
No Bay White House No 1 C
No Bay White House No 3 C
No Bay White House No 4 C
No Developement
No Miami Beach Manor
No Miami Est Sec 3
No Miami Estates Sec 3
No Name
No Named Subdivision
No Plat Book
No Shore Crest
No Silver Crest Manors
No Sub Division
No Subdi
No Subdiv/Park Info
No Subdivi
No Subdivision
No Subdivision.
No Va Drs Medical Cnt
No. Brunswick
Noah's Landing
Noahs Landing
Nob Hill
Nob Hill At Welleby Condo
Nob Hill Estates 2 Sec
Nob Hill Landings Condomi
Nob Hill West Condo
Nobe Parc
Nobel Point Condo
Noble
Nobles Pond
Nobu Residences
Nokesville
Noll Manor
Noma
Nomad Residences
Nomad Residences Wynwood
Nomad Wynwood
Nomad Wynwood Condominium
Nomad Wynwood Residences
Nomar Estates
Nome
Nomini
Nomini Bay Farms
Nomini Cliffs
Non
Non Ag Subdivision
Non Applicable
Non Avail
Non Available
Non Avaliable
Non Development
Non Listing
Non Sub Division
Non/Other
Nona Available
Nonantum Mills
Nonavailable
Nondev
Nondevelope
None Available
None No Hoa
None , Unrecorded Plat
None Av Ailble
None Ava Ilable
None Avaialble
None Avaible
None Avail
None Availabel
None Available
None Available.
None Availalbe
None Availale
None Avalable
None Avaliable
None Avialible
None Avilable
None Dev
None Other
None Selected
None Unrestricted
None, N/A
None, Rural
None-Unrestricted
None]
None````````````````````
Nonw
Noon Avilable
Nope
Nora Jardins
Norbeck Crossing
Norbeck Estates
Norbeck Knolls
Norbeck Manor
Norborne Glebe
Norboro Mhp
Norbourne Park
Nordau
Nordica Condo
Norfolk Place
Norh Wildwood
Norhurst
Norma Park
Norman
Normandie On The Lake I
Normandie On The Lake Ii
Normandy
Normandy Beach 2nd Amd &
Normandy Beach 2nd Amd Pl
Normandy Beach 2nd Amende
Normandy Beach South
Normandy Golf Course
Normandy Islands
Normandy Park
Normandy Place Condo
Normandy Sh Yacht & Co Cl
Normandy Village
Normandy Waterway Sub
Normansmeade
Norris Hills Ct
Norris Square
Norris Woods
Norristown
Norriton East
Norriton West
Norriton Woods
Norrsken Estate
Norshore
North Wildwood
North 29 Assoc
North Accokeek
North Andrews Gardens
North Andrews Gardens 2nd
North Andrews Gardens 2nd Add
North Andrews Gardens Ann
North Andrews Gardens Fir
North Andrews Gardens First Add
North Andrews Terrace
North Andrews Terrace Fir
North Andrews Terrace Sec
North Andrews Terrace Second Add
North Anna Estates
North Arlington
North Avondale
North Bal Harbour
North Barcroft
North Barnaby
North Barnaby- Addn
North Bates Subdivision
North Bay Colony Condo
North Bay Island
North Bay Villas Condo
North Beach
North Beach Condo
North Beach Estates
North Beach Haven
North Beach Park
North Beaver Street
North Bend
North Bethesda
North Bethesda Grove
North Biscayne Beach Amen
North Brentwood
North Brook
North Brook Ph 1
North Camp
North Camp Subdivision
North Cape May
North Carillon Beach Cond
North Carillon Beach Condo
North Central
North Chase
North Chesapeake Beach
North Clearview Heights
North Cleveland Park
North Codorus
North Codorus Twp
North Cornwall
North Cornwall Township
North County Pud 1
North County Pud 2
North Creek
North Creek Farms Plat 1
North Creek Place Codm
North Creek Villas
North Crk Place
North Crossing
North Crosswicks
North Cumberland
North Dania Heights
North Deale
North Diamond Park
North Dorchester
North Dover
North Dover - Homestead Run Mhp
North Dover - Roberts Mhp
North East
North East Isles
North East Lancaster
North End
North End Virginia Beach
North Fairmont Heights
North Forestville
North Fork
North Fork Estates Subdivision
North Fork Retreat
North Fort Myers
North Garden Condo Of Dee
North Garden Condo Of Deerfield
North Garfield
North Gate
North Gate Hall
North Gate Towne Homes
North Green Condominiums
North Guilford Hills
North Hampton Court Condo
North Harford
North Harford Road
North Hart Run
North Highlandtown
North Hill
North Hill Estates
North Hillcrest
North Hills
North Hills Of Allen
North Hobe Sound Shores
North Hollywood
North Hollywood 4-1 B
North Hopewell Twp
North Indian Head Estates
North Isle Of Normandy
North Kendall
North Kensington
North Labelle
North Lake Country Estate
North Lake Country Estates
North Lake Estates
North Lake Townhomes Cond
North Lake Worth
North Lake Worth In Pb 5 Pgs 48 & 49
North Lakeside Condo
North Lakewood Park 1st Add
North Lauderdale
North Lauderdale Amd 1-18
North Lauderdale Amended Plat
North Lauderdale Div B
North Lauderdale Division
North Lauderdale Estates
North Lauderdale Landings
North Lauderdale Village
North Lauderdale Village Sec 1
North Lauderdale Village Sec 1 74-22 B Lot 33 Blk
North Lauderdale Village Sec 4
North Lauderdale Village Sec 6
North Laurel Park
North Lebanon Township
North Lebanon/Sandhill
North Leisure Gardens Con
North Leisure Gardens Condo
North Liberty City
North Liberty City Amd
North Linthicum
North Londonderry Twp
North Manheim Twp
North Marathon Shores Pla
North Marathon Shores Plat C
North Margate
North Margate 1st Add
North Miami
North Miami Estates
North Michigan Park
North Middleton Twp
North Mountain Estates
North Mountain-Rimrock
North Newton Hills
North Newton Twp
North Oaks
North Of Lake Henry Area
North Palm Bch 1
North Palm Bch 2
North Palm Bch 3
North Palm Bch 4
North Palm Beach
North Palm Beach Heights
North Palm Beach Heights Sec 3
North Palm Beach Heights Unrec
North Palm Beach Pl 1
North Palm Beach Pl No 1 Blks 8-12 Repl
North Palm Beach Village
North Palm Beach Village Of 1
North Palm Beach Village Of 2
North Palm Beach Village Of 3
North Palm Beach Village Of 4
North Palm Beach Village Of 6
North Park
North Passage
North Patterson Park
North Penn Crossin
North Point
North Point Ph 2b-2c
North Point Terrace
North Point Village
North Point Villas
North Pointe
North Pointe Commons
North Pointe Townhouses
North Pompano Beach Sec
North Pompano Beach Secti
North Port
North Port Charlotte Estates
North Port Portfolio
North Portal Estates
North Potomac
North Potomac View
North Potomac Vista
North Reedy Shore Sub
North Rehoboth
North Ridge
North Ridge 1st Addn
North Ridge Estates
North Riding
North River Highlands
North River Run
North River Shores
North River Shores Sec 04
North River Shores Sec 05a 06 & Rep
North Rivers Shores
North Riverview Condo
North Roblee Acres
North Rockmoor Track
North Roland Park
North Sherman Street
North Sherwood Forest
North Shippen Place
North Shore
North Shore Court
North Shore Heights
North Shore Landing
North Shore Terrace 1
North Shore Terrace 3
North Shores
North Springbrook
North Springfield
North Springfield Heights
North Stafford
North Star Chase
North Tampa Land Co's Sub
North Tower At The Point
North Vineland
North Virginia Beach
North Ward
North Washington St Cond
North Wellham
North West Lauderdale
North West Lauderdale Add
North West Lauderdale Add Amd
North Whitehall
North Wildwood
North Wildwood City
North Wilmington
North Winds
North Woodbury
North Woodside
North York
North York Boro
Northampton
Northampton A Thru S Condos
Northampton Chase
Northampton Condos
Northampton Crossg
Northampton Place
Northampton Plat One-Res
Northbank
Northbrook
Northbrook Estates
Northcrest Acres
Northeast Heights Condo Phase I
Northeast Inlet
Northeast Palms Condo
Northeast Reading
Northend
Northern Blvd Tr
Northern Blvd Track
Northern End
Northern Estates
Northern Heights
Northern Liberties
Northern Pines Mobile Hom
Northern Pines Mobile Home Park 1
Northern Pines Mobile Home Park 3
Northern Pines Mobile Home Park 4
Northern Pines Mobile Home Park 6
Northern Star Condo
Northern View
Northfield
Northfield City
Northgate
Northgate At Alden Place
Northgate At Bailey
Northgate Condo
Northgate Square
Northgate Townhouse Condo
Northglade Hills
Northlake
Northlake Village
Northlake Villas Condo
Northlake Vlg At Calif Cl
Northlake Vlg At Calif Club Condo
Northmont
Northmoor Gardens
Northmoor Gardens Add B G In
Northmore Add
Northpointe At The Calif
Northpointe I
Northpointe Ii
Northport Condo
Northport Condo Apts
Northport Village
Northridge
Northridge Estates
Northridge Manor
Northridge Plat 22
Northridge Plat 25
Northridge Station
Northshire
Northside
Northside Heights
Northstar Plat
Northtree
Northview
Northview At Belair Village
Northview At Lake Village
Northview Manor
Northwest 45 Street Club
Northwest 45 Street Club Condo
Northwest Community Action
Northwest Dover Hg
Northwest Highlands
Northwest Reading
Northwest York
Northwestern Hills
Northwind
Northwood
Northwood Add
Northwood Hills
Northwood Ii
Northwood Manor
Northwood Park View
Northwood Sub
Northwood Subdivision
Northwood Village
Northwoods
Northwoods Crossing
Norton Park Place Condo
Norwayne
Norways
Norwegian Woods
Norwich Condo
Norwich Condo A-O
Norwood
Norwood 1st Addn
Norwood 2nd Addn
Norwood 3 Addn Sec 1
Norwood 3rd Addn Sec 2
Norwood 5th Addn Sec 1
Norwood 5th Addn Sec 2
Norwood 5th Addn Sec 3
Norwood Estates
Norwood Heights
Norwood North
Norwood Park
Norwood Section
Norwood Village
Not A Subdivision
Not Applicable
Not At All
Not Available
Not In Development
Not In A Development
Not In A Subdivision
Not In Develeopment
Not In Develop
Not In Developement
Not In Development
Not In List
Not In Sub
Not In Subdivision
Not In Subdivison
Not In Use
Not Listed
Not On List
Notre Dame Hills
Notting Hill Chase
Nottingham
Nottingham Green
Nottingham Manor
Nottingham Meadows
Nottingham Vil
Nottingham Village
Nottingham Woods
Nottinghamshire Farms
Nottoway
Nova Enterprises Ii
Nova Gardens Condo
Nova Hills Condominium 2
Nova Hills Condominium 6
Nova Hills North Condo
Nova North Condominium 1
Nova Townhouses Condomini
Nova Townhouses Condominium 4
Nova Village
Nova Villas Condominium 3
Nova Villas Condominium 6
Novum
Nu River Landing
Nugentown
Nuriver Landing
Nuriver Landing Comm Cond
Nuriver Landing Condo
Nurmi Isles Island No 1
Nurmi Isles Island No 2
Nurmi Isles Island No 3
Nurmi Isles Island No 4
Nurmi Isles Island No.3
Nutmeg Estates
Nutters Crossing
Nw
Nw 20th St Heights
Nyland
Nyurka Estates
O'Donnell Heights
O'Donnell Square
O-Z Plat
Oak Acres
Oak Breeze
Oak Chase Phase Iii Subdivision
Oak Chase Subdivision Phase Ii
Oak Court
Oak Court Condo
Oak Creek
Oak Creek At Oak Woodlands
Oak Creek Club
Oak Creek Club Golf Course
Oak Creek North Replat
Oak Creek South
Oak Creek Towns
Oak Crest
Oak Ests
Oak Flat Estates
Oak Forest
Oak Forest Subdivision
Oak Grove
Oak Grove At The Beach
Oak Grove Estates
Oak Grove Farm
Oak Grove Terrace
Oak Hall
Oak Hammock
Oak Hammock Townhomes Sub
Oak Harbour
Oak Harbour 3
Oak Harbour 4
Oak Harbour Condos
Oak Harbour Marina
Oak Haven
Oak Haven Farm
Oak Haven Sec 2
Oak Haven Sub Sec 3
Oak Heights
Oak Hill
Oak Hill Addition To Brksvl
Oak Hill Estates
Oak Hills
Oak Hills Condo No V
Oak Hollow
Oak Hollow Phase 4
Oak Hurst
Oak Island Sub
Oak Knoll
Oak Knoll Estates
Oak Lane
Oak Lane Manor
Oak Lane Sec Addition
Oak Leaf Villas
Oak Manor Townhouse
Oak Manor Twn Hse Condo
Oak Meadows
Oak Mill
Oak Mnr
Oak Orchard
Oak Orchard West
Oak Park Estates Sec 1
Oak Park Estates Sec 2
Oak Park I Condo
Oak Park Sec 5
Oak Park Sec 6
Oak Park Sec 7
Oak Park Sub
Oak Park Subdivision
Oak Park Terrace Units 1-16
Oak Paths Condo
Oak Pines
Oak Point
Oak Pond
Oak Pond Plat Fivephase
Oak Ranch Manor
Oak Ridge
Oak Ridge Amen Plat
Oak Ridge Commons
Oak Ridge Estates
Oak Ridge Park
Oak Ridge Villas Sub
Oak Ridge Villas Sub Sec
Oak Shadows
Oak South Estates
Oak Springs
Oak Terrace
Oak Terrace Condo
Oak Trace Villas Ph 01
Oak Tree
Oak Tree Farms
Oak Tree Landing
Oak Tree Prop Redev
Oak Tree Property Redevel
Oak Tree Property Redevelopment
Oak Valley
Oak View
Oak Village Condos
Oak Wood
Oakbrook
Oakbrook Village
Oakbrook I Condo
Oakbrook Ii Condo
Oakbrook Iii Condo
Oakbrook Iv V Vi Vii Cond
Oakbrook Iv V Vi Vii Condo
Oakbrook Viii Condo
Oakbrook Village
Oakcrest
Oakcrest Estates
Oakdale
Oakdale Crossing
Oakdale Townhomes Ii
Oakdale Village
Oakenshaw
Oakenshawe
Oakenshawe Historic District
Oakfield
Oakford
Oakhampton
Oakhurst
Oakhurst Ii
Oakland
Oakland Acres
Oakland Arms Condo
Oakland East Manors Condo
Oakland Estates 1st Sec
Oakland Estates 2nd Sec
Oakland Estates 4th Sec
Oakland Estates 5th Sec
Oakland Estates 7th Secti
Oakland Estates 7th Section
Oakland Estates North 1st
Oakland Estates Sec Eight
Oakland Forest Club
Oakland Forest Club Condo
Oakland Grove
Oakland Grove Village
Oakland Grove Village Condo
Oakland Hall
Oakland Hills
Oakland Hills 2 Sec
Oakland Hills 4th Sec
Oakland Hills 5 Sec
Oakland Hills 6 Sec
Oakland Lake Estates
Oakland Lakes
Oakland Mills
Oakland Ocean Mile
Oakland Overlook
Oakland Park
Oakland Park 2-38 B
Oakland Park 2nd Add-Resu
Oakland Park 2nd Add-Resub
Oakland Park Second Add
Oakland Park Second Add 1
Oakland Park Second Add 1-
Oakland Sawgrass Expressw
Oakland Shores
Oakland Shores Condominiu
Oakland Shores Condominium 1
Oakland Subdivision
Oakland Terrace
Oakland-Sang Run
Oakland-Sawgrass Expressw
Oaklands
Oaklane 1st Add 80-7 B
Oaklawn
Oaklawn Sub
Oakleaf Meadows
Oaklee
Oakleigh
Oakleigh Beach
Oakleigh Forest
Oakleigh Manor
Oakley Farms
Oakley Place
Oaklyn Manor
Oakmill
Oakmont
Oakmont Estates
Oakmont Manor
Oakmont Village
Oakridge
Oakridge A Condo
Oakridge B Condo
Oakridge C Condo
Oakridge D Condo
Oakridge E Condo
Oakridge Estates Phase 06
Oakridge Estates Phase 07
Oakridge Estates Rev
Oakridge Estates Sec 2
Oakridge Estates Sec 3
Oakridge J Condo
Oakridge L Condo
Oakridge N Condo
Oakridge N/Century Villge
Oakridge Pines
Oakridge Pointe
Oakridge Q Condo
Oakridge R Condo
Oakridge T Condo
Oakridge T Condo T
Oakridge U Condo
Oakridge V Condo
Oaks
Oaks At Boca Raton
Oaks At Boca Raton 3
Oaks At Boca Raton 5
Oaks At Boca Raton 8
Oaks At Lafayette Hill
Oaks Condo
Oaks East 2
Oaks East Pl 3
Oaks Of Shenandoah
Oaks Of Weymouth
Oaks Place
Oaks Place 183-488 B
Oaks The
Oaks-Sun Terrace
Oaks-Sunterrace 1
Oaks-Sunterrace 4
Oakton
Oakton Grove
Oakton Preserve
Oakton Prof Center
Oakton Retreat
Oaktree Estates
Oakview
Oakview (Salem Fields)
Oakview Condo #4
Oakview Condo No 1
Oakview Condo No 2
Oakview Condo No 3
Oakview Village
Oakwood
Oakwood Commons At Burke
Oakwood Dev
Oakwood Drive
Oakwood Estates
Oakwood Forest
Oakwood Grove
Oakwood Heights Mhp
Oakwood Hills
Oakwood Hills 120-45 B
Oakwood Hills Unit Iii
Oakwood Ii
Oakwood Knolls
Oakwood Manor
Oakwood On The Green Cond
Oakwood On The Green Condo
Oakwood Park
Oakwood Village
Oakwood Village Condo
Oasis
Oasis Condominium
Oasis En Mango Hill Condo
Oasis Falls Condo
Oasis Hallandale
Oasis Hallandale West
Oasis Hallandale West Towe
Oasis Hallandale West Tower
Oasis Hallandale West Twr
Oasis Hallandale Westtower
Oasis On The Beach Condo
Oasis Park Square At Dora
Oasis Park Square At Doral
Oasis Singer Island Condo
Oasis Surfside Condo
Oasis Townhouse
Oasis Village
Oasis West Hallandale
Oasis-Nurmi Isle Co-Op
Oatland Farm
Obccc1 Sun N Lakes Estates
Oberlin
Obm4 Orange Blossom Manor
Observatory Circle
Observatory Heights
Ocala
Ocala Estates
Ocala National Forest Camp
Ocala Park Estate
Ocala Preserve Golf Course
Ocala Preserve Ph 9
Ocala Preserve Phase 5
Ocala Ridge
Ocala Solar Farms
Ocala Waterway Estates
Ocala Waterway Estates Unrec
Occoquan Forest
Occoquan Oaks
Occoquan Overlook
Occoquan Pointe Condo
Occoquan Ridge
Occoquan Ridge Condo
Occoquan Walk
Ocea Pines
Ocean 36 South Condo
Ocean 580
Ocean 88
Ocean 91 Condo
Ocean Acres
Ocean Acres - The Oaks
Ocean At The Bluffs
Ocean At The Bluffs South
Ocean Ave Heights
Ocean Bay Club
Ocean Bay Luxury Beach
Ocean Bay Villas A Condo
Ocean Bay Villas, A Condominium
Ocean Beach Add No 3
Ocean Beach Addn No 2
Ocean Beach Addn No 3
Ocean Beach Addn No 3 Pb 2
Ocean Beach Fla Sub
Ocean Blue, R
Ocean Blvd Estates Sec A
Ocean Boulevard Park
Ocean Breeze
Ocean Breeze Gardens Resu
Ocean Breeze Resort
Ocean Breeze Townhomes
Ocean Breeze Townhomes At Juno Beach
Ocean Breeze West
Ocean Breeze West A Pud
Ocean Cay
Ocean Chateau Of Vero Beach
Ocean City
Ocean City Bay Area
Ocean City Boardwalk
Ocean City Cental
Ocean City Central
Ocean City Gardens
Ocean City Harbor
Ocean City Lofts
Ocean City Lofts Condo
Ocean City Northend
Ocean City Southend
Ocean City/Central
Ocean Club
Ocean Club 2
Ocean Club 3
Ocean Club Condo
Ocean Club Jupiter Condo
Ocean Club Resort
Ocean Colony Condo
Ocean Cove
Ocean Drive Estates
Ocean Drive Estates Condo
Ocean Dunes Condo
Ocean Dunes Condominium
Ocean East Apts Co-Op
Ocean Eighteen Condo
Ocean Farms
Ocean Five Condo
Ocean Four Condo
Ocean Four Condominium
Ocean Garden Condo
Ocean Gate
Ocean Grande
Ocean Grande Beach & Mari
Ocean Grande Beach & Marina
Ocean Grande Beach Club C
Ocean Grande Place
Ocean Harbor Condo
Ocean Harbour
Ocean Harbour Condo A
Ocean Harbour Condominium
Ocean Harbour Condominium A
Ocean Harbour Condominium B
Ocean Harbour Condominium C
Ocean Harbour Condominium D
Ocean Harbour North
Ocean Harbour South
Ocean Harbour South Condominium
Ocean Harbour Tower Condominium E
Ocean Harbour Villas Condominium
Ocean Heritage Club Condo
Ocean Hills
Ocean Hillsboro Condo
Ocean House
Ocean House At Irp Condo
Ocean House Two Condo
Ocean Isle Estate
Ocean Isles Fishing Villa
Ocean Jewels Club Condo
Ocean Lane Plaza Condo
Ocean Lane Villas Co-Op
Ocean Maisonettes Inc
Ocean Manor Condo
Ocean Marine Yacht Club
Ocean Marine Yacht Club C
Ocean Marine Yacht Club Condo
Ocean Mist (3)
Ocean Monarch
Ocean Monarch Condo
Ocean Monarch Condo Inc
Ocean One
Ocean One Condo
Ocean Palms
Ocean Palms Condo
Ocean Paradise
Ocean Park
Ocean Park Condo
Ocean Park Condominium In
Ocean Park H W Robbins
Ocean Park H W Robbins Add In
Ocean Park Manor Condo
Ocean Park Of Vero Beach Condo
Ocean Park Village
Ocean Parks Condo
Ocean Pearl Subdivision
Ocean Pearl, A Condominium
Ocean Pines
Ocean Pines - Bay Colony
Ocean Pines - Bramblewood
Ocean Pines - Colonial Village
Ocean Pines - Huntington
Ocean Pines - Innerlinks
Ocean Pines - Marina Village
Ocean Pines - Mumford's Woods
Ocean Pines - Nantucket
Ocean Pines - Newport
Ocean Pines - Pinehurst
Ocean Pines - Pintail Isle
Ocean Pines - Seabright
Ocean Pines - Sherwood Forest
Ocean Pines - Somerset
Ocean Pines - Tanglewood
Ocean Pines - Teal Bay
Ocean Pines - Terns Landing
Ocean Pines - The Parke
Ocean Pines - The Point
Ocean Pines - Wood Duck Ii
Ocean Pines - Wood Duck Isle I
Ocean Pines Condo
Ocean Pines Lane
Ocean Place Condo
Ocean Place-2155 Condo
Ocean Plaza On Deerfield
Ocean Point Beach Club Co
Ocean Point Beach Club Condo
Ocean Point Condo
Ocean Point I Condominium
Ocean Reef Shores
Ocean Reef Towers
Ocean Reef Towers Inc Condo
Ocean Reserve Condo
Ocean Resort Residences
Ocean Resorts Cooperative
Ocean Ridge
Ocean Ridge Beach
Ocean Riviera
Ocean Royale Condo
Ocean Seven Condo
Ocean Shore Co-Op Apts In
Ocean Shore Estates
Ocean Side Sec-Isle Of No
Ocean Summit
Ocean Summit Condo
Ocean Sunrise Co-Op
Ocean Terrace
Ocean Terrace Co-Op Apts
Ocean Terrace Condo
Ocean Terrace North
Ocean Terrace North Condo
Ocean Three
Ocean Three Condo
Ocean Tower One Condo
Ocean Tower Two Condo
Ocean Towers
Ocean Towers A
Ocean Towers Condo
Ocean Towers Condo A
Ocean Towers Condo Apts
Ocean Towers Condominium
Ocean Towers Condominium A
Ocean Towers Condominium B
Ocean Towers Condominium, Inc.
Ocean Towers North Condo
Ocean Towers South Cond Decl Filed 1-8-80
Ocean Towers South Condo
Ocean Trace Condo
Ocean Trail
Ocean Trail Condo
Ocean Trail Condo I
Ocean Trail Condo Ii
Ocean Trail Condo Iii
Ocean Trail Condo Iv
Ocean Trail Condo V
Ocean Two Condo
Ocean View
Ocean View Beach Club
Ocean View Condo
Ocean View East
Ocean View Golf Add
Ocean View Heights
Ocean View Plaza
Ocean View Plaza Condo
Ocean View S/D Re Plat Holley & Morgan
Ocean View Sub Rep Holley & Morgan
Ocean View Subdivision Replat Holley & Morgan
Ocean View Towers
Ocean View Towers Condo
Ocean View Villa
Ocean Village
Ocean Village (Ocean Villas I)
Ocean Village Catamaran Ii
Ocean Village Condo
Ocean Village Golf Villas
Ocean Village Iii
Ocean Village Old Bridge
Ocean Villas Condo
Ocean Villas Condo Apts
Ocean Villas I Condominium
Ocean Villas Iii Condomin
Ocean Villas Iii Condominium
Ocean Vista Add
Ocean Vista Condo
Ocean Vue
Ocean Vue Amended Plat
Ocean Walk
Ocean Walk On South Beach
Ocean Walk Place
Ocean Walk Place Ph Ii
Ocean Walk Villas Condo
Ocean Wave
Ocean Way Estates
Ocean Way Park
Ocean Winds Of Juno Beach Repl
Ocean's Point
Oceana Bal Harbour Condo
Oceana Key Biscayne Condo
Oceana North I
Oceana North Ii
Oceana Oceanfront Condo
Oceana Oceanfront Condo I
Oceana Oceanfront Condomi
Oceana Oceanfront Condominium I
Oceana South Condo Ii
Oceana South Condominium Ii
Oceanage Condo
Oceanaire Heights Unit No
Oceanbay City
Oceanblue Condo Of Miami
Oceancrest
Oceancrest Condo Apts
Oceanfront
Oceanfront At Juno Beach Condo
Oceanfront Plaza Condo
Oceanhouses At Southpointe, Ocean Village
Oceania
Oceania I Condo
Oceania Ii Condo
Oceania Iii
Oceania Iii Condo
Oceania Iv Condo
Oceania V
Oceania V Condo
Oceanique Oceanfront, A Condominium
Oceanpointe
Oceanrise Condo
Oceanrise Condominium
Oceans Edge
Oceanside @ Fisher Isl Co
Oceanside Apartments Co-O
Oceanside Apartments Co-Op
Oceanside At Fisher Islan
Oceanside At Fisher Island
Oceanside At Lauderdale B-T-S
Oceanside Fisher Isl Cond
Oceanside Inn
Oceanside North Condo
Oceanside Plaza Condo
Oceanside Sec Isle Of Nor
Oceanside Sec Isle Of Normandy
Oceanside South
Oceanside Terrace Condo
Oceantree Condo
Oceanview
Oceanview Building A
Oceanview Building A Cond
Oceanview Building A Condo
Oceanview Building B Cond
Oceanview Building B Condo
Oceanview Park Condo
Ocoee Park
Octagon Towers I Condo
Octoraro Lakes
Odenton
Odenton Station
Odessa
Odessa Chase
Odessa Heights
Odessa National
Odmanns
Odyssey
Oella
Of Lazy 7
Of Lucy Island Subdivision
Off Shore Island
Offutt Estates
Offutt Home Tract
Offutt Village
Ogden
Ogden Farm Meadows
Ogontz
Ohio Apartment Bldg Condo
Ohio Grove
Ojus Sub
Ok Acres
Okan Tower
Okee-Simmee Development
Okeechobee
Okeechobee Kissimmee Prairie Preserve
Okeechobee Condo
Okeechobee County
Okeechobee Estates
Okeechobee Gardens
Okeechobee Hammock
Okeechobee Hammock Sec 3
Okeechobee Little Farms
Okeechobee Park
Okeelanta
Okeelanta Plantation Co 2
Okey Est
Oklahoma Estates
Ola Condo
Old Allentown
Old Banks
Old Bayside
Old Biscayne Villas Condo
Old Bridge Estates
Old Centreville Gardens
Old Chapel
Old Church Landing
Old City
Old City #1
Old City #2
Old Country Farms
Old Country Road Estates
Old County Estates
Old Covered Bridge
Old Cutler Bay Sec 2
Old Cutler Bay Sec 3
Old Cutler Bay Sec 4-A
Old Cutler Bay Sec Five
Old Cutler Cove
Old Cutler Cove Addn
Old Cutler Creek
Old Cutler Estates Sec 3
Old Cutler Estates Sec 4
Old Cutler Grove
Old Cutler Omni Pines
Old Cutler Palms
Old Cutler Point
Old Cutler Villas West
Old Dixie Estates
Old Dominion Valley
Old Dundalk
Old Farm
Old Farm Station
Old Farms
Old Fields Owners Association
Old Floresta
Old Forge Crossing
Old Georgetown Estates
Old Georgetown Vill Codm
Old Georgetown Village
Old Glen Burnie
Old Goucher
Old Harbour, St. Catherine
Old Highway
Old Hobe Sound
Old Lake Lakeport
Old Landing
Old Landing Woods
Old Marsh Golf Club
Old Mill Community
Old Mill Estates
Old Mill Pointe
Old Morgan Farms
Old New Castle
Old Oaks Estates
Old Orchard
Old Orchard Farm
Old Orchard Farms
Old Orchid Ph 3 Pd
Old Palm 2
Old Palm 3
Old Palm Pl 2
Old Port Cove
Old Port Cove - Lake Pointe Tower
Old Port Cove Condo One
Old Port Cove Condo Three
Old Port Cove Condo Two
Old Port Cove Harbor Village Condo
Old Port Cove Lake Point Tower
Old Port Cove Lake Point Tower Condo
Old Port Cove Tower East Condo
Old Port Cove Tower West Condo
Old Port Cove Towers
Old Port Village 1 A
Old Port Village 2
Old Port Village 4
Old Prospect Landing
Old Reliance Farms
Old Russell Farm
Old Salem Village
Old South Country Club
Old Stage Knolls
Old Stagecoach Condo
Old Stillhouse
Old Sugar Mill Estates Unit Seven
Old Timberline
Old Town
Old Town Alexandria
Old Town Bowie
Old Town Commons
Old Town Crescent
Old Town Greens
Old Town Manassas
Old Town North
Old Town Village
Old Town- Unrecord (1.0)
Old Town/Parker Gray
Old Towne At Juno Beach
Old Towne Village
Old Towne Village Condominiums
Old Trail
Old Trail - Ranch Colony
Old Trail Pud
Old Village
Old West Baltimore Historic District
Old Wheatland
Old Wyncote
Olde Belhaven Towne
Olde Colonial Greene
Olde Dover
Olde Forge
Olde Gold Cup Sec 2b
Olde Greenwich
Olde Kensington
Olde Mill
Olde Oak Farm Sub
Olde Oak Ridge
Olde Orchard Hill
Olde Paris
Olde Richmond
Olde Scotland Road
Olde South Crossing
Olde Stratford
Olde Town
Olde Uptown
Olde Uptown Harrisburg
Olde Village Pointe
Olde Village Pointe Condo
Olde Yorke Station
Oldebulltownvillage
Oldewoode
Oldfield Acres
Oldham Crossing
Oldmans Creek
Oldtown
Ole' At Lely Resort
Oleander Condo
Oleander Gardens Condo
Oleander House Condo
Oleander Pines
Oleander Pk 1st Addn
Oleta Terr
Oleta Terr N Miami Beach
Olive Glen Villas 1 Condo
Olive Leaf Condo
Olive Tree
Olive Tree Par 5d
Olive Tree Par 6a
Olive Tree Par 6b
Oliver
Oliver Beach
Oliver Court
Olivers Crossing
Olivias Subdivision
Olivine At The Township
Olney
Olney (East)
Olney Acres
Olney Mill
Olney Oaks
Olney Outside
Olney Square
Olney Towne
Olwills Sub
Olympia
Olympia & York Residentia
Olympia & York Residential Plat
Olympia / Zeus Park
Olympia 01
Olympia 1
Olympia 2
Olympian Gdn Condo
Olympic Heights
Olympus
Olympus 908. 12
Olympus At Landmark
Olympus Condo
Olympus Condo Phase
Olympus Condominium
Olympus Towers And Marina
Ombelle Fort Lauderdale
Omega
Omega 4
Omega 9 Condo
Omega Condo
Omega Condo No 1
Omega Condo No 10
Omega Condo No 11
Omega Condo No 2
Omega Condo No 3
Omega Condo No 4
Omega Condo No 5
Omega Condo No 8
Omega Condo No 9
Omega Villas 2 Condo
Omega Villas 3 Condo
Omni Estates 2nd Addn
Omni Estates 3rd Addn
On Alba
On Alba Onx Homes
On Top Of The World Phase 1-A Section 1
Onda Condo
Onda Residences
One Bal Harbour
One Bay Condo
One Bay Harbor Condo
One City Plaza
One City Plaza Condo
One City Plaza Condominium
One College Place
One Crescent
One Fifty One @ Biscayne C
One Harbour Way - Co-Op
One Hollywood Residences
One Hotel & Homes
One Hundred Church Stree
One Independence Plaza
One Island Place
One Island Place Condo
One Island Place Condo 1
One Island Place Condo Ii
One Loudoun
One Luxury Condo
One Miami East
One Miami East Condo
One Miami East Tower
One Miami West
One Miami West Condo
One National Harbor Condominium
One Ocean Condo
One Paraiso Condo
One Park By Turnberry
One Park Crest
One Park Crest Condominium
One Park Place
One Park Tower
One Park Tower By Turnber
One Park Tower By Turnberr
One Park Tower By Turnberry
One Park Tower One Park T
One Park Turnberry
One Royal Palm Way Condo
One Tequesta Point Condo
One Thousand Museum
One Thousand Museum Condo
One Thousand Ocean
One Thousand Venetian Way
One Village Place Condo
One Watermark Place
One24 Residences Condo
Onix Delray
Onondio
Ontelaunee Heights
Onville Estates
Onx Aurora Communities
Onyx On The Bay Condo
Oooooo
Opa Locka Industrial Pk
Opa Locka No. 3
Opa Locka Pl No 3
Opa Locka Plat No 1
Opa Locka Plat No 3 Rev
Opal Creek
Opal Towers Condo
Opal Towers East
Opal Towers West Condo
Opequon Estates
Opequon Hill
Opequon Meadows
Opera Tower
Opera Tower Condo
Opp106 Orlando Pines
Opp109 Orlando Pines
Opp110 Orlando Pines
Opp111 Orlando Pines
Opp113 Orlando Pines
Opp114 Orlando Pines
Opp115 Orlando Pines
Opp117 Orlando Pines
Opp168 Orlando Pines
Opp170 Orlando Pines
Opp171 Orlando Pines
Opp172 Orlando Pines
Opp175 Orlando Pines
Opp192 Orlando Pines
Opp193 Orlando Pines
Opp200 Orlando Pines
Opp201 Orlando Pines
Opp202 Orlando Pines
Opp205 Orlando Pines
Opp210 Orlando Pines
Opp217 Orlando Pines
Opp218 Orlando Pines
Opp26 Orlando Pines
Opp27 Orlando Pines
Opp28 Orlando Pines
Opp3 Orlando Pines
Opp31 Orlando Pines
Opp35 Orlando Pines
Opp37 Orlando Pines
Opp43 Orlando Pines
Opp44 Orlando Pines
Opp47 Orlando Pines
Opp69 Orlando Pines
Opp7 Orlando Pines
Opp71 Orlando Pines
Opp72 Orlando Pines
Opp73 Orlando Pines
Optima Village 1- C Condo
Optima Village I-C Condo
Optima Village I-E Condo
Or 940 P 230; Or 497 P 2023 Or 484 P 1903 Or 482 P
Ora Chokoloskee Rv Resort
Orange Blosoom
Orange Blossom
Orange Blossom Cc Cmnty
Orange Blossom Ccc Unit 1
Orange Blossom Ccc Unit 15
Orange Blossom Ccc Unit 16
Orange Blossom Ccc Unit 18
Orange Blossom Ccc Unit 19
Orange Blossom Country Club
Orange Blossom Ctry Club
Orange Blossom Est
Orange Blossom Est Unit 01
Orange Blossom Est Unit 02
Orange Blossom Est Unit 03
Orange Blossom Est Unit 04
Orange Blossom Est Unit 05
Orange Blossom Est Unit 07
Orange Blossom Est Unit 08
Orange Blossom Est Unit 10
Orange Blossom Est Unit05
Orange Blossom Est Ut 12 Rplt
Orange Blossom Estate
Orange Blossom Estates
Orange Blossom Estates 2nd Addition 2nd Plat
Orange Blossom Gardens Unit 08
Orange Blossom Hills Unit 13
Orange Blossom Manor
Orange Blossom Ranch
Orange Blossom Ranches
Orange Blossom Units 1-7 S
Orange Brook Mobile Home.
Orange Estates
Orange Glade
Orange Grove Est
Orange Grove Park Lts 10 To 13 Inc
Orange Heights
Orange Heights Unit No 1
Orange Hunt Estates
Orange Park
Orange Park Club Sec One
Orange Plat
Orange Point Ph 1
Orange Point Tr B
Orange Rd
Orange Ridge
Orange Ridge Ct
Orange River Hills
Orange Tree Country Club
Orange Tree Homes
Orange Tree Of Coral Spri
Orange View Park
Orange View Pk
Orangebrook
Orangebrook Golf Estates
Orangebrook Harbor
Oranges
Orangeville
Orchard
Orchard At New Market
Orchard Beach
Orchard Club
Orchard Estates
Orchard Gate At Piney Orchard
Orchard Glen
Orchard Groves Citrus
Orchard Hill
Orchard Hill Estates
Orchard Hills
Orchard Lake Town Houses
Orchard Lake Townhouses
Orchard Manor
Orchard On The Potomac
Orchard Place
Orchard Ridge
Orchard Sub 2 & 3
Orchard Sub No 1
Orchard Sub No 4
Orchard Valley
Orchard View
Orchard View At Mullica Hill
Orchard View Estates
Orchard Villa
Orchard Villa Extension
Orchard Villa Track Addn
Orchards
Orchards At Aura
Orchards Of Westlake
Orchards Of Westlake Phas
Orchards Of Westlake Phase 1
Orchards Of Westlake Phase 2
Orchards-Mt Joy
Orchid Bay
Orchid Bay / Captains Creek
Orchid Beach Condo
Orchid Gardens Condo
Orchid Grove Replat 1
Orchid Hammock At Ibis Golf And Country Club Condo
Orchid Island
Orchid Isle Estates Subdi
Orchid Isle Estates Subdivision
Orchid Lane
Orchid Park Of Wildewood
Orchid Reserve - Ibis
Orchid Reserve Condo
Orchid Tree Condo One
Orchid Tree Condo Three
Orebaugh
Oreland
Oriental Estates
Original Northwood
Oriole Estates Sec 3
Oriole Estates Sec 4
Oriole Estates Sec 6
Oriole Estates Sec 8
Oriole Gardens
Oriole Gardens 1 Condo
Oriole Gardens 18 Condo
Oriole Gardens 19 Condo
Oriole Gardens 21 Condo
Oriole Gardens 25 Condo
Oriole Gardens 28 Condo
Oriole Gardens 29 Condo
Oriole Gardens 3 Condo
Oriole Gardens 31 Condo
Oriole Gardens 33 Condo
Oriole Gardens 34 Condo
Oriole Gardens 5 Condo
Oriole Gardens 6 Condo
Oriole Gardens Phase 1
Oriole Gardens Three
Oriole Gardens Three 78 C
Oriole Gardens Three 80 Condo
Oriole Gardens Three 81 C
Oriole Gardens Three 81 Condo
Oriole Gardens Three 82 Condo
Oriole Gardens Three 83 C
Oriole Gardens Two
Oriole Gardens Two 40 Con
Oriole Gardens Two 42 Condo
Oriole Gardens Two 48 Condo
Oriole Gardens Two 50 Condo
Oriole Gardens Two 53 Condo
Oriole Gardens Two 57 Con
Oriole Gardens Two 57 Condo
Oriole Gardens Two 63 Con
Oriole Gardens Two 63 Condo
Oriole Gardens Two 66 Con
Oriole Gardens Two 69 Condo
Oriole Golf & Tennis 1
Oriole Golf & Tennis Club
Oriole Golf & Tennis Club Condo
Oriole Golf & Tennis Ph 1
Oriole Golf And Tennis
Oriole Margate Sec 6
Oriole-Margate Sec 3
Oriole-Margate Sec 4
Oriole-Margate Sec 5
Oriole-Margate Sec Two
Orion
Orla By Dorchester Collect
Orlean
Orleans Chateau & Villas Co-Op
Orleans House Condo
Orrick Commons
Orrtanna
Ort Charlotte Sec 019
Ortley
Ortona
Orvilla
Orwigsburg
Orwin
Osborn Island
Osborn Track
Osborne Add Amnd
Osborne Place
Osceola Arms Inc
Osceola Groves
Osceola Highlands
Osceola Mills
Osceola Park
Osceola Park / River Oaks
Osceola Park 9-46 B
Osceola Woods
Oslo Park
Oslo Park Unit No 3
Oslo Park Unit No 5
Oslo Park Unit No 6
Oslo Park Unit No 7
Oslo Park/Dixie Heights M&B
Osprey
Osprey Cove
Osprey Cove Yacht Club
Osprey Creek
Osprey Estates
Osprey Landing
Osprey Point
Osprey Preserve
Osprey Preserve Rpud
Other
Other/None
Ottens Harbor Area
Otter Creek Landing
Otter Road
Otter Run
Otterbein
Otters Run
Otting Pines
Our Place A K A Island No
Our Place A K A Island No 2
Ousley Estates
Out Of Area
Outback Ranches
Outdoor Country Club
Outdoor Resort
Outdoor Resort St Lucie West
Outdoor Resorts At Nettles Island
Outdoor Resorts At St Luc
Outdoor Resorts At St Lucie West
Outdoor Resorts At St Lucie West Phase 1 St Lucie
Outer Banks
Outrigger Condo
Outrigger Harbour Condo
Outrigger Harbour Yacht Club
Outside Urban Development
Ovations
Over Lee Knolls
Overbrook
Overbrook Farms
Overbrook Hills
Overbrook Manor
Overbrook Park
Overbrook Shores
Overbrook Shores No 2
Overbrook Shores No 3
Overbrook Shores No-2
Overiver Shores
Overlea
Overlea Hills
Overlook
Overlook At Carmichael
Overlook At Creekside
Overlook At Gateway
Overlook At Leisure World
Overlook At Macphail Woods
Overlook At Riverside
Overlook At Timbers
Overlook At Town Center
Overlook At Westmore
Overlook Colony
Overlook Condo
Overlook Knolls
Overlook Ridge
Overlook Terrace
Overlook Townhouses
Owen Brown Estates
Owen Soper Estates
Owens Brooke
Owens Landing
Owens Wood
Owings Beach
Owings Choice
Owings Mills
Owings Mills New Town
Owings Ridge
Owings Station
Owls Nest
Oxbow Estates
Oxbow Lake Waterfront Acre
Oxen Hill
Oxford
Oxford Acres
Oxford Circle
Oxford Condo
Oxford Court Condo
Oxford Oaks
Oxford Oaks Sub
Oxford Of Blue Bell
Oxford Place
Oxford Pointe
Oxford Ranch 2 Ph 2
Oxford Square
Oxford Towers Condo
Oxford Valley
Oxfort Court Condo
Oxon Hill
Oxon Run Hills
Oyster Bay Condominiums
Oyster Bay Condos
Oyster Bay Ii
Oyster Bay Villas
Oyster Cove
Oyster Harbor
Oyster House Village
Oyster Rock
Ozello Keys, Estuary Dr
P & A Sub
P & T Sub
P A At Coral Reef
P A At West Kendall
P A At West Sunset
P T V
Pacc 9
Package 2 Units+Dock Avail
Packard Grande
Packer Park
Packingtown Add
Paddington Park
Paddock Farms
Paddock Park
Paddock Park 1
Paddock Park 1 Of Wellington
Paddock Park 2 Of Wellington
Paddock Park No 2 Of Wellington
Paddock Pointe
Paddocks East
Padgett Estates
Padgett Park
Padonia Complex
Paeonian Springs
Pagani Residences
Page County
Page Park
Page Valley Estates
Paget House Condo
Pahagaco Hills
Paige
Paint Branch Estates
Paint Branch Farms
Painters Crossing
Palaco Grande
Paladin
Paladin Club
Palama Estates
Palatine Lake
Palatka
Palatka Dev Co Sub
Palazzo At Park Center
Palazzo Del Mare At Fisher
Palazzo Del Sol
Palazzo Del Sol/Della Lun
Palermo Acres
Palisade Gardens
Palisades
Palisades At Oak Creek
Palisades On The Severn
Palisades Park
Palladian
Palladium At Mclean
Palladium Twin Lakes
Palm Acres Estates
Palm Acres Estates Add 2
Palm Acres Tr No 2 Unrec
Palm Aire
Palm Aire - No Hoa!
Palm Aire Condos
Palm Aire Contry Club #5
Palm Aire Country Club
Palm Aire Gardens Condo
Palm Aire Oaks Course Est
Palm Aire Oaks Course Estates
Palm Aire Village 2nd Sec
Palm Aire Village 3rd Section
Palm Aire-Cypress Grove
Palm Ave Heights
Palm Ave Highlands
Palm Ave Lawns
Palm Bay
Palm Bay Club Condo
Palm Bay Club Condominium
Palm Bay Condo
Palm Bay Condominium
Palm Bay Towers Condo
Palm Beach
Palm Beach Atlantic Condo
Palm Beach Biltmore Condo
Palm Beach Cabana Colony
Palm Beach Cabana Colony 1
Palm Beach Cabana Colony East
Palm Beach Colony Sec 2
Palm Beach Colony Secs 1 And 2
Palm Beach Country Estates
Palm Beach County 55+ Assemblage
Palm Beach Estates
Palm Beach Farms
Palm Beach Farms Co 1
Palm Beach Farms Co 10
Palm Beach Farms Co 11
Palm Beach Farms Co 3
Palm Beach Farms Co 7
Palm Beach Farms Co Pl 3
Palm Beach Farms Co Pl No
Palm Beach Farms Co Pl No 3
Palm Beach Farms Co Place
Palm Beach Farms Co.
Palm Beach Gardens
Palm Beach Gardens 3
Palm Beach Gardens 5
Palm Beach Gardens 6
Palm Beach Gardens Estates
Palm Beach Grande Condo
Palm Beach Hampton Condo
Palm Beach Heights
Palm Beach Hotel Condo
Palm Beach House
Palm Beach House Condo
Palm Beach Isles
Palm Beach Isles 1
Palm Beach Isles 2
Palm Beach Isles 3
Palm Beach Lake Worth Estates 2
Palm Beach Lakes North 1
Palm Beach Lakes South
Palm Beach Lakes South 2
Palm Beach Leisureville
Palm Beach Leisureville 0
Palm Beach Leisureville R
Palm Beach Leisureville Replat
Palm Beach Leisureville S
Palm Beach Leisureville Sec 10
Palm Beach Leisureville Sec 2
Palm Beach Leisureville Sec 3
Palm Beach Leisureville Sec 5
Palm Beach Leisureville Sec 5a
Palm Beach Leisureville Sec 6
Palm Beach Leisureville Sec 7
Palm Beach Leisureville Sec 8
Palm Beach Leisureville Sec 9
Palm Beach Little Ranches
Palm Beach Little Ranches 2
Palm Beach Little Ranches East Of Wellington
Palm Beach Natl Golf And Country Club
Palm Beach North Resub In
Palm Beach Park Of Commer
Palm Beach Place Condo
Palm Beach Plantation
Palm Beach Plantation Diamond C Ranch Pod D Rep
Palm Beach Point
Palm Beach Point - Sun Glade
Palm Beach Point East
Palm Beach Point East Area
Palm Beach Polo Equestrian Club
Palm Beach Ranches
Palm Beach Ranches (Unrec)
Palm Beach Ranchettes
Palm Beach Shore Acres
Palm Beach Shores
Palm Beach Shores Acres
Palm Beach Shores Apartments
Palm Beach Square
Palm Beach Square Unit 1
Palm Beach Square Unit 4
Palm Beach Square Unit 5
Palm Beach Square Unit 6
Palm Beach Towers Cond
Palm Beach Towers Condo
Palm Beach Trace Condo
Palm Beach Villas Condo
Palm Beach Villas Ii
Palm Breeze Club
Palm Breezes
Palm Breezes Club
Palm Breezes.;
Palm Cay
Palm Chase
Palm Chase Condo
Palm Chase Lakes
Palm Chase Lakes Condo
Palm City
Palm City Amd
Palm City Amended
Palm City Farms
Palm City Farms Tr 42
Palm City Gardens
Palm City Park
Palm Club
Palm Club Co-Op
Palm Club Village
Palm Club Village I Condo
Palm Club Village Ii Cond
Palm Club Village Ii Condo
Palm Club West
Palm Club West Village 1
Palm Club West Village 1 Condo
Palm Club West Village 2
Palm Coast
Palm Coast Sec 07
Palm Court At Wellington Condo.
Palm Court Condo
Palm Court Of Miami Condo
Palm Cove
Palm Cove Cond
Palm Cove Condo
Palm Cove Golf & Yacht Club
Palm Cove Golf & Yacht Club Ph
Palm Cove Harbour Island
Palm Cove Pud Ph 04 & 05
Palm Crest Villas Condo
Palm Estates
Palm Estates At Vero Beach Condo
Palm Garden
Palm Garden Condo
Palm Garden Park
Palm Gardens 1st Add
Palm Gardens 1st Addn Unrec On Am-16
Palm Gardens At Doral Con
Palm Gardens Condo
Palm Gardens Replat Unrec On Am-53
Palm Glade Ranches
Palm Glade Ranches Unrec
Palm Greens
Palm Greens At Villa Del
Palm Greens At Villa Del Ray Cond Phase 1,2,2-A,2-
Palm Greens At Villa Del Ray Condo
Palm Greens At Villa Del Ray Condo I
Palm Greens At Villa Del Ray Condo Ii
Palm Grove Acres
Palm Grove Subdivision
Palm Haven Subdivision
Palm Hgts
Palm Hill Villas Unit One
Palm Hill Villas Unit Three
Palm Hill Villas Unit Two
Palm Island
Palm Isle Estates
Palm Isles
Palm Isles I, Ii And Iii Condos
Palm Isles West
Palm Jebel Ali
Palm Lake
Palm Lake 1 Condo
Palm Lake Co-Op Inc Ph Ii
Palm Lake Condo
Palm Lake Estate
Palm Lake Estates
Palm Lake Gardens
Palm Lake Park
Palm Lakes
Palm Lakes Condo
Palm Lakes Gardens
Palm Lakes Sec 1
Palm Lakes Sec 3
Palm Lane Homes In Mirama
Palm Lane Villa
Palm Meadows Estates
Palm Miami Heights Rev
Palm Oak Estates
Palm Park
Palm Park Amd
Palm Place Condo
Palm Point
Palm Point Sec 1
Palm Pointe At Martin Downs (Aka Martin Downs Plat
Palm Ridge
Palm Ridge Estates 1
Palm Ridge Gardens
Palm Royal Apts
Palm Royal Apts Inc Condo
Palm Royal Condominium
Palm Shores
Palm Shores At Gables End / Windward Palm Beach 2
Palm Shores Windward
Palm Spgs Village 02
Palm Spgs Village 08
Palm Spring
Palm Spring Estates
Palm Springs
Palm Springs 1st Addn
Palm Springs 2
Palm Springs 2 Condo
Palm Springs 3rd Addn
Palm Springs 5th Addn Sec
Palm Springs Amd
Palm Springs Condo
Palm Springs Ests 3rd Add
Palm Springs Gardens Bldg
Palm Springs Lakes 5th Ad
Palm Springs North Sec A
Palm Springs North Sec C
Palm Springs North Sec N
Palm Springs North Sec S
Palm Springs North Sec T
Palm Springs North Sec U
Palm Springs Sub Sec 3 5t
Palm Springs Sub Sec B 4t
Palm Springs Village 2
Palm Springs Village 4
Palm Springs Village 5
Palm Springs Village 7
Palm Springs Village 8
Palm Springs Village Cond
Palm Springs Village Pl 3 In
Palm Square
Palm Terrace
Palm Terrace Condo
Palm Townhouse Condo
Palm Trail
Palm Trail Place Condo
Palm Trail Sub
Palm Trail Subdivision
Palm View
Palm View Sub
Palm Village Club Condo
Palm Village Condo
Palm Village Ranch
Palm Villas
Palm Villas By Bluenest
Palm Villas Of Hialeah Co
Palm Vista
Palm Vista Everlands
Palm Worth Inc
Palm-Aire
Palm-Aire At Coconut Cree
Palm-Aire At Coral Key
Palm-Aire C C 79 Condo
Palm-Aire C C Apts 114 Co
Palm-Aire Cc 50
Palm-Aire Country C
Palm-Aire Oaks Course Est
Palm-Aire Village W 2nd Sec
Palm-Aire Village 2 Sec A
Palm-Aire Village 2 Sec Add 3
Palm-Aire Village 2nd Sec
Palm-Aire Village 4th Sec
Palm-Aire Village 4th Section
Palm-Aire Village Section
Palm-Aire Village Section 3
Palm-Aire Village West
Palm-East Gardens Condo
Palm-West Gardens Condo
Palma Real Townhomes Cond
Palma Real Villas/Cocotal
Palma Sola
Palma Vista Condo
Palmas Altas Condo
Palmbrooke Townhomes
Palmcreek
Palmdale
Palmdale Mobile Home Park
Palmdale Sub
Palmer
Palmer Heights
Palmer Park
Palmer Square
Palmerwood
Palmetto Bay
Palmetto Condo
Palmetto Country Club Est
Palmetto Country Club Ests Pt 2
Palmetto Fairway Condo
Palmetto Fifth Avenue Con
Palmetto Gardens Condo
Palmetto Gardens North Con
Palmetto Grove
Palmetto Grove 1st Addn
Palmetto Harbor
Palmetto Homesites
Palmetto Park Terrace Unit 4
Palmetto Place
Palmetto Place Condo
Palmetto Trailer Estates
Palmhurst
Palmira, Valle Del Cauca, Colombia
Palmlake Gardens & Estates
Palmland Estates
Palmland Estates 1st Addn
Palmland Homes South No 4
Palmland Homes South No 5
Palmland Homes South No 7
Palmland Park
Palmland Villas I Condo
Palmona Park
Palms - Phase 5
Palms At Bella Vista
Palms At Boca Pointe
Palms At Dania Beach Cond
Palms At Eureka Phase One
Palms Club Condominium
Palms No 2, The
Palms Of Boca Lago Condo
Palms Of Pembroke Condo
Palms On Venice Condo
Palms Point Condo
Palms Tower One Condo
Palms Tower Two Condo
Palms Villas And Condos S
Palmsea Cond
Palmview Condominium Apar
Palmway Apts Condo
Palmyra
Palmyra Borough
Palmyra Estates
Palmyra Gardens
Palmyra Harbour
Palo Alto
Paloma
Paloma Lakes
Paloma Lakes Condominium No 1
Paloma Lakes Plat
Palomar
Palomar At Boca Pointe
Palomar Sub
Palomino Farms
Pamunkey Point
Pan American North Busine
Panacea Shores
Panache At Boca Pointe
Panache At Boca Pointe Co
Panache At Boca Pointe Condo
Panache Sec 3
Panama Club Condo
Panama West
Pangborn Park
Pansy Hill Area
Panther National At Avenir
Panther National At Avenir Pod
Panuleta Gardens
Panway
Paoli Gardens
Paoli Pointe
Papaya Village
Par Acres
Para Villa Heights
Paradise
Paradise Acres
Paradise At Dadeland Cond
Paradise At Sunset Condo
Paradise By The Sea Condo
Paradise Coconut
Paradise Estates
Paradise Farm
Paradise Gardens
Paradise Gardens Inc Cond
Paradise Gardens Iv Inc C
Paradise Gardens Sec 1
Paradise Gardens Sec 2
Paradise Gardens Sec 3
Paradise Gardens Sec 3 72
Paradise Gardens Sec 4
Paradise Gardens Sec Two
Paradise Harbour
Paradise Harbour Apts Co-
Paradise Harbour Apts Co-Op
Paradise Harbour Condo
Paradise Harbour Condo No 1
Paradise Heights
Paradise Lakes
Paradise Lakes Sub
Paradise Mhp
Paradise One
Paradise Palms Unit 4
Paradise Park
Paradise Park Amd Pl
Paradise Park Unit 3
Paradise Park Unit No 1
Paradise Park Unit No 2
Paradise Pines
Paradise Point
Paradise Point 1st Amendm
Paradise Point On Trough Creek
Paradise Pointe Condo
Paradise Reef
Paradise Ridge
Paradise Towers Co-Op
Paradise Twp
Paradise View Estates
Paradise Village
Paradise Villas Condo
Paragon Centre
Paragon Plantation Condo
Paraiso Bay *Villa*
Paraiso Bay Condo
Paraiso Bayviews
Paraiso Bayviews Condo
Parajes De Meridor
Paramount
Paramount Bay Condo
Paramount Fort Lauderdale
Paramount Ft Lauderdale C
Paramount Ft Lauderdale Condo
Paramount Manor
Paramount Miami
Paramount Miami World
Paramount Miami World Cent
Paramount Miami Worldcen
Paramount Miami Worldcent
Paramount Miami Worldcente
Paramount Miami Worldcenter
Paramount Miami Worldcenter Condo
Paramount World Center
Paramount Worldcenter
Parc Central
Parc Central Aventura
Parc Central Aventura Eas
Parc Central Aventura East
Parc Central Aventura East Condo
Parc Central Aventura Sou
Parc Court Condo
Parc East
Parc Lofts Condo
Parc Plaza Condo
Parc Village Condo
Parc Vista Condo
Parcel 32 Pud
Parcel 431
Parcel A Nautica Plat
Parcel D At Sunset Lakes
Parcel F Nautica Re-Plat
Parcel G At Lago Mar
Parcel I Nautica Plat
Parcelacin Altos De Yerbabuena
Parcelacin Encenillos
Parcelacion El Yarumo
Parcreston
Paris Ests
Paris France
Paris Manor East
Parish Hill Estates Ii
Park Fairfax
Park At Fair Oaks
Park At Windwood Condo
Park Beach Club Condo
Park Campus
Park Center
Park Central At Cypress Key
Park Chesapeake
Park Circle
Park City Sec 3
Park City Sec One
Park City Sec One 49-11 B
Park City Sec Three
Park City Sec Two
Park City Sec Two 56-25 B
Park City Section Two-A
Park City West
Park Corner Condo
Park East Condo
Park Est
Park Estates
Park Estates Sec 2
Park Fairfax
Park Forest Village
Park Fountain Condo
Park Gate
Park Gate Estates
Park Glen
Park Haven Condo
Park Heights
Park Hill Est
Park Hill Ests
Park Hill Villages
Park Hills
Park Lake Vilg Condo Phs
Park Lakes By The Meadows
Park Lakes Sec 1
Park Lakes Sec 2
Park Lane Estates Sub
Park Manor
Park Manor 1
Park Manor 2
Park Manor 3
Park Manor 6
Park Manor Ests Sec 7
Park Manor Ests Sec 8
Park Overlook
Park Pines
Park Place
Park Place At Ballenger
Park Place At Midway Cond
Park Place At Plantation
Park Place At Pompano
Park Place At Pompano Condo
Park Place Codm
Park Place Condo
Park Place Condo At Worman's Mill
Park Place Condominium
Park Place Condominium No
Park Place Condominium No Five
Park Place Condominium No Four
Park Place Condominium No One
Park Place Condominium No One 507
Park Place Condominium No Three
Park Place Condominium No Two
Park Place Condominiums
Park Place Of Wellington
Park Place Townhomes
Park Place Trlr Pk
Park Plaza
Park Plaza Apts Condo
Park Plaza Townhouses Con
Park Pointe
Park Pointe 2
Park Potomac
Park Residences Condo
Park Ridge
Park Ridge East Apts Cond
Park Ridge Estates
Park Ridge North Apts Condo
Park Road Manor
Park Shore
Park Shores
Park Shores Phase Iv Condo
Park Side Manor B Condo I
Park South Condominium
Park South Eight Inc Cond
Park South Eight Inc Condo
Park South Eleven Inc
Park South Eleven Inc Con
Park South Five Inc Condo
Park South Four Inc Condo
Park South One Inc Condo
Park South Seven Inc Cond
Park South Seven Inc Condo
Park South Ten Inc Condo
Park South Three Inc Condo
Park South Two Inc Condo
Park Spring
Park Square Condo
Park Square Condo (Aka Country Meadows Condo)
Park Summit Codm
Park Sutton Codm
Park Terrace
Park Tower Condo
Park Towers
Park Towers East
Park Towers West
Park Valley Farms
Park View
Park View At Palm Beach Condo
Park View Island
Park View Square
Park View Sub
Park View Summit Heights
Park Village
Park Villas Condo
Park West
Parkchester Ests
Parkdale
Parkdale Manor House Condo
Parke Place
Parke West Add
Parker Condo
Parker Dorado
Parker Dorado Condo
Parker Farm
Parker Gray
Parker Gray Historic District
Parker Heights
Parker Highland
Parker Highland Condo
Parker Hill
Parker Plaza Condo Estate
Parker Plaza Condo Estates
Parker Plaza Estates Cond
Parker Point Townhouse
Parker Pointe
Parker Pointe Townhomes
Parker Preserve
Parker Sub
Parker Tower Condo
Parker-Uber Center At Tam
Parkers Creek
Parkers Flagler Heights
Parkers Pointe
Parkers Run
Parkers Shores
Parkertown
Parkesburg
Parkevue (Salem Fields)
Parkfairfax
Parkhurst
Parkland
Parkland Bay
Parkland Farms
Parkland Golf & Country C
Parkland Golf & Country Club
Parkland Golf And Country
Parkland Golf And Country Club
Parkland Isles
Parkland Isles - Crystal Key
Parkland Lakes
Parkland Royale
Parkland Royale Crown
Parkland Royale Monarch
Parkland Terraces
Parkland Village Replat O
Parkland Village Replat Two
Parklands At Watkins Mill
Parklane
Parklawn
Parkplace Condominiums
Parkplaceatgrdnstprk
Parks At Piedmont South
Parkside
Parkside At Alexandria
Parkside At Ashburn
Parkside At Lampeter
Parkside At Spring Valley
Parkside At Tuttle Royale
Parkside At Warfield
Parkside At Westphalia
Parkside Condominiums
Parkside Courts
Parkside Estates
Parkside Estates At Stonef
Parkside Gardens
Parkside Green
Parkside Heights
Parkside Mews
Parkside No 2 Condo - Bld
Parkside Plaza Codm
Parkside Preserve
Parkside Quantum Park Townhomes
Parkside Ridge
Parkside Square
Parkside Townhome Condos
Parkside Village
Parkside Villas Condo
Parksley
Parkton
Parktowne
Parkview
Parkview @ Boiling Spring
Parkview Condo
Parkview Condo No 1
Parkview Condo No 2
Parkview East
Parkview Estates
Parkview Heights
Parkview Heights Estates
Parkview Hills
Parkview Manor Condo Decl In
Parkview Point Condo
Parkview Trail
Parkview Villas Condo
Parkview Villas Replat
Parkville
Parkville Heights
Parkville Summit
Parkville/Carney
Parkwalk
Parkwalk 1
Parkwalk 2
Parkwalk 4
Parkway
Parkway Condominiums
Parkway Farms
Parkway Gardens
Parkway Grove Condo Par
Parkway Grove Condo Part
Parkway Groves Estates Unit 1
Parkway Palms Resort
Parkway Palms Resort Maing
Parkway Place
Parkway Plaza Plat No 2
Parkway Preserve
Parkway Towers Bldg 1
Parkway Towers Bldg 1 Con
Parkway Towers Bldg 1 Condo
Parkway Village
Parkway Village Manufactured Home Community
Parkway West
Parkwood
Parkwood Homes
Parkwood Ix
Parkwood Manor
Parkwood Terrace
Parl
Parliament East Condo
Parliament Golf Villas Condo
Parliament House
Parliament House Condo
Parliament Ridge
Parque Empresarial
Parque Towers
Parque Towers Condo
Parris Minor 01
Parris Subdivision
Parrish
Parrish Park
Parroquia Iaquito
Parrot Cay
Parrs Ridge
Parry Trailer Village
Parsons Village
Partlow
Partridge Knoll
Partridge Run
Pasadena
Pasadena At Pembroke Shor
Pasadena Garden
Pasadena Garden Apartment
Pasadena Garden Apartments Co-Op
Pasadena Gardens Gulfview
Pasadena Lakes
Pasadena Lakes South
Pasadena Lakes West
Pasadena Manor
Pasadena Park Sub
Paschall
Paseo
Paseo Real Condo
Paseos/ Pines On Pennock Lane Pud 2
Passages Of Jupiter Island Condo
Passyunk Square
Pastelle (Aka Oaks)
Patapsco Crossing
Patapsco Glen
Patapsco Overlook
Patapsco Park
Patapsco Park Estates
Patapsco Ridge
Patch Reef Est
Pateo Leopoldo
Pathfinder Meadows
Pathways Condo
Patio Condo
Patio Homes At Fairmont
Patio Villas Sec Four At
Patio West One Condo
Patios Del Mar
Patios Of Boca Barwood Co
Patios Of Boca Barwood Condo
Patios Of Oakwood Condo
Patkay Sub
Patrician Condo
Patrician Of Palm Beach C
Patrician Of Palm Beach Condo
Patrick Henry
Patriot Square
Patriot's Choice
Patriot's Walk
Patriots Glen
Patriots Ridge
Patterson Estates
Patterson Park
Patterson Park 1st Add
Patterson Park 1st Add 50
Patterson Park 2 Add
Patterson Park 3 Add
Patterson Place
Pattersons Sub
Patuxent Business Park
Patuxent Chase
Patuxent Greens
Patuxent Heights
Patuxent Manor
Patuxent Mobile Estates
Patuxent Palisades
Patuxent Park
Patuxent Point
Patuxent Reach
Patuxent Run
Patuxent View
Paul Marks Sub
Pavilion
Pavilion In The Park
Pavilion On The Park
Pavilions At Huntington
Pavillions Of Voor
Paxtang
Paxtang Borough
Paxton
Paxton Crossing
Paxtonia
Paynes Point
Paynters Mill
Pbce/Jupiter Farms
Pbe Aqua
Pbe Meadow View
Pcc44 Polk City
Pch 052 1767 0001
Pch 087 4560 0028
Pch 087 4579 0012
Pcp
Pea Neck
Peace Creek Reserve
Peace Plantation Ii
Peace River Shores
Peacedale Court
Peacefields
Peaceful Acres
Peaceful Valley Estates
Peach Blossom Farm
Peach Bottom
Peach Bottom Twp
Peach Glen
Peach Orchard
Peachbasket
Peachtree
Peacock
Peacock Lake
Peacock Station
Peacocks Point
Peahala Park
Pearce Creek
Pearl City
Pearl Condo
Pearl Estates
Pearl Harbor
Pearl Lundy Unrec
Pebble Creek
Pebble Creek At Jacaranda
Pebble Hill
Pebble Hill Acres
Pebble Ridge
Pebble Springs Condominiu
Pebblewood Ph 3
Pebblewood Ph 3 Of Palm Beach Polo And Cc
Pecan Ridge
Pedernales
Peerless
Pelham's Crossing
Pelican Bay At Old Cutler
Pelican Bay At Old Cutler Lakes
Pelican By The Beach Cond
Pelican Cove
Pelican Cove Of
Pelican Cove West
Pelican Harbor
Pelican Isle
Pelican Isle 21-19 B
Pelican Landing
Pelican Landing Condo
Pelican Lodge Condo
Pelican Place
Pelican Point
Pelican Point At Boynton
Pelican Pointe
Pelican Pointe Condo
Pelican Pointe Of Sebastian V
Pelican Pointe West
Pelican Reef
Pelican Ridge
Pell Manor Condo
Pell Manor Condominium 3
Peloro
Peloro Condo
Pemberton
Pembridge A Thru I
Pembridge C
Pembridge G
Pembridge Heights
Pembroke Arms Condo Apts
Pembroke Cay Condo
Pembroke Falls
Pembroke Falls - Phase 1
Pembroke Falls Bimini Bay
Pembroke Falls Ph 3 158-2
Pembroke Falls Ph 5
Pembroke Falls Phase 2
Pembroke Falls Phase 3
Pembroke Falls Phase 5
Pembroke Falls Phase 6
Pembroke Falls-Phase 1
Pembroke Falls-Phase 5
Pembroke Grove
Pembroke Harbor Plat
Pembroke House Condo
Pembroke Isles
Pembroke Isles 1
Pembroke Isles Iv
Pembroke Isles V
Pembroke Lakes Sec 1
Pembroke Lakes Sec 2
Pembroke Lakes Sec 4
Pembroke Lakes Sec 5
Pembroke Lakes Sec 6
Pembroke Lakes Section Ei
Pembroke Lakes Section Se
Pembroke Lakes South
Pembroke Land Corp Plat
Pembroke Pointe
Pembroke Pointe Parcel
Pembroke Pointe Section T
Pembroke Pointe Section Three
Pembroke Ranches
Pembroke Shores
Pembrook Of Loudoun
Pembrook Village
Pembrooke
Pembrooke Square
Pembrooke/Victory Lakes
Pemdale
Pen Lucy
Pen-Ten Co-Op Apts Inc
Penbrook
Penbrook Borough
Pencader Hundred
Pender Oaks
Penderbrook
Penderbrook Square Condominiums
Penderbrooke
Penderwood
Pendleton
Pendry Acres
Peninsula
Peninsula At Intl Gardens
Peninsula Lakes
Peninsula On The Intracoas
Peninsula On The Intracoastal Condo
Peninsula On The Intracostal
Peninsula Village Greens
Penn
Penn 10 Manor Condo
Penn Beach
Penn Branch
Penn Condo
Penn Cove Villas
Penn Crossing
Penn Eleven Co-Op
Penn Estates
Penn Forest Streams
Penn Hills
Penn Lincoln
Penn Manor Condo
Penn National
Penn National Estates
Penn National Golf Course Community
Penn North
Penn Oaks
Penn Oaks South
Penn Pines
Penn Plaza Condo
Penn Point
Penn Quarter
Penn Rose
Penn Sq
Penn Square
Penn Street
Penn Terrace Towers Condo
Penn Twp
Penn Valley
Penn Valley Manor
Penn Valley Mhp
Penn Wynne
Penn's Landing
Penn-Dupont Office
Penn-Knox
Penn-Lincoln Adult C
Penn-Twelve Condo
Pennbrook
Pennbrooke Manor
Pennell Pl
Pennfield
Pennington
Pennington Point
Pennock Point
Pennock Preserve (Aka Prado)
Pennock Woods
Penns Grant
Penns Preserve
Pennsauken Border
Pennsauken Woods
Pennsburg
Pennside
Pennsport
Pennsylvania Condominium
Pennsylvania Crossing
Pennwood
Pennwood Crossing
Pennwood Farms
Penny Acres
Pennypack
Pennypacker Park
Penrose
Penrose Park
Penrose Walk
Pent Condo
Pent Homestead
Pentagon City
Pentagon Industrial Ctr
Pentalago Phase I
Pentalago Plat Phase 1
Penthouse
Penthouse Condo
Penthouse Condominiums
Penthouse Delray Condo
Penthouse Highlands Condo
Penthouse North
Penthouse Towers Condo
Pentland
Pepermill Kendale Lakes
Pepper Farm Towns
Pepper Mill Village
Pepper Tree Estates
Peppermill Estates
Peppermill Kendale Lk's W
Peppermill Kendale Lks W
Peppermint Woods
Peppertree
Peppertree On The Park Co
Pepperwood
Pepperwood Assemblage P.U.D.
Pequea
Peral Sub
Perch Creek
Peregrine
Pergin Farm
Perigon Point
Perkins Glen
Perkins Run
Perkiomen Crossing
Perkiomen Greene
Perkiomen Pl
Perkiomen Woods
Perla Bonita
Perla Marina
Perrine
Perrine Edmor Sub 3rd Addn
Perrine Grant Land Co
Perrine Grant Sub
Perrine Industrial Park
Perrine Park
Perrine Park 1st Addn
Perring Loch
Perrow Addn To Remington
Perry Brook Condominiums
Perry Cabin
Perry County
Perry Farms
Perry Hall
Perry Hall Estates
Perry Hall Farms
Perry Hall Farms Garden Condos
Perry Hall Manor
Perry Mill
Perry Tract
Perry's Choice
Perry's Retreat
Perryhall
Perryville
Perrywood
Pershing Park Lake Add
Persimmon Hills
Persimmon Park Pl
Perth Hills
Peruvian Terrace Condo
Pervas Sub
Peter J Pedicini Plat No 1
Peters Addn To Pramar Sub
Peters Twp
Petersburg
Petes Place
Petes Place 1st Addn
Petit Park
Petite
Petropolis Rj Brasil
Pettits Addn To Hyattsvi
Petunia Gardens Condo
Petworth
Pga Club Cottages
Pga Commons 4
Pga Estates
Pga National - Barclay Club
Pga National Golf Club Estates 1
Pga National Golf Club Estates 2
Pga Patio Homes
Pga Resort Community 2
Pga Resort Community 3
Pga Resort Community 4
Pga Resort Community Of Eagleton
Pga Resort Community Of Eagleton Estates
Pga Resort Community Of Heather Run
Pga Resort Community Of Ironwood 1
Pga Resort Community Of Ironwood Pl 1
Pga Resort Community Of Monterey Pointe
Pga Resort Community Of Preston
Pga Resort Community Of Townhomes Of Marlwood
Pga Resort Community Pl 6
Pga Resort Community Pl Of Prestwick Chase Unit 1
Pga Resort Community Pl Of Windermere Unit 1
Pga Verano
Pga Verano - Village Emilia
Pga Village (Greenbrier)
Pga Village (The Lakes)
Pga Village - Mystic Pines At The Reserve
Pga Village - Reserve Creek
Pga Village - Sabal Creek
Pga Village Verano
Pga Village, Maidstone
Pga Village, Pinehurst
Ph Velamar (Buenaventura Marina)
Phase Two St Lucie West Plat No 180
Pheasant Farm Sub
Pheasant Hill
Pheasant Pointe
Pheasant Ridge
Pheasant Ridge Mhp
Pheasant Run
Pheasant Run - Barnegat
Pheasant Run - Forked River
Pheasant Run At Rosemont
Pheasant Run Estates
Pheasant Walk
Pheasant Walk Sec 1
Pheasant Walk Sec 3
Pheasant Walk Sec 6
Pheasant Walk Sec 7
Pheasent Pt
Phelans Manor
Pheonix
Philadelphia
Philadelphia (North)
Philadelphia (Northeast)
Philadelphia (Northwest)
Philadelphia (South)
Philadelphia (Southwest)
Philadelphia (West)
Philarthria
Philips Heights
Philipsburg
Phillips
Phillips Division
Phillips Hill Estates
Phillips Park
Phillipsburg
Phillipsons Addn To Hiale
Philmont
Phipps House Cond Decl Filed 4-27-89
Phipps Plaza
Phoenician Cove
Phoenix
Phoenix Communities
Phoenix Park
Phoenix Towers
Phoenix Towers Condo
Phoenix Towers Condo No 1
Phoenixville Heights
Piazza
Piazza Vecchia
Pic Estates Sec 1
Pickering Crossing
Picket Lane 22-12
Pickett Center
Picketts S/D Sibbald Grnt
Pickwick Lake Estates Sec
Pickwick Lake Ests Sec 2
Pickwick Village
Pie Island
Pieces Oeight Condominium
Piedmont
Piedmont Hills
Piedmont South
Pier 41 Condo
Pier 43 Condo
Pier Homes At Harborview
Pier Sixty Six
Pier Sixty-Six
Pierces Div Bisc Park A R
Pierces Div Lemon City Pb
Pierces Lemon City
Pierces Point
Pierpoint Yacht Club Condo
Pierpointe East Condo Two
Pierpointe Five Condo Iii
Pierpointe One Condo I
Pierside At Harborview
Pigtown Historic District
Pike And Rose
Pike Place
Pike Run
Pikesville
Pikesville Farms
Pilgrim Gardens
Pilgrim Gdns
Pilot House Condo
Pilottown Village
Pimlico
Pimlico Farms
Pimmit Hills
Pimmit View
Pin Oak Mobile Home
Pinar Condo
Pindell Woods
Pine Acres
Pine Acres Ests
Pine Acres Sec 2
Pine Acres Sec 4
Pine Acres Sec 5
Pine Air
Pine Bay Estates Sec No 2
Pine Breeze Golf Villas Unrecorded
Pine Brook Estates
Pine Channel Estate Sec 2
Pine Condominium
Pine Court Condo
Pine Creek
Pine Creek Town Homes Phase Ii B
Pine Creek Valley
Pine Crest Amended Plat
Pine Crest Condo
Pine Crest First Add
Pine Crest Sub Delray
Pine Crest Villa
Pine Crest Village I At
Pine Crest Village I At Victoria Park Condo
Pine Crest Village Ii
Pine Crest Village Ii At
Pine Croft
Pine Drive Waterfront Condo
Pine Forest Estates
Pine Gardens
Pine Gardens In Pb 2 P 77, Pb 11 P 28 & Pb 12 P 21
Pine Glen
Pine Grove
Pine Grove Condo
Pine Grove Estates
Pine Grove Homes
Pine Grove Park
Pine Grove Village
Pine Harbour
Pine Harbour 1st Add
Pine Haven
Pine Highlands
Pine Hill
Pine Hill Estates
Pine Hills
Pine Hollow
Pine Hollow Condo
Pine Hollow Estates
Pine Hollow Unit One
Pine Hollow Unit Two
Pine Hollow Units Three &
Pine Hollow Units Three & Four
Pine Hollow Units Tree & Four
Pine Hurst
Pine Island
Pine Island Center
Pine Island Commerical
Pine Island Lakes Townhom
Pine Island Ridge
Pine Island Ridge Section
Pine Isle
Pine Key Reserve Condo
Pine Key Resort
Pine Knoll
Pine Lake
Pine Lake Condo
Pine Lake Estates Unit 1
Pine Lake Gardens
Pine Lake Park
Pine Lake Sec 1
Pine Lake Seven Condo
Pine Lake Three Condo
Pine Lake Village Condo
Pine Lake West
Pine Lakes
Pine Lakes Country Club
Pine Lane Estates
Pine Manor
Pine Manor Mhp
Pine Manor Part Four
Pine Manor Part One
Pine Meadows
Pine Neddle Park
Pine Needles East Homes S
Pine Oaks Village No 2
Pine Point
Pine Point Estates
Pine Point Villas Cond A Thru I
Pine Point Villas Condo
Pine Ridge
Pine Ridge At Delray Beach
Pine Ridge At Delray Beach Condo
Pine Ridge At Haverhill C
Pine Ridge At Haverhill Cond
Pine Ridge At Haverhill Condo
Pine Ridge At Martin Downs Condo
Pine Ridge At Martin Downs Condo 14
Pine Ridge Club
Pine Ridge Club Subdivision
Pine Ridge Condo 02 South
Pine Ridge Crestwood
Pine Ridge Development
Pine Ridge Estates
Pine Ridge Iii Condo
Pine Ridge Iv Cond Bldg 433 Unit C-2
Pine Ridge Iv Condo
Pine Ridge Mhp
Pine Ridge North I
Pine Ridge North I Condo
Pine Ridge North Ii Condo
Pine Ridge North Village
Pine Ridge North Village Iii Condo
Pine Ridge North Village Iv Condo
Pine Ridge South
Pine Ridge South Addition
Pine Ridge South I Condo
Pine Ridge South Ii Condo
Pine Ridge South Iii Cond
Pine Ridge South Iii Condo
Pine Ridge South Iv Condo
Pine Ridge Unit 2
Pine Run
Pine Run Retirement Community
Pine Shadows Air Park
Pine Shadows Condo Ph 6
Pine Shore Sec 3
Pine Shore Sec 4
Pine Shore Sec 7
Pine Spring
Pine Springs Heights
Pine St Homesites
Pine Tower Condo
Pine Trace Acres
Pine Trace At Binks Forest
Pine Trace Third Replat
Pine Trail Sec 2
Pine Trail Sec 4
Pine Tree
Pine Tree Estates
Pine Tree Farm
Pine Tree Farms
Pine Tree Golf Club
Pine Tree Manor Sec 2
Pine Tree Park
Pine Tree Park 1st Addn
Pine Tree Park 1st Addpb
Pine Tree Park Co-Op
Pine Tree Park Legacy Home
Pine Tree Place Condo
Pine Tree Point
Pine Tree Waterway Condo
Pine Valley
Pine Valley Estates
Pine Valley Farms
Pine View Acres
Pine View Estates
Pine View Terrace
Pine Vista
Pine Wood Pk
Pineapple Grove
Pineapple Grove Village Condo
Pineapple Kelly
Pineapple Lane
Pineapple Place
Pineapple Plantation
Pineapple Plantation (Aka Pines)
Pineapple Plantation 02 & 06
Pineapple Plantation 1
Pineapple Walk 1
Pinebark Condo No 1
Pinebark Condo No 2 - Bldg 840
Pinebark Condo No 3
Pinebrook
Pinebrook Townhomes
Pinebrooke
Pinebrooke Condo L
Pinebrooke Estates
Pinecrest
Pinecrest Acres
Pinecrest Acres-Resub Of Portion
Pinecrest Cluster
Pinecrest Estates
Pinecrest Estates Unit 1
Pinecrest Golf
Pinecrest Golf Villas
Pinecrest Grove
Pinecrest Lake Estates Re
Pinecrest Lake Golf & Cc
Pinecrest Lakes
Pinecrest Lakes Ph 06
Pinecrest Lakes Ph 07
Pinecrest Mansions
Pinecrest Oaks
Pinecrest Sub Unit 2
Pinecrest Sub Unit 3
Pinecroft Condo
Pinecroft Condo All Ph
Pinedale
Pinedale Woods
Pinefield
Pinefield Meadows
Pinegrove
Pinehill Acres
Pinehurst
Pinehurst Club Condo
Pinehurst Estates
Pinehurst Gardens
Pinehurst Manor
Pinehurst Rev Pl Of Portions
Pinehurst Villa 2nd Addn
Pinehurst Village
Pinelake Garden & Estates
Pinelake Village
Pinelake Village Unrec
Pineland Crest
Pineland South
Pinelands Subdivision
Pineleigh
Pineridge
Pineridge Gardens
Pineridge Heights Delray
Pines
Pines 1
Pines 2
Pines At Cherry Hill
Pines At Dickinson Condominium
Pines At Long Neck
Pines At Woodmont Condo
Pines At Woodmont Iii Condo
Pines Condominium
Pines Of Boca Barwood Condo
Pines Of Boca Barwood I & Ii
Pines Of Boca Lago
Pines Of Boca Lago Condo
Pines Of Delray
Pines Of Delray Cond
Pines Of Delray Cond One,Two, Three,Four,Five,Six,
Pines Of Delray Condo
Pines Of Delray Condo One,Two And Three
Pines Of Delray Nort
Pines Of Delray North
Pines Of Delray North Con
Pines Of Delray North Condo
Pines Of Delray West
Pines Of Jupiter/Tequesta Condo
Pines Of Laurel
Pines Of Oakland
Pines Of Oakland Forest Two
Pines Of Oakland Forest W
Pines Of Springtree
Pines Of Wellington
Pines Of Westlake
Pines On Pennock Lane Pud
Pines On Pennock Lane Pud 2
Pines On The Severn
Pineside Condo No 1
Pineside No 2 Condo
Pinetree Estates
Pinetree Village
Pinevale
Pineview
Pinewater Farm
Pineway Towers
Pinewood
Pinewood Acre
Pinewood Condo
Pinewood Condominium
Pinewood Condos
Pinewood East
Pinewood East 2 Of Wellington
Pinewood East No 2 Of Wellington
Pinewood East Of Wellington
Pinewood Estates
Pinewood Estates Second A
Pinewood Forest
Pinewood Greens
Pinewood Grove Of Wellington
Pinewood Hill
Pinewood Lake
Pinewood Lane
Pinewood Lawns
Pinewood Of Wellington
Pinewood Park 2nd Addn Am
Pinewood Park Extension
Pinewood Park Extension 2
Pinewood Park Extn
Pinewood Park Pl Amd 2nd
Pinewood Place Resub Pt
Pinewood South
Pinewood Subdivision
Pinewood Terrace
Pinewoods
Piney Glade
Piney Glen Village
Piney Grove
Piney Grove Estates
Piney Grove Manor
Piney Island I
Piney Island Ii
Piney Mountain Corp
Piney Narrows
Piney Neck
Piney Orchard
Piney Point
Piney Ridge Village
Pinnacle
Pinnacle At Hershey Meadows
Pinnacle Place
Pintail Landing
Pintail Pointe
Pionciana Pionte Phase 2
Pioneer Estates
Pioneer Heights
Pioneer Plant Unrec Sec 2
Pioneer Plant Unrec Sec 22
Pioneer Plant Unrec Sec 28
Pioneer Plant Unrec Sec 34
Pioneer Plant Unrec Sec 36
Pioneer Plantation
Pioneer Trail Pud
Pipers Glen Pods F And H
Pipers Landing
Pipers Landing 01
Pipers Landing 02
Pipers Landing 03
Pipers Landing 04
Pipers Landing 05
Pipers Landing 06
Pipers Landing Garden Apartments Condo
Pipers Landing Garden Apts Area 09
Pipers Lndg 6
Pipers Lndg Garden 3 Clstr 1
Pipersville
Piping Rocks
Pirates Cove
Pirates Cove Condo
Piscataway
Piscataway Bay
Piscataway Estates
Piscataway Hills
Pitchford Minor 01
Pitman
Pitman Grove
Pitman Hills
Pittsburgh
Pl 20 City Of Atlantis
Pl Of Gardner Park
Pl Of Home Acres
Pl Of Little River Garden
Place Au Soleil
Place Au Soliel
Place Des Arts Condo
Place One
Placid Bay
Placid Bay Est Woodbine
Placid Bay Estates
Placid Lakes
Placid Lakes Airport
Placid Lakes Area
Placid Lakes Golf
Placid Lakes Sec 02
Placid Lakes Sec 03
Placid Lakes Sec 07 Rep
Placid Lakes Sec 07 Rplt
Placid Lakes Sec 08
Placid Lakes Sec 11
Placid Lakes Sec 13
Placid Lakes Sec 14
Placid Lakes Sec 15
Placid Lakes Sec 16
Placid Lakes Sec 16 Rplt
Placid Lakes Sec 18
Placid Lakes Sec 19
Placid Lakes Sec 20
Placid Lakes Section 2
Placid Park Land
Placid Ridge
Placid Ridge Estate
Placida
Placide
Placide Condo
Placide Lakes Sec 19
Placido Mar Condo
Placido Place
Placido Place Resub
Plainfield Park
Plainsboro
Plainview
Plainview Gardens Sub
Plant Key Colony
Plantation
Plantation Acres
Plantation Acres Estates
Plantation Acres/ Alridge
Plantation At Sewalls Point
Plantation Bay
Plantation Beach
Plantation Beach Park
Plantation Business Park
Plantation By The Sea
Plantation Club A Condo
Plantation Club B Condo
Plantation Club C Condo
Plantation Club D Condo
Plantation Club Villas Condo
Plantation Club Villas Irp
Plantation Colony
Plantation Estates
Plantation Forest
Plantation Forest Condo
Plantation Gardens 1st Se
Plantation Gardens 2nd Sec
Plantation Gardens 3rd Se
Plantation Gardens 4th Se
Plantation Gardens Sec 5
Plantation Golf Estates
Plantation Golf Estates 1st Add
Plantation Golf Estates 2
Plantation Harbor Fourth
Plantation Harbor Fourth Add
Plantation Hills Sec 2
Plantation House Condo
Plantation Island
Plantation Isles Sec 5
Plantation Isles Sec Two
Plantation Key Colony
Plantation Key Colony 1st
Plantation Key Colony Rev
Plantation Lakes
Plantation Manors-Resub
Plantation Park
Plantation Park 4th Add
Plantation Park 8 Add
Plantation Park Fifth Add
Plantation Park Lakesites
Plantation Park Seventh Add
Plantation Park Third Add
Plantation Pines Condo
Plantation Pines Phase 1
Plantation Pines Phase 1 Condo
Plantation Place Condo
Plantation Point Re Amend
Plantation Racquet Club
Plantation Royal Section
Plantation Second Sec Ame
Plantation Sunrise Height
Plantation Sunrise Heights 2nd
Plantation Sunrise Heights 3rd
Plantation Terrace
Plantation Terrace Condo
Plantation Tropical Park
Plantations
Plantations At Carrico Knolls
Plantations East
Plantations Secluded Gard
Plantations Secluded Garde
Plantations Secluded Gardens
Plat No 1 Opa Locka
Plat No 2 Of Hillcrest Subdivision
Plat Of Anacris
Plat Of Indrio Unit 1
Plat Of Inlet View Sub
Plat Of Sawgrass Commons
Plat Of Sec 5 Twp 52 Rge
Plat Of Wauregan
Platina / Alexandra Village
Platina / Bellavista Village
Platina / Bellavista Village Condo
Platina / Carrara Village Condo
Platina / Diamante Village
Platina / Festivita Village
Platina Excellente Village A,B,C,D,F, & G Condo
Platina- Alexandra Village Condo
Platina/Alexandra Village Condo
Platina/Lucente Village A & B Condo
Platinum Condo
Platts Acres
Platts Bluff Ranches
Playa Bonita
Playa Caleta
Playa Coral
Playa Del Carmen Mexico
Playa Del Mar
Playa Del Mar Condo
Playa Del Sol
Playa Del Sol Condo
Playa Las Ballenas
Players Place
Playland Estates Sec 1
Playland Estates Sec 2
Playland Isles
Playland Park
Playland Village Sec 2
Playland Village Sec 3
Playland Village Sec 4
Plaza 15 Condo
Plaza At Oceanside
Plaza At Oceanside (The)
Plaza At Oceanside (The) Condo
Plaza Condo
Plaza East
Plaza East Condo
Plaza Estates 2nd Sec
Plaza Estates 3rd Sec 48-
Plaza Grande
Plaza Of Americas Condo
Plaza Of Americas Condo P
Plaza Of Americas Condo Part 4
Plaza Of The Palm Beaches Condo
Plaza Of Westland Condo
Plaza South
Plaza South Condo
Plaza Towers
Plaza Towers North Condo
Plaza Towers South Condo
Pleasant Acres
Pleasant City
Pleasant City Up To Date
Pleasant Cove
Pleasant Fields
Pleasant Gap
Pleasant Grove
Pleasant Heights
Pleasant Hill
Pleasant Hills
Pleasant Hills Tr
Pleasant Knolls
Pleasant Lakes
Pleasant Ridge
Pleasant Valley
Pleasant Valley Esta
Pleasant Valley Estates
Pleasant View
Pleasant View Gardens
Pleasant Village
Pleasant Village Sub
Pleasantdale
Pleasanton
Pleasanton Acres
Pleasantville
Pleasantville City
Pleasure Vlg Sec 1
Pleasureville
Plesant Valley Estat
Plover Point
Plow Point Acres
Plum At Boca Pointe
Plum At Boca Pointe Condos One Thru 15 Filed In Or
Plum Point
Plum Point Woods
Plum Ridge Estates
Plum Run
Plum Tree Estates
Plumosa Park Riv Bch
Plumosa Park Sec A, B & D In
Plumosa Park Sec A, B And D
Plumsted
Plumtree Estates
Plunkett Condo Apts Inc C
Plyers Mill Estates
Plymouth
Plymouth 4 Condo
Plymouth At Century Villa
Plymouth At Century Villag
Plymouth At Century Village
Plymouth Condos A To F
Plymouth Gardens
Plymouth Haven
Plymouth Hill
Plymouth Hills
Plymouth Meeting
Plymouth Park
Plymouth Valley
Pocahontas
Pocono
Pocono Country Place
Pocono Farms
Pocono Farms East
Pocono Laurel Lake
Pocono Manor
Pocono Mountain Campsites
Pocono Mtn Lake Carbon Co
Pocono Ranchettes
Pocono Ranchlands
Pocono Spring
Pocopson Creek
Pod 1 At Monarch Lakes
Pod 10 At Monarch Lakes
Pod 11 Pud At The Reserve Willow Pines E At Pga Vi
Pod 12 At Monarch Lakes
Pod 14 At Monarch Lakes
Pod 19 Pud Ii Greenbrier
Pod 2 At Monarch Lakes
Pod 20c Pud Ll At The Reserve - Castle Pines
Pod 25 At The Reserve
Pod 26 At The Reserve Phase 1 Cypress Point
Pod 28 At The Reserve
Pod 3 At Monarch Lakes
Pod 33 At The Reserve Phase 1 Kingsmill
Pod 7 At Monarch Lakes
Pod 7b At The Reserve Torrey Pines
Pod 7b At The Reserve, Pud I - Torrey Pines
Pod 8 At Monarch Lakes
Pod 9 At Monarch Lakes
Poets Colony
Poets Corner
Pohatcong Twp
Pohick Square
Pohick Village
Poinciana
Poinciana - Norfolk
Poinciana 10 Pine Island
Poinciana 11 Pine Island Ridge
Poinciana 12a Pine Island
Poinciana 14 Pine Island Ridge
Poinciana 2 Of Pine Islan
Poinciana 2 Of Pine Island Ridge
Poinciana 5 Of Pine Island Ridge
Poinciana 6 Of Pine Island Ridge
Poinciana 7 Of Pine Islan
Poinciana 8 Of Pine Island Ridge
Poinciana 9 Pine Island Ridge
Poinciana At Chestnut Ran
Poinciana At Miami Condo
Poinciana At Sunset
Poinciana At Sunset Lakes
Poinciana Condo
Poinciana Estates Sec 1
Poinciana Gardens
Poinciana Gardens Condo
Poinciana Gardens Sec 01
Poinciana Heights Delray
Poinciana Is Yt & Rcq Clu
Poinciana Is Yt & Rcq Club Condo
Poinciana Lakes Condo
Poinciana Lakes Villas Co
Poinciana Nbrhd 03 South V
Poinciana Nbrhd 2 Vill 8
Poinciana Nbrhd 2 W Vill 7
Poinciana Nbrhd 2 West Vil
Poinciana Nbrhd 2 West Vill 7
Poinciana Nbrhd 4 Vill 7
Poinciana Nbrhd 5 North Vill 3
Poinciana Neighborhood 4 V
Poinciana Park
Poinciana Place Condo
Poinciana Place Condo 1,2
Poinciana Place Condo 1,2,8 And 9
Poinciana Place Condo A,B
Poinciana Place Condo A,B And C
Poinciana Place Ph Ii-A
Poinciana Place Villas Condo
Poinciana Pointe Phase 1
Poinciana Pointe Phase 2
Poinciana Royale Villas C
Poinciana Royale Villas Condo Ii
Poinciana Sub Nbrhd 4 Vlg
Poinciana Sub Nbrhd 5 Nort
Poinciana Vlg 1 Nbhd 1 South
Poinciana Vlg 2 Nbhd 3
Poinciana Vlg 5 Nbhd 1
Poinciana Yacht & Racquet Club
Poinciana-By-The-Sea Condo
Poincianna Manor Sec 2
Poinsetta Park
Poinsettia Heights
Poinsettia Heights River Add
Poinsettia Landings Condo
Point At Delray Condo
Point Bay North Condo
Point Blackistone
Point Breeze
Point East One Condo-Bldg
Point East One Condo-Bldg C
Point East Sec 3 Condo
Point East Sec 4 Condo
Point East Sec Ii Condo
Point East Sec Ii Condomi
Point East Sec Ii Condominium
Point East Sec Iii Condo
Point East Sec Iii Condom
Point Farm
Point Landing
Point Manalapan 01
Point Manalapan 1
Point Manalapan 10
Point Manalapan 11
Point Manalapan 9
Point Manalapan/Hypoluxo Island
Point O'Woods
Point Of Americas
Point Of Americas Condo
Point Of Americas Ii
Point Of Americas Phase Ii Condo
Point Of Woods
Point Of Woods East
Point Pleasant Amd
Point Royale Bldgs 3 & 4
Point Royale Buildings On
Point Royale Duplex Condo
Point Royale Sec 1
Point South Condo
Point View Estates
Pointe @ Middle River
Pointe @ Pompano Beach Co
Pointe @ Pompano Beach Condo
Pointe Alexis North Phase
Pointe At Park Center
Pointe Midtown
Pointe Of Woods Pud
Pointe Overlook Condo
Pointe West Central Village Phase Ii Pd
Pointe West Central Village Phase Iii Pd
Pointe West Central Village Phase Iv
Pointe West East Village Phase 2b
Pointe West North Village Phase Iii Pd
Pointe West South Village Phase I Pd
Pointer Ridge
Pointer Ridge At Collington
Poland Hill
Polktown
Polo Club
Polo Club / Ville De Capri
Polo Club Estates
Polo Fields
Polo Fields 1
Polo Island Condo
Polo Island Of Palm Beach Polo And Country Club We
Polo Legacy Condo
Polo Legacy Mxpd
Polo Legacy/Saddlewood
Polo Trace 2 1
Polo Trace 2 Pl 4
Polo Trace 2 Pud Plat No
Polynesian Gardens
Polynesian Gardens 5 Cond
Polynesian Gardens Condom
Polynesian Gardens Condominium
Polynesian Villas
Polynesian Villas Condominium
Pomelo Park
Pomeroy Manor
Pomona
Pompana Beach Club Condo
Pompano Aegean
Pompano Aegean Condo
Pompano Atlantis Condo
Pompano Bch Community
Pompano Beach
Pompano Beach Club Condo
Pompano Beach Club North Condo
Pompano Beach Club South
Pompano Beach Estates
Pompano Beach Highlands
Pompano Beach Highlands 2
Pompano Beach Highlands 2nd Sec
Pompano Beach Highlands 3
Pompano Beach Highlands 3rd Sec
Pompano Beach Highlands 4
Pompano Beach Highlands 4th Sec
Pompano Beach Highlands 5th Sec
Pompano Beach Highlands 6th Sec
Pompano Beach Highlands 7
Pompano Beach Highlands 7th Sec
Pompano Beach Highlands 8
Pompano Beach Highlands 8th Sec
Pompano Beach Highlands-Replat
Pompano Beach Morang & Pa
Pompano Beach Morang & Par
Pompano Beach Park
Pompano Beach View Condo
Pompano By The Sea
Pompano By The Sea Resub
Pompano Courts Condo
Pompano Farms
Pompano Golf Estates 1st
Pompano Highlands
Pompano Isles
Pompano Isles Sec
Pompano Lodge Co-Op
Pompano Park
Pompano Place Condo
Pompano Shores Sec
Pompano Springs Replat
Pompano Surf Club Co-Op
Pompano Terrace
Pompano Waterway Estates
Pompano Waterway Estates 1st Add
Pompano Yacht & Beach Club Condo
Pompano Yacht& Beach Club
Ponce Estates Sec 2
Ponce Road Estates
Pond Acres
Pond Apple Place Ii Condo
Pond Apple Place Iii Cond
Pond Apple Place Iii Condo
Pond Apple Place Iv
Pond Apple Place Iv-B Condo
Pond Apple Village Condo
Pond Condominiums
Pond Ridge Villas East Condo
Pond View
Pond View Estates
Ponder Cove
Ponder Cove Beach
Ponderosa
Ponderosa Estates
Ponderosa Phase 2
Ponderosa Ranches Unrecorded
Ponds Edge
Ponds Of Odessa
Pondview
Pondview Estates
Ponte Vecchio
Ponte Vecchio / Tuscany
Ponte Vecchio West
Ponte Verde
Pony Pines Unit 1
Pool Ridge
Poolesville
Poolesville Outside
Popkins Heights
Poplar
Poplar Acres
Poplar Estates
Poplar Grove
Poplar Heights
Poplar Hill
Poplar Hills
Poplar Neck Woods
Poplar Ridge
Poplar Run
Poplar Woods
Poppleton
Poppleton Creek
Poppleton Creek Area
Poppleton Creek Condo
Poppleton Creek Estates
Por La Mar
Por Labelle Unit 8
Porsche
Port St Lucie Section 46
Port Antigua Plat No 2
Port Antigua Plat No 3 &
Port Antigua Plat No 5 &
Port Aquia
Port Carbon
Port Chalotte Sec 19
Port Charloete Sub 28
Port Charlotte
Port Charlotte 48
Port Charlotte 52
Port Charlotte 55
Port Charlotte 56
Port Charlotte 57
Port Charlotte 59
Port Charlotte 61
Port Charlotte Ph 50
Port Charlotte Sec 006
Port Charlotte Sec 014
Port Charlotte Sec 015
Port Charlotte Sec 021
Port Charlotte Sec 024
Port Charlotte Sec 037
Port Charlotte Sec 038
Port Charlotte Sec 044
Port Charlotte Sec 045
Port Charlotte Sec 047
Port Charlotte Sec 048
Port Charlotte Sec 050
Port Charlotte Sec 051
Port Charlotte Sec 058
Port Charlotte Sec 059
Port Charlotte Sec 060
Port Charlotte Sec 063
Port Charlotte Sec 067
Port Charlotte Sec 081
Port Charlotte Sec 10
Port Charlotte Sec 12
Port Charlotte Sec 13
Port Charlotte Sec 14
Port Charlotte Sec 17
Port Charlotte Sec 19
Port Charlotte Sec 20
Port Charlotte Sec 23
Port Charlotte Sec 24
Port Charlotte Sec 26
Port Charlotte Sec 27
Port Charlotte Sec 29
Port Charlotte Sec 30
Port Charlotte Sec 31
Port Charlotte Sec 32
Port Charlotte Sec 33
Port Charlotte Sec 34
Port Charlotte Sec 37
Port Charlotte Sec 38
Port Charlotte Sec 40
Port Charlotte Sec 41
Port Charlotte Sec 43
Port Charlotte Sec 45
Port Charlotte Sec 47
Port Charlotte Sec 48
Port Charlotte Sec 49
Port Charlotte Sec 50
Port Charlotte Sec 51
Port Charlotte Sec 55
Port Charlotte Sec 56
Port Charlotte Sec 57
Port Charlotte Sec 58
Port Charlotte Sec 59
Port Charlotte Sec 60
Port Charlotte Sec 61
Port Charlotte Sec 62
Port Charlotte Sec 63
Port Charlotte Sec 64
Port Charlotte Sec 65
Port Charlotte Sec 67
Port Charlotte Sec 7
Port Charlotte Sec 71
Port Charlotte Sec 74
Port Charlotte Sec 78
Port Charlotte Sec 79
Port Charlotte Sec 8
Port Charlotte Sec 82
Port Charlotte Sec 85
Port Charlotte Sec 87
Port Charlotte Sec 93
Port Charlotte Sec 94
Port Charlotte Sec 94 1
Port Charlotte Sec 95
Port Charlotte Sec.44
Port Charlotte Sec49
Port Charlotte Sec52
Port Charlotte Sec53 Blk17
Port Charlotte Sec59 Blk29
Port Charlotte Sec8
Port Charlotte Section 13
Port Charlotte Section 58
Port Charlotte Section 59
Port Charlotte Section 87
Port Charlotte Sub
Port Charlotte Sub 06
Port Charlotte Sub 07
Port Charlotte Sub 08
Port Charlotte Sub 09
Port Charlotte Sub 12
Port Charlotte Sub 17
Port Charlotte Sub 17 Replat
Port Charlotte Sub 18
Port Charlotte Sub 19
Port Charlotte Sub 20
Port Charlotte Sub 21
Port Charlotte Sub 22
Port Charlotte Sub 24
Port Charlotte Sub 25
Port Charlotte Sub 26
Port Charlotte Sub 27
Port Charlotte Sub 29
Port Charlotte Sub 30
Port Charlotte Sub 32
Port Charlotte Sub 33
Port Charlotte Sub 36
Port Charlotte Sub 41
Port Charlotte Sub 44
Port Charlotte Sub 45
Port Charlotte Sub 46
Port Charlotte Sub 47
Port Charlotte Sub 48
Port Charlotte Sub 49
Port Charlotte Sub 51
Port Charlotte Subdivision
Port Chartlotte Sec 093
Port Condo
Port Condominium
Port D'Andratx, Mallorca,
Port De Mer
Port De Mer Condo
Port Deposit
Port Elizabeth
Port Indian
Port La Belle
Port La Belle Unit 8
Port Labelle
Port Labelle - Units 1-9
Port Labelle Community Dev
Port Labelle Un 102
Port Labelle Uni 8
Port Labelle Unit 10
Port Labelle Unit 11
Port Labelle Unit 12
Port Labelle Unit 13
Port Labelle Unit 6
Port Labelle Unit 7
Port Labelle Unit 8
Port Labelle Unit 9
Port Labelle Units 1-9
Port Labelle- Unit 11
Port Largo
Port Largo 3rd Add
Port Largo 5th Add
Port Malabar
Port Malabar Country Club Unit 4
Port Malabar Unit 10
Port Malabar Unit 11
Port Malabar Unit 12
Port Malabar Unit 13
Port Malabar Unit 14
Port Malabar Unit 15
Port Malabar Unit 16
Port Malabar Unit 17
Port Malabar Unit 18
Port Malabar Unit 19
Port Malabar Unit 2
Port Malabar Unit 20
Port Malabar Unit 21, 1st
Port Malabar Unit 21, 1st Replat Of
Port Malabar Unit 23
Port Malabar Unit 25
Port Malabar Unit 26
Port Malabar Unit 30
Port Malabar Unit 31
Port Malabar Unit 32
Port Malabar Unit 36
Port Malabar Unit 37
Port Malabar Unit 39
Port Malabar Unit 41
Port Malabar Unit 42
Port Malabar Unit 44
Port Malabar Unit 45
Port Malabar Unit 46
Port Malabar Unit 48
Port Malabar Unit 49
Port Malabar Unit 5
Port Malabar Unit 50
Port Malabar Unit 51
Port Malabar Unit 52
Port Malabar Unit 53
Port Malabar Unit 6
Port Malabar Unit 7
Port Malabar Unit 8
Port Malabar Unit 9
Port Marina Condo
Port Matilda
Port Norris
Port O Dumfries
Port Of The Islands Ph 1
Port Pine Heights 2nd Add
Port Potomac
Port Republic
Port Richmond
Port Royal
Port Royal Condominium
Port Royal Landing
Port Royale
Port Saint Lucie
Port Salerno
Port Salerno Estates
Port Salerno Village
Port Sewall
Port Sewall Harbor & Tenn
Port Sewall Harbor & Tennis Club
Port St John Un 8
Port St Lucie
Port St Lucie Floresta Pines
Port St Lucie Floresta Pines Unit 2
Port St Lucie Floresta Pines Unit 3
Port St Lucie Sec 01
Port St Lucie Sec 02
Port St Lucie Sec 03
Port St Lucie Sec 04
Port St Lucie Sec 05
Port St Lucie Sec 06
Port St Lucie Sec 07
Port St Lucie Sec 09
Port St Lucie Sec 10
Port St Lucie Sec 12
Port St Lucie Sec 16
Port St Lucie Sec 18
Port St Lucie Sec 19
Port St Lucie Sec 20
Port St Lucie Sec 22
Port St Lucie Sec 26
Port St Lucie Sec 29
Port St Lucie Sec 31
Port St Lucie Sec 33
Port St Lucie Sec 34
Port St Lucie Sec 35
Port St Lucie Sec 40
Port St Lucie Sec 43
Port St Lucie Sec 44
Port St Lucie Sec 46 Rep 01
Port St Lucie Sectio
Port St Lucie Section 22
Port St Lucie Section 31
Port St Lucie Section 34
Port St Lucie Section 1
Port St Lucie Section 10
Port St Lucie Section 11
Port St Lucie Section 12
Port St Lucie Section 13
Port St Lucie Section 14
Port St Lucie Section 15
Port St Lucie Section 16
Port St Lucie Section 17
Port St Lucie Section 18
Port St Lucie Section 19
Port St Lucie Section 2
Port St Lucie Section 20
Port St Lucie Section 21
Port St Lucie Section 23
Port St Lucie Section 24
Port St Lucie Section 25
Port St Lucie Section 26
Port St Lucie Section 27
Port St Lucie Section 28
Port St Lucie Section 29
Port St Lucie Section 3
Port St Lucie Section 30
Port St Lucie Section 32
Port St Lucie Section 33
Port St Lucie Section 34
Port St Lucie Section 35
Port St Lucie Section 36
Port St Lucie Section 37
Port St Lucie Section 39
Port St Lucie Section 4
Port St Lucie Section 40
Port St Lucie Section 41
Port St Lucie Section 42 1st Replat
Port St Lucie Section 43
Port St Lucie Section 44
Port St Lucie Section 45
Port St Lucie Section 46
Port St Lucie Section 46 1st Replat
Port St Lucie Section 47
Port St Lucie Section 48
Port St Lucie Section 48 1st Replat
Port St Lucie Section 49
Port St Lucie Section 5
Port St Lucie Section 50
Port St Lucie Section 52
Port St Lucie Section 53
Port St Lucie Section 6
Port St Lucie Section 7
Port St Lucie Section 8
Port St Lucie Section 9
Port St Lucie-Sec 22
Port St Lucie-Section 08
Port St Lucie-Section 11
Port St Lucie-Section 25
Port St Lucie-Section 33
Port St Lucie-Section 48
Port St Lucie-Section 48 First Replat
Port St. Lucie
Port St. Lucie Section 17
Port Tobacco
Port Tobacco Riv Sub
Port Tobacco Riviera
Port Trevorton
Porta Bella
Porta Bella East
Porta Bella East And Port
Porta Bella East And Porta Bella Southwest Condo
Porta Bella East And Porta Bella Southwest Condo A
Porta Bella South
Porta Bella West
Porta Bella Yacht And Tennis Club
Portalagre Building Condo
Porter Manor
Portico
Portner House
Porto Bellagio
Porto Bellagio Condo
Porto Fino Gardens Condo
Porto Vecchio
Porto Vita North
Portobago Bay
Portobello Di Gallura
Portobello Estates
Portofino
Portofino At Jensen Beach Condo
Portofino Bay
Portofino Condominium
Portofino Condominium Sec
Portofino Condominium Sect
Portofino Condominium Section 2
Portofino Estates
Portofino Lakes
Portofino North
Portofino Oaks
Portofino Of Ocean Ridge Condo
Portofino On The Intracoastal
Portofino Palms
Portofino Pointe
Portofino Shores
Portofino Shores Phase Three
Portofino Shores Phase Two
Portofino South Condo Estates Of South Palm Bea
Portofino Tower Condo
Portofino Village 1-A Condo
Portofino Village 1-B Condo
Portofino Village 1-C Condo
Portofino Village 1-E Condo
Portofino Village 2-B Condo
Portofino Village 2-C Condo
Portofino Village 2-E Condo
Portofino Villas West
Portofino Vista
Portosol
Portosol Repl No 2
Portosol Repl No 3
Ports O Call
Ports O Call Condo S A, B
Ports O Call Condo S A, B, C And D
Portside Yacht Club
Portside Yacht Club Condo
Portsview @ The Waterways
Portugal Towers Condo
Porvenir Plat 1
Positano Beach
Positano Townhouses
Possum Point
Pot Spring
Potnets Bayside
Potnets Coveside
Potnets Creekside
Potnets Dockside
Potnets Lakeside
Potnets Seaside
Potomac
Potomac Yards
Potomac Chase
Potomac Church Farms
Potomac Club
Potomac Club Condominiums
Potomac Club Ii
Potomac Crest
Potomac Crossing
Potomac Dist
Potomac District
Potomac Fairways
Potomac Falls
Potomac Glen
Potomac Green
Potomac Green By Del Webb
Potomac Green Condominium
Potomac Greens
Potomac Grove
Potomac Heights
Potomac Heights Sub
Potomac Highland Farm
Potomac Highlands
Potomac Hills
Potomac Knolls
Potomac Lakes
Potomac Landing
Potomac Manor
Potomac Meadows
Potomac Mills
Potomac Oaks
Potomac Outside
Potomac Overlook
Potomac Overlook At National Harbor
Potomac Overlook Condo
Potomac Overlook Estates
Potomac Park
Potomac Park Estates
Potomac Pointe Condomini
Potomac Renaissance
Potomac Renaissance Condos
Potomac Ridge
Potomac Ridge At Leisure
Potomac Ridge Estates
Potomac Sands
Potomac Shores
Potomac Square
Potomac Station
Potomac Station Marketplace
Potomac Terrace
Potomac Valley Farms
Potomac Valley Overlook
Potomac Valley Vista
Potomac Village
Potomac Vistas
Potomac Woods
Potomac Woods Ind Head
Potomac Yard
Potowmack Crossing
Potr Charlotte Sec 058
Potter County
Potter Road
Potterfield Gdn Ac
Potters Glen
Potts
Pottsgrove Hunt
Pottsgrove Manor
Pottstown
Pottstown Landing
Pottsville
Potvin Plat
Povoa Gardens Sec 1
Powder Mill
Powell
Powells Landing
Powells Mills
Powells Run Village
Powells Run Village Cond
Powelton Village
Powhatan At Potomac Yard
Pradera Of Via Verde Ph 1 Replat
Praderas Del Faralln
Prado Condo
Prado De Somosaguas
Prairie
Pramar
Pramar Sub
Prancing Horse Far
Pratt Monroe
Precious Homes At Lakes B
Precious Homes At Lakes By
Precious Homes At Lakes By Bay
Precious Homes At Twin La
Prentiss Point
Prentiss Point Ii
Prentiss Point Ii Townhomes
Pres At Panther Creek 3e
Prescott A Condo
Prescott B Condo
Prescott C Condo
Prescott D Condo
Prescott Estates
Prescott F
Prescott I Condo
Prescott L Condo
Prescott M Condo
Prescott O Condo
Preser Robinson Farm
Preservatinniscrgolf
Preservation Pointes Phase Ii
Preserve
Preserve 01-03
Preserve At Avery Lakes
Preserve At Avery Lakes (
Preserve At Bow Creek
Preserve At Chapel Trail
Preserve At Crestwood
Preserve At Deep Crk
Preserve At Emerald Hills
Preserve At Goose Creek
Preserve At Irons Landing
Preserve At Jefferson Creek
Preserve At Juno Beach
Preserve At Little
Preserve At Maple Glen
Preserve At Marsh Creek - Heritage Collection
Preserve At Pine Ridge
Preserve At Providence
Preserve At Robinson Farms
Preserve At Rock Creek
Preserve At Scotts Run
Preserve At Stonehill Farm
Preserve At Walnut Creek
Preserve At Waterway Village Pd - Pod X
Preserve At Weatherby
Preserve At Windlass Run
Preserve Estates
Preserve On The Broadkill
Preserve/Pk Trace Pud
President Co-Op
President Country Club
President Country Club 4
President Country Club Pl 1
President's Court
Presidential Corners Cond
Presidential Cove
Presidential Estates Sub
Presidential Ests
Presidential Golfview
Presidential Golfview Con
Presidential Golfview Cond Decl Filed 5-16-81
Presidential Golfview Condo
Presidential Lakes
Presidential Park
Presidential Place Condo
Presidential Towers
Presidents Pointe
Presidntial Lake
Presley Manor
Prestige Apts Inc Co-Op
Prestige Manor
Preston At Century Villag
Preston At Century Village
Preston At Century Village Condo
Preston At Pga National
Preston Court
Preston Lake
Preston Manor
Preston Pointe
Preston Square
Prestwick
Prestwick Chase
Prestwick Chase At Pga National
Prestwick Ests
Prestwick Villas
Price Lake Unrec On
Prices Addn To St James P
Prichard Farms
Pricneton Windrows
Priestford Hills
Primavera 1st Addn
Primavera Estates (Lake Front)
Primehook Beach
Primos Secane
Primrose
Primrose Gate
Primrose Park At Wildewood
Prince George
Prince George Arms Condo
Prince Georges Internati
Prince Georges Place
Prince Place 1
Prince Place Iii
Prince William
Prince William Commons
Prince William County
Prince William County Center
Prince William Estates
Princenton
Princeon Landing
Princess
Princess Of Hutchinson Island
Princess Park Manor
Princeton
Princeton Collection
Princeton Collecton
Princeton Commons
Princeton Commons Pb
Princeton Crossing
Princeton East
Princeton Estates
Princeton Gate
Princeton Highlands
Princeton Ivy Ests
Princeton Landing
Princeton Manor
Princeton Meadows
Princeton Oaks
Princeton Place At Gables End
Princeton Ridge
Princeton Ridings
Princeton Shoals
Princeton Square
Princeton Square Additio
Princeton Village
Princeton Walk
Princeton Windrows
Princeton Woods
Princetonian By The Park
Princetonian Sub Sec 2
Princetonian Townhomes
Princetonian West
Prinland Heights
Prio Ests
Priors 1st Addn To Biscay
Priors 2nd Addn To Biscayne Park
Pritchard Park
Private Colony
Prive Condo
Progress
Progress Ridge
Progressive Park 2
Progresso
Progresso 2-18 D
Progresso Am Plat Of Blks C-D-E
Progresso Resub
Promenade At Boca Pointe
Promenade At Boca Pointe Condos 1,2 And 3 In Or413
Promenade At Kendale Lake
Promenade At Kendale Lakes
Promenade At Tradition
Promenade At Tradition No I, A Condominium
Promenade On Broad Creek
Promenade Shores At Doral
Promenade Towers
Promontory Oaks
Properties Of Hope
Prophecy
Prospect Bay
Prospect Gardens
Prospect Gardens 22-26 B
Prospect Heights
Prospect Hills
Prospect House
Prospect Knolls
Prospect Park
Prospect Park South
Prospect View
Prospect Woods
Prospectville
Prosper Park Amen
Prosper Pointe
Prosperity Harbor North
Prosperity Park
Prosperity Village Cottage Homes
Provenance
Provence Bay Sub
Provence Condo
Providence
Providence Corner
Providence Crossing
Providence Forge
Providence Park
Providence Place
Providence Square
Providence View
Provincia Del Chubut
Proyecto Villa Real
Psl Block 40
Psl Sec 6
Pt Bethesda Out Res 1
Pt Bethesda Out Res 2
Pt Labelle
Pt Labelle Unit 1
Pt Labelle Unit 3
Pt Labelle Unit 4
Pt Olney Out Res 2
Pt Olney Out Res 3
Pt Par S North Lauderdale
Pt Rockville Out Res 3
Pt Rockville Twn Res 1
Pt Wheaton Out
Ptincess Anne
Ptm1 Putnam Manor
Pueblo Bavaro
Pueblo Del Sol Sec 6
Puente De Piedra Y Tacares
Puerta De Palmas Condo
Puerta Del Sol
Puerta Del Sol Condo
Puerto Bello Condo No 2
Puerto Del Rio Condo Ph 1c
Puertocolombia
Pullach Im Isartal
Pulliam
Pulte At Tradition Phase 1
Punta Aguila
Punta Bonita, Las Terrenas
Punta Cana
Punta Cana Village
Punta Espada
Punta Gorda
Punta Gorda Acres
Punta Gorda Hgts
Punta Gorda Isles
Punta Gorda Isles Sec 14
Punta Gorda Isles Sec 20
Punta Gorda Isles Sec 23
Punta Minitas
Purcellville
Purcellville Ridge
Purnell Crossing
Purple Sage
Putnam Farm Estates
Putnam Manor
Putnam Manor Sub
Putnam Monor
Putnam Vil
Putneys E D Sub
Pyles & Welches
Q Club Resort & Residence
Q Club Resort & Residences Condo
Quadomain Tower I And Iv
Quadomain Tower I And Iv Condo
Quadrille
Quadro Condo
Quadro Condos
Quadro Residences
Quail Acres
Quail Crossing
Quail Hill
Quail Hill Estates
Quail Hollow
Quail Hollow Condo
Quail Hollow Pines
Quail Meadow At Martin Do
Quail Meadow At Martin Downs (Aka Martin Downs Pla
Quail Meadow M D 05
Quail Meadows
Quail Meadows Townhouses
Quail Overlook
Quail Ridge
Quail Ridge - Sandpiper
Quail Ridge Condo 3a
Quail Ridge Condo 8
Quail Ridge Patio Homes
Quail Roost Sub
Quail Run
Quail Run Condo One
Quail Run Condos
Quail Run Of Sunrise
Quail Run South
Quail Run Village (Pattio Rizzo Plaza)
Quail Valley
Quail Valley Golf Course
Quailwood
Quailwood Sub - La Plata
Quaint Acres
Quaint Hills Mountain Section
Quaker Estates
Quaker Hill
Quaker Hill Condominium
Quaker Hills
Quaker Ridge
Quaker Woods
Quakertown
Quakertown East
Quakerview Mhp
Quantico
Quantrell Mews
Quantum On The Bay Condo
Quantum On The Bay Condo No 1
Quantum On The Bay Condo North
Quantum Park Townhomes
Quarry Place
Quarry Springs
Quarryville Borough
Quarter Branch
Quarterdeck Condominium
Quartz District
Quatraine At Jacaranda Ga
Quatraine At Jacaranda Gardens
Quatraine Condo I Ph I
Quatraine Condo Iii
Quatraine Condo Iv
Quatrine Condo Ii Ph Iii
Queen Anne
Queen Anne Acres
Queen Anne Colony
Queen Anne Village
Queen Anne Woods
Queen Village
Queen's Cove Unit 1
Queen's Mill Of Salem Station
Queens Chapel Manor
Queens Cove House Condo
Queens Landing
Queens Park
Queens Park Unrec
Queens Wood
Queensbrooke Plat 2
Queensdale
Queensland
Queenstown
Quentin Hunt
Quiet Acres
Quiet Acres Mhp
Quiet Valley Estates
Quillens Point
Quince Haven
Quince Orchard Estates
Quince Orchard Knolls
Quince Orchard Park
Quincy
Quincy Twp
Quinn Estates
Quinn's Landing
Quinta En Cdad. Colon
Quirch Sub
Quito Sector San Gabriel
Quito Tennis
R J Clark Manor
R Y K Homesites
Rabbit Hill Estates
Rabbit Run
Race Street
Racewood
Racquet Club
Racquet Club Apartments A
Racquet Club Apartments At
Racquet Club Apts
Racquet Club Apts At Bona
Racquet Club Apts At Bonav
Racquet Club Apts At Bonaventure
Racquet Club Of Deer Creek
Racquet Club Of Kendale L
Racquet Club Village Apar
Radcliffe
Radcliffe Court
Radcliffe Manor
Rader Add To Belle Glade
Raders Sub
Raders Sub 3
Radford
Radiant Valley
Radio Heights
Radio Pk Amd
Radius Condo
Radius Condominium
Radix Village
Radley Run Mews
Radnor - Fort Myer Heights
Radnor Green
Radnor House
Radnor Hunt
Radnor Winston
Raes Cuda Canal Subd
Ragged Point
Ragged Point Beach
Raibow Lakes Estate
Raibow Lakes Estates
Railroad Addn
Railroad Shops Inter Scho
Railway Shops Addn
Railway Shops Addn 1st Ad
Railway Shops Addn 2nd Am
Railway Shops Addn 2nd Amd
Railway Shops Addn Amd
Rainberry 4
Rainberry Bay
Rainberry Bay - Rainberry Estates
Rainberry Bay Sec 1
Rainberry Bay Sec 1 As
Rainberry Bay Sec 1-A
Rainberry Bay Sec 10
Rainberry Bay Sec 2
Rainberry Bay Sec 3
Rainberry Bay Sec 5
Rainberry Bay Sec 6
Rainberry Bay Sec 7
Rainberry Bay Sec 8
Rainberry Bay Sec 9
Rainberry Estates
Rainberry Lake
Rainberry Lake Ph Iii-A
Rainberry Lake Ph Iii-B
Rainberry Lake Ph Iv-A
Rainberry Lake Ph Iv-B
Rainbow Acres
Rainbow Acres Unit 1
Rainbow Gardens
Rainbow Lake Estates
Rainbow Lakes
Rainbow Lakes Estate
Rainbow Lakes Estate Sec A
Rainbow Lakes Estates
Rainbow Lakes Estates Sec
Rainbow Lakes Estates Sec A
Rainbow Lakes Estates Sec D
Rainbow Lakes Estates Sec E
Rainbow Lakes Estates Sec G
Rainbow Lakes Estates Sec J
Rainbow Lakes Estates Sec K
Rainbow Lakes Estates Sec L
Rainbow Lakes Estates Sec N
Rainbow Lakes Estates Sec O Resub
Rainbow Lakes Estates Secm
Rainbow Lakes Estatessec F
Rainbow Lakes Estatessec N
Rainbow Lakes Tr A
Rainbow Lakes Villas
Rainbow Miramar
Rainbow Park
Rainbow Park Un 04
Rainbow Park Un 08
Rainbow Park Unit 2
Rainbow Park Vac
Rainbow Springs Village
Rainflower
Rainflower/Loveton
Rains
Raintree
Raintree At Mayfair
Raintree Forest (Unrecord
Raintree Forest Condo
Raintree Lake Sec 2
Raintree Village
Rainwood
Ralph B Fry
Ralston
Ramas Of Kendall
Ramblas Via Ventura
Ramblebrook Ii
Rambler Square
Rambleton Acres
Ramblewood
Ramblewood 76-49 B
Ramblewood At Daventry
Ramblewood Condo A
Ramblewood Condo B
Ramblewood Condo C
Ramblewood Court
Ramblewood East Condo
Ramblewood Farms
Ramblewood Mews
Ramblewood South
Rambling Hills
Rambo
Rambo Subdivision
Ramoth
Ranch Acre Homes
Ranch Acres
Ranch Colony
Ranch Colony Estates
Ranch Estates
Ranch Lake Estates
Ranch Section
Ranchero Homesites
Ranchero Manors 1st & 2nd
Ranchette Lake
Ranchette Royale
Ranchettes
Ranchleigh
Rancho Bonito
Rancho Bonito Rb1
Rancho Bonito Rb11
Rancho Bonito Rb13
Rancho Bonito Rb14
Rancho Bonito Rb15
Rancho Bonito Rb16
Rancho Bonito Rb17
Rancho Bonito Rb18
Rancho Bonito Rb22
Rancho Bonito Rb25
Rancho Bonito Rb26
Rancho Bonito Rb30
Rancho Bonito Rb32
Rancho Bonito Rb35
Rancho Bonito Rb36
Rancho Bonito Rb39
Rancho Bonito Rb41
Rancho Bonito Rb42
Rancho Bonito Rb43
Rancho Bonito Rb61
Rancho Bonito Rb62
Rancho Bonito Rb63
Rancho Bonito Rb65
Rancho Bonito Rb67
Rancho Bonito Rb68
Rancho Bonito Rb69
Rancho Bonito Rb70
Rancho Bonito Rb71
Rancho Bonito Rb72
Rancho Bonito Rb73
Rancho Bonito Rb74
Rancho Bonito Rb75
Rancho Bonito Rb76
Rancho Bonito Rb77
Rancho Bonito Rb78
Rancocas Heights
Rancocas Pointe
Rancocas Woods
Randa Palm Phase 2b1
Randall Manor
Randall Park
Randall Ridge
Randalls Trust
Randallstown
Randallwood
Randle Heights
Randolph Acres
Randolph Farms
Randolph Hills
Randolphs Addn To Goulds
Random Hills
Random Oaks Phase Ii
Ranger Condo Apts
Rangers Woods
Ranson
Ranson Estates
Rapallo
Rapallo Condo
Rapallo South Condo
Rapho Twp
Rappahannock
Rappahannock County
Rappahannock Landing
Rappahannock Ridge Estates
Raptor Grove
Raritan Twp.
Rarjem Acres
Raspberry
Raspeburg
Raulerson Sub Amen Plat
Rauls Place At Oasis
Raven Glen
Raven Oaks
Raven Pointe
Ravenhurst
Ravenhurst Glen
Ravens Crest
Ravens Crest
Ravens Landing
Ravenscliff
Ravenswood
Ravenswood 26th Ave Fll A
Ravenswood Estates & Mari
Ravenswood Estates & Marinas
Ravenswood North
Ravensworth
Ravensworth Grove
Ravensworth Park
Ravenwing
Ravenwood
Ravenwood Park
Ravine
Ravines
Rawlings Heights
Ray Park Heights
Ray Shipe Subdivision
Rayel Estates Plat 1
Raymondale
Raystown Farms Village
Rb28 Rancho Bonito
Rb60 Rancho Bonito
Rb64 Rancho Bonito
Re-Amended Plat Wilton Ma
Reach Condo
Reaches Condo
Reading
Ready Condo
Realsite Gdns Sec 2
Realty Park
Realty Sec Corp Addn To G
Realty Securities Corp Ad
Realty Securities Corppb
Realty Securities Corppb 2-85
Reamstown
Reardon Acres
Rebel Acres
Rebel Hill
Recanto S1
Red Bank Estates
Red Beach Lake
Red Brook Homes
Red Bud Run
Red Cedar Hill
Red Cedar Middle Village
Red Clover Meadows
Red Fox Estates
Red Fox Farms
Red Fox Forest
Red Fox Run
Red Hill
Red Hill Est Sub
Red Hill Estates
Red Hill Ests
Red Lion
Red Lion Boro
Red Lion Chase
Red Lion Condos
Red Mill Farms
Red Oak Crossing
Red Oak Estates
Red Oaks
Red Oaks Ii
Red Rose Gate
Red Run
Red Run Heights
Red Run Reserve
Red Willow
Redavo Estates 2nd Addn
Redden Ferry Estates
Redden Ridge
Reddenwood
Reddfield
Redding Manor Condo
Redland
Redland 1.16 Ac
Redland 4.81 Acres
Redland Agricultural Area
Redland Bowers Sub
Redland Citrus Orchards S
Redland Citrus Orchards Sub
Redland Compound
Redland Country Estates
Redland Equestrian 5 Acres
Redland Estate W/ Grotto
Redland Estates
Redland Farmhouse
Redland North
Redland Ranch
Redland Reef
Redland Villas Rev
Redlands
Redlands Best 1st Addn
Redlands Edge
Redlands Farm
Redlands Mansions
Redlands Mansions 1st Add
Redmont
Rednal Pb 102-56
Redondo
Redwood Lakes
Reed Land Co
Reed Proctors Sub
Reeds At Bayview Mobile Park
Reedsville
Reedville
Reedy Creek
Reef Cond
Reef Condo
Reef East Condo
Reef North Condo
Reef South Condo
Reef West Condo
Rees Estate
Reese Estates
Reesers Summit
Reeve's Sub
Reflection Lks At Naples P 1a
Reflections At Pembroke P
Reflections At Pembroke Pines
Reflections Of Las Olas
Reflections Of Las Olas C
Reflections On The River Viii
Refuge At Dirickson Creek
Regal Chase
Regal Estates
Regal Oaks
Regal Palm
Regal Palm Subdivision
Regal Palms
Regal Palms Eaton Condo
Regal Palms Mayfair Condo
Regal Palms Trafalgar Cond
Regal Palms Trafalgar Condo
Regal Shores
Regal Shores Condo
Regalia Condo
Regalo
Regatta At Indian Creek C
Regatta Pointe Condo
Regatta Pointe Condo No S
Regency @ Cranbury
Regency At Avenir
Regency At Baileys
Regency At Belmont
Regency At Boca Pointe
Regency At Boca Pointe Condo
Regency At Dominion Valley
Regency At Kimber Gl
Regency At Mclean
Regency At Monroe
Regency At Providenc
Regency At Rockhill Ridge
Regency At South Whitehall
Regency At Stone Meadows Farm
Regency At Valley Creek
Regency At West Windsor
Regency At Willowcrest
Regency At Yardley
Regency Court
Regency Estates
Regency Heights
Regency Highland
Regency Highland Club Con
Regency Highland Club Condo
Regency Homes At Sunrise
Regency House Co-Op
Regency Island Dunes Condominium
Regency Island Dunes Two
Regency Island Dunes Two Condominium
Regency Lakes
Regency Lakes At Coconut
Regency Lakes At Coconut Creek
Regency Meadows
Regency Of Palm Beach
Regency Of Palm Beach Inc
Regency Park
Regency Square
Regency Tower Condo
Regency Tower South Condo
Regency Towers
Regency Towns
Regency Towns Plat 1
Regency Towns Plat Three
Regent Acres
Regent Park Condo
Regent Square
Regents Crest
Regents Glen
Regents Glen Townhome
Regents Glen Villas
Regents Park
Regents Place Partial
Regents' Glen/Greenleigh
Regina Palms
Region De Los Lagos Chile
Regis House Condo
Regulars
Rehobeth Village
Rehoboth Bay Mhp
Rehoboth Beach
Rehoboth Beach Gardens
Rehoboth Beach Yacht And Cc
Rehoboth By The Sea
Rehoboth Manor
Rehoboth Marketplace
Rehoboth Service Center
Rehoboth Shores
Rehoboth Shores Mhp
Reid Manor
Reid Terrace Resub
Reids Grove
Reids Prospect
Reinerton
Reisterstown
Relco Estates First Addit
Remington Historic District
Remington Park
Remington Ridge
Renaissance
Renaissance At Tysons
Renaissance Club
Renaissance Commons Pud
Renaissance Commons Repl
Renaissance I
Renaissance Ii
Renaissance Of Pompano Be
Renaissance Of Pompano Beach
Renaissance On The Ocean
Renaissance On The River, A Condominium
Renaissance Park / On Top Of The World
Renaissance Place Condo
Renaissance Place E
Renaissance Ranches
Renaissance Sec 4 1
Renaissance Sec 8
Renalds Sd
Renn Quarter
Renoir
Replat Of Collier Creek S
Replat Of Country Lakes
Replat Of Miller Dreams S
Replat Of Palm Gardens
Replat Of Portion
Replat Of Portion Of Flor
Replat Of Portion Of M P
Replat Of Portions Of Ric
Replat Of Portions Of Richmond
Replat Of Portions Sebast
Replat Of Portions Sebastian Hghlds Unit 2 Pg 2
Replat Of The Villas At Three Oaks
Replat Of Track B Miami S
Replat Of Veranda Preserv
Replat Of Veranda Preserve East
Republic Square Condo
Rerdell
Reserva Campestre Velamar
Reserva Del Higueron
Reserva La Guaira
Reserve At Academy W
Reserve At Bailey St
Reserve At Black Rock
Reserve At Center Square
Reserve At Chalfont
Reserve At Chesterfi
Reserve At Cross Creek
Reserve At Damascus
Reserve At Davie
Reserve At Doral East
Reserve At Doral West
Reserve At Edgewood
Reserve At Fair Hill
Reserve At Grand Harbor Pd Phase 1, Plat 33 (The)
Reserve At Great Valley
Reserve At Gwynedd
Reserve At Hartwood
Reserve At Huntington 174
Reserve At Jupiter
Reserve At Manor Lane And Yardley
Reserve At Marlton
Reserve At New Brita
Reserve At Ocean Walk Vil
Reserve At Ocean Walk Villas
Reserve At Pilottown
Reserve At Riverwi
Reserve At Spring Mill
Reserve At Stoney Creek
Reserve At Tequesta
Reserve At Trewell
Reserve At Turgyan Farm
Reserve At Voorhees
Reserve At Waterford
Reserve At Waynebroo
Reserve At Wyngate
Reserve Of Lake Ridg
Reserveatnorthampton
Reserves At Dakota Crossing
Reserves At Lewes Landing
Reserves Of Nassau
Reservoir District
Reservoir Hill
Reservoir Overlook
Reservoir Ridge
Residence 1611 Condo
Residence On Monroe
Residences At Armani Casa
Residences At Brambleton
Residences At Dulles Prk
Residences At Fair Chase
Residences At Legacy Place Condo
Residences At Midtown Condo
Residences At New River
Residences At Palm Aire
Residences At Riverwalk Condo
Residences At Salamander
Residences At Shell Bay
Residences At Station Square
Residences At Sullivan
Residences At Vizcaya Con
Residences At Wildewood
Residences By Armani Casa
Residences By Armani/Casa
Residences Of Belmont At Boynton Beach Condo
Residences Of Hollywood
Residences Of Rehoboth Bay
Residences On Hollywood
Residences On Hollywood B
Residences On Hollywood Beach
Residencial Brisas
Residencial Campestre El Encinal
Residencial Don Pablo
Residencial El Prado Cond
Residencial Floresta Saban
Residencial Green Village
Residencial Mar De Jara
Residencial Mi Campito
Residencial Rocheylee V
Residencial Salamanca
Residencial-La Novilla
Resort At Singer Island
Resort At Singer Island Hotel Condo
Resort At Singer Island Residential Condo
Resort Villa Two Condo
Resort Villas
Resort Villas Condo
Resort Villas Condo 01 & 02 Irp
Resort Villas/Pga National
Resrv Chestnut Ridge
Rest
Reston
Reston Business Center
Reston Station
Reston Town Center
Resub Blks 9-12 Holmberg
Resub Ibec Addition No 4
Resub Of
Resub Of Highland Estates
Resub Of Hildemere In Se1
Resub Of Part Gratigny La
Resub Of Por Of Blk 27
Resub Of Por Of Norfolk Gardens
Resub Orange Ridge Pk
Resubdivision Of 9/10-37-
Resubdivision Of 9/10-37-41
Resubdivision Of Sec 7
Retreat
Retreat At Dolly Sods
Retreat At Fairwood Town
Retreat At Hazzards Hill
Retreat At Love Creek
Retreat At Millstone
Retreat At Sherwood Preserve
Retreat At Winding Creek
Retreat Condo
Reunion Resort
Reunion Village Ph 4 & 5
Reunion West Ph 3
Reunion West Ph 3 West
Reunion West Ph 4
Reunion West Village
Rev Green Haven
Rev Lake View Estates Uni
Rev Of Rev Fec Addn Hiale
Rev Pl Coral Gables Bisc
Rev Pl Little River Terr
Rev Pl Of Bay View Terr
Rev Pl Of Golf Course Add
Rev Pl Of Rev Pl Of Pt Of
Rev Pl Of Victoria Height
Rev Pl Sec 2 Cc Estates
Rev Pl W Little River
Rev Plat Nile Gardens Sec
Rev Plat Of Brandon Park
Rev Plat Of Lauderdale Manors
Rev Plat Of Port Of Blk
Rev Sec Country Club Ests
Reva
Revell Downs
Revere Run
Reverie
Revision Of Kenilworth
Revolea Beach
Rewastico Village
Rex Gardens Condo
Rex Pl 1
Rexford At Century Village Condo
Rexmont
Reynard Run
Reynards Crossing
Reynold's Overlook
Reynolds Prospect
Rhawnhurst
Rhodes Amd New Bisc
Rhodes Hill Square
Rhodesdale
Rhondda
Rhygate
Riawalkin Acres
Ribault Heights
Ribault Hills Unit 03 R/P
Rich Heights
Rich Valley Manor
Richards Sub
Richardson Ests
Richardson Mews
Richardson-Kellett Land
Richardsville
Richardsville South
Richfield Station Village
Richland Acres
Richland Estates
Richland Forest
Richland Greene
Richland Mdws
Richland Sta
Richland Twp
Richlyn Manor
Richmond
Richmond A Condo
Richmond C Condo
Richmond Cove
Richmond D Condo
Richmond F Condo
Richmond Heights
Richmond Hgts Ests 3rd Ad
Richmond Hills
Richmond Homes
Richmond Neighborhood
Richmond Townhouse
Richnor Springs
Richwood Crossing
Rick Manor
Rickel Addition
Ricmar Heights
Riddlewood
Riders Ridge
Riderwood Station
Ridgdill S/D
Ridge At The Bluffs
Ridge Commons
Ridge Crest
Ridge Crest Community
Ridge Grove Add 1
Ridge Grove Estates
Ridge Grove Gardens Condo
Ridge Hollow Estates
Ridge House Condominium
Ridge Manor Est
Ridge Manor Est Un2&Kingsr
Ridge Manor Estates Unit 2
Ridge Mnr Est Un 4
Ridge On Nob Hill
Ridge Run
Ridge Run At North Camp
Ridge Terrace
Ridge Top
Ridgefield
Ridgeland
Ridgeland Park
Ridgeleigh
Ridgeline Estates
Ridgely Forest
Ridgely Of Northeast
Ridgely Towson Center
Ridgely's Delight
Ridgely's Reserve
Ridgelys Choice
Ridgemont
Ridgemore
Ridgepointe Woods Villas
Ridges At Belmont
Ridges At Edsall
Ridges At Loudoun Valley
Ridges Of Alexandria
Ridgeview
Ridgeview At Centreville
Ridgeview Codm
Ridgeview Estates
Ridgeview Lake Estates
Ridgeview Sub
Ridgeview Towers Condo
Ridgeview Valley
Ridgeville Heights
Ridgeway
Ridgeway Beach
Ridgeway Mobile Home Sub
Ridgewood
Ridgewood Condo
Ridgewood Crossing
Ridgewood Estates
Ridgewood Heights
Ridgewood Manor
Ridgewood Mhp
Ridgewood Sub
Ridgley
Ridings
Ridings @ Cream Ridg
Ridings At Rehoboth
Ridings Of Malvern
Ridings Of Mntgmry
Ridings Of Newtown
Ridings Of Northam
Ridings Of Southampt
Ridley Farms
Ridley Park
Ridley Twp
Rifkin Village
Rigbie Bluff
Riggs Hill
Riggs Manor
Riggs Park
Riggs Sub
Riggs Sub (47.5)
Riggs Subd
Riggs Terrace
Riggtown Commons
Right-Of-Way Line Of S.R. 1
Riker Square
Rillhurst
Rillhurst Estates
Rimini Beach Condo
Rincon Del Valle
Rine
Rine Estates
Ring Factory Crossing
Ringoes Village
Ringtown
Rio Arriba, Casa De Campo, Dominican Republic
Rio Cristal Condo
Rio De St John
Rio Grand Area
Rio Nuevo
Rio Nuevo A Condo
Rio Nuevo B Condo
Rio Nuevo C Condo
Rio Otun
Rio South Townhomes
Rio St Lucie
Rio Villa
Rio Villa Unit Iv
Rio Vista
Rio Vista C J Hectors Res
Rio Vista C J Hectors Resub
Rio Vista Isles
Rio Vista Of Island Shores
Rio Vista Subdivision
Rio Vista Villas
Rio-Mar Apts Co-Op
Riobamba 72 Buenos Aires
Riomar Bay Unit Two
Riomar Sands Condo
Riomar, Casa De Campo, Dominican Republic
Rionegro
Ripley Park Sub
Ripley Sub
Rippling Estates
Rippling Ridge
Rippon Landing
Rise Condo
Rising Sun
Rison Hills Sub
Ritchie
Ritchie Heights
Ritchie Manor
Rittenhouse
Rittenhouse Square
Rittenhouse Square Condo
Ritters Hidden Valley
Ritters Hidden Valley Estates
Ritz Carlton
Ritz Carlton Residences, Palm Beach Gardens
Ritz Condo
Ritz Residences
Ritz Royal Palm Condo
Ritz-Carlton Bal Harbour
Ritz-Carlton Ftl Beach
Ritz-Carlton Residences
Ritz-Carlton South Beach
Riva
Riva Bay Harbor Condo
Riva Condominium
Riva Farms
Riva Residences
Riva Trace
Riva Trace/Summer Place
Rivard Manor
Rivella
Rivella -Ravello Hoa
Rivendell
Rivendell East
River
River Acres
River At The Bluffs
River Bank
River Bay Park Addn
River Bend
River Bend Condo
River Bend Estates
River Bend Farm
River Bend Farms
River Bend Park
River Bend Phase 1b
River Bend Sec 1
River Bend Sec 2
River Bend Sec 4
River Birch Manor
River Bluff Condo Ph Ii
River Bluffs
River Breeze Condo
River Bridge
River Bridge 2
River Bridge Par 2f
River Bridge Par 3a
River Bridge Pud 2b
River Bridge Pud 3a
River Bridge Pud 3c
River Club
River Club 1 At Belmont
River Club Condo
River Club Estates
River Club Townhouse Cond
River Country Estates
River Creek
River Crest
River Crossing
River Crossing At Spring Arbor
River District 14
River Downs
River East At Grandview
River Falls
River Forest
River Front
River Gardens
River Glen
River Grand Ii Condo
River Greens Sub
River Hall
River Hall Country Club
River Highlands
River Highlands Amen Plat
River Hill
River House Gardens Condo
River House Stuart
River House Stuart A Condo
River House Terrace Condo
River House Towers Condo
River Key Condo
River Knoll
River Lake Estates
River Lakes Manor Unit 1
River Landings Condo
River Lands
River Lanes
River Lofts Condo
River Manor Condo
River Marina
River Marsh
River Meadow
River Oak
River Oak Acres
River Oak Grove
River Oaks
River Oaks Estates Unit 2
River Oaks Farm
River Oaks-Brookfield Co
River Oaks-Lennar Condom
River Oaks~La Preserve
River Park
River Park Condo
River Park Unit 1
River Park Unit 2
River Park Unit 3
River Park Unit 3 Tract E
River Park Unit 5
River Park Unit 7
River Park Unit 9 Part C
River Park-Unit 4
River Pines
River Place
River Place - Little Turtle
River Place East
River Place North
River Place On The St Luc
River Place On The St Lucie No 10 1st Replat
River Place On The St Lucie No 3
River Place On The St Lucie No 5
River Place On The St Lucie No. 8
River Place South
River Place West
River Plantation
River Point
River Point Condo
River Pointe
River Ranch
River Ranch South
River Reach
River Reach Condominium I
River Reach Condominium Ii
River Reach Condominium Iii
River Reach Condominium Iv
River Reach Condominium V
River Reach Condominium Vi
River Ridge
River Ridge (Tequesta)
River Ridge Estates
River Ridge Estates Unreco
River Ridge Hills
River Ridge On The Shenandoah
River Ridge Subdivision
River Run
River Run C Condo
River Run Condo Ph I
River Run E Condo
River Run Garden Homes
River Run Resort
River Run South Condo
River Run South Marina Co
River Run Yacht Club Cond
River Section Of Croissant Park
River Shores
River Shores Condo
River Shores Plantation
River Springs
River Terrace
River Terrace Condo
River Tower Christ L
River Towers
River Trail At Valley Forge
River View
River Village
River Village Condo
River Villas Condo
River Vista
River Vista Subdivision Replat
River Walk
River Walk 03
River Watch
River's Bend
Riverbank
Riverbend
Riverbend At Cascades
Riverbend At Indian River
Riverbend At Irp Condo
Riverbend Condo
Riverbend Condo A Condo
Riverbend Condo Tequesta
Riverbend Estates
Riverbend Leisure World
Riverbreeze Villas Condo
Riverbridge
Riverchase
Riverchase Condos
Rivercrest
Rivercrest Condo
Riverdale
Riverdale Arms Apts Inc Co-Op
Riverdale Estates Sec 3
Riverdale Ests Sec 1
Riverdale Ests Sec 2
Riverdale Heights
Riverdale Heights- 1st A
Riverdale Omega
Riverdale Park
Riverdale Park Station
Riverdale Villas
Riverdale Woods
Riveredge Condo
Riverfield Estates
Riverfront
Rivergate
Rivergate Townhouses Condo
Riverglen East
Rivergreen Villas
Riverhill
Riveria Of Chevy Chase
Riverland
Riverland - Valencia Grove
Riverland Chula Vista
Riverland Manors
Riverland Mhp Unrec Co-Op
Riverland Mobile Home Park Unrec Co-Op
Riverland Parcel A - Plat
Riverland Parcel A - Plat Eleven
Riverland Parcel A - Plat Nine
Riverland Parcel A - Plat Seven
Riverland Parcel A - Plat Six
Riverland Parcel A - Plat Ten
Riverland Parcel A - Plat Three
Riverland Parcel A - Plat Twelve
Riverland Parcel A - Plat Two
Riverland Parcel A - Plat Two (Pb 75-37) Lot 17
Riverland Parcel B - Plat Eight
Riverland Parcel B - Plat Five
Riverland Parcel B - Plat Four
Riverland Parcel B - Plat Seven
Riverland Parcel B - Plat Six
Riverland Parcel B - Plat Three
Riverland Parcel C - Plat
Riverland Parcel C - Plat Eight
Riverland Parcel C - Plat Five
Riverland Parcel C - Plat Four
Riverland Parcel C - Plat Seven
Riverland Parcel C - Plat Six
Riverland Parcel C - Plat Ten Replat
Riverland Parcel C - Plat Three
Riverland Parcel C - Plat Two; Valencia Grove
Riverland Parcel D - Plat
Riverland Parcel D - Plat Three
Riverland Parcel D - Plat Two
Riverland Prcl A - Nine
Riverland Prcl A - Two
Riverland Village Sec 1 R
Riverland Village Sec 1-R
Riverland Village Sec 1-Replat
Riverland Village Sec One
Riverland/Valencia Parc
Riverlane Homesites 1st A
Rivermont Estates
Riverpoint At The Sands
Riverpoint At The Sands Phase I
Riverpointe
Riverpointe At The Sands
Rivers Bend
Rivers Bend Condo
Rivers Bluff
Rivers Edge
Rivers Edge At Oakwood
Rivers End
Rivers Knoll
Rivers Landing Condo
Rivers Pointe
Rivers Reach Phases Ib & I
Riverside
Riverside Add Amen Plat
Riverside At Bisc Natl Pk
Riverside Condo Debary
Riverside Condominiums
Riverside Drive Park
Riverside Estate
Riverside Estates
Riverside Estates 2nd Rev
Riverside Estates 2nd Revision
Riverside Estates Add Rev
Riverside Estates Condo
Riverside Farms
Riverside Gardens
Riverside Grande Condo
Riverside Harbour Subdivi
Riverside Manor
Riverside Meadows
Riverside No 2
Riverside No 3
Riverside Oaks
Riverside On The Loxahatchee
Riverside On The Potomac
Riverside Park
Riverside Park Add Amen P
Riverside Park Sub
Riverside Park Subdivision
Riverside Run
Riverside Station
Riverside Terrace
Riverside Towers
Riverside Towers Inc Condo
Riverside Villages
Riverside Villas At
Riverside Villas Condo Bl
Riversound
Riverstone
Riverstone Codm
Riverton
Riverton Condominiums
Riverton Estates
Riverview
Riverview Acres
Riverview At Lansdowne Woods
Riverview Estates
Riverview Garden Apartments
Riverview Heights
Riverview Manor
Riverview Mhp
Riverview North Condo
Riverview Overlook
Riverview Park
Riverview Sub
Riverview Terrace
Riverview Townhouses
Riverview Villas Condo
Riverview Waterfronts A R
Riverwalk
Riverwalk 1
Riverwalk 2
Riverwalk 3
Riverwalk 4
Riverwalk 6
Riverwalk 8
Riverwalk At Crofton
Riverwalk At Sands
Riverwalk Of Melbourne
Riverwalk Pl 6
Riverwalk Terrace
Riverwatch Commons
Riverwind At Jonathans Landing
Riverwind Phase One Sub
Riverwind Phase Three
Riverwinds
Riverwood
Riverwood At Everlands Phase 1
Riverwood Condo
Riverwood Plantations
Riverwood Sec 3
Riviera
Riviera 1st & 2nd Addn Am
Riviera 6-17 B
Riviera Apts A Inc Of Hal
Riviera Apts South Inc
Riviera At E Windsor
Riviera Beach
Riviera Beach Heights
Riviera Beach Heights Add
Riviera Beach Heights Add 3
Riviera Beach Heights Add 4
Riviera Beach Heights Add 6
Riviera Condominium Apts
Riviera Cove
Riviera Estates 1st Addn
Riviera Estates 2nd Addn
Riviera Ests
Riviera Heights
Riviera I Sub
Riviera In Pb 2
Riviera Isles
Riviera Isles Condo
Riviera Isles I
Riviera Isles Ii
Riviera Isles Iii
Riviera Isles Iv
Riviera Lake Subdivision
Riviera Of Chevy Chase
Riviera Palms Condo
Riviera Park Condo
Riviera Shores
Riviera Towers Co-Op
Riviera Towers Condo
Riviera Village Rev & Amd
Riviera West
Riviere Park
Rivieria
Rivinus
Rivo Alto Amd
Rixeyville Lakes
Rla (Sw)
Ro Secreto
Ro-Len Acres
Ro-Len Acres 2nd Add
Ro-Mont Gardens Andover B
Ro-Mont Gardens Andover C
Ro-Mont Gardens Andover H
Ro-Mont Gardens Andover H Condo
Ro-Mont South Condo A
Ro-Mont South Condo B
Ro-Mont South Condo C
Ro-Mont South Condo E
Ro-Mont South Condo G
Ro-Mont South Condo H
Ro-Mont South Condo K
Ro-Mont South Condo L
Ro-Mont South Condo Mnpq
Ro-Mont South Green Condo
Robbins Graham & Chillings
Robbinsville Edinbur
Robert-Thomas Sub - Resub
Roberts
Roberts & Grentner Addn
Roberts Crossing
Roberts Field
Roberts Mill Run
Roberts Park
Roberts Sub
Robin Glen Farm
Robin Hood
Robin Hood Lakes
Robin Hood Plains
Robin Meadows
Robindale Manor
Robins Nest
Robinson Knolls
Robinsons Paradise
Robinwood
Robles Del Mar
Robles Del Mar (Oaks Of The Sea)
Robles Gardens 3rd Addn
Robnel
Robscott Manor
Robt J Clark Sub
Rocaille Condo Apts
Rocha, La Serena. Uruguay
Rocha, Punta Del Diablo, Uruguay.
Rochelle
Rock Creek
Rock Creek - Paseo Verde
Rock Creek Commons
Rock Creek Estate
Rock Creek Forest
Rock Creek Gardens
Rock Creek Highlands
Rock Creek Hills
Rock Creek Landing
Rock Creek Palisades
Rock Creek Park
Rock Creek Phase Two
Rock Creek Village
Rock Creek Village Condominiums
Rock Creek Woods Apartments
Rock Gap District
Rock Hall
Rock Harbor Manor
Rock Harbor Yacht Ha(97.0)
Rock Hill
Rock Hill Estates
Rock Hill Sec
Rock Hill Sec B 34-8
Rock Island Estates
Rock Island Land Corp
Rock Island Landing
Rock Lodge Heights
Rock Manor
Rock Run
Rock Run Estates
Rock Spring
Rock Spring Park
Rock Springs
Rock Springs Estates
Rock View Beach
Rockawalkin Estates
Rockawalkin Village
Rockbrook Village Trailer Park
Rockburn Commons
Rockcrest
Rockdale Estates
Rockdale Manor
Rockerman Hgts
Rockfleet Garden
Rockford Falls
Rockford Heights
Rockford Mews
Rockford Park Condo
Rockford Towers
Rocking K Ranches Subdivision
Rockingham County
Rockland Creek Estates
Rockland Hills
Rockland Park
Rockland Ridge
Rockland Run
Rockland Square
Rockland Village
Rockledge
Rockledge At Belair
Rockledge Clusters Condo
Rockmoor Headlight Track
Rockmoor Park Track
Rockmoor Place
Rockmoor Villa Track
Rockridge Sub Unit 1
Rockshire
Rockshire Townhomes
Rockville
Rockville Estates
Rockville Heights
Rockville Outside
Rockville Town Square
Rockwell Green
Rockwell Island
Rockwood Sub
Rocky Gorge Estates
Rocky Hill
Rocky Hill Boro
Rocky Point
Rocky Point Highlands
Rocky Point/Hecky's Allotment
Rocky Run
Rocky Spring Acres
Rodeo Drive
Rodgers Forge
Rodgers Heights
Rodman Gardens Co-Op
Rodman Of Hollywood Condo
Rodman Of Hollywood Condo Apts
Rodman Street Development
Rodney Vil
Rodo Beach
Roebling Village
Roebucks
Roesville
Roger Homes Amended Plat
Rogers Addition
Rogers Addn
Rogers Condo
Rogers Ford
Rogers Forge
Rogers Glen
Rogers Heights
Rogers House Condo
Rognel Heights
Rohan Acres
Rohrersville
Rojan Meadows
Rokeby Farms
Rokest Condominium Apartm
Rokest Condominium Apartments
Rol Park Village
Roland Park
Roland Place
Roland Terrace
Rolen Lake
Rolen Lake Gardens
Rolen Lake Gardens Co-Op
Rolling Acres
Rolling Brook
Rolling Farm Estates
Rolling Forest
Rolling Glen Estates
Rolling Green
Rolling Green Condo C
Rolling Green Condo D
Rolling Green Condo G
Rolling Green Condo H
Rolling Green Ridge 1st Add
Rolling Green Ridge Seacrest
Rolling Green Sub
Rolling Hill
Rolling Hills
Rolling Hills Unit 1
Rolling Hills Estates
Rolling Hills Golf & Tenn
Rolling Hills Golf & Tennis Club
Rolling Hills Golf And
Rolling Hills Golf And Te
Rolling Hills Golf And Tennis
Rolling Hills Golf And Tennis Club
Rolling Hills Lake Estate
Rolling Hills Unit 1
Rolling Hills Unit 3 Hill
Rolling Hills Unit 4 Hills
Rolling Knolls
Rolling Manor
Rolling Manor Estates
Rolling Meadows
Rolling Oak Estates
Rolling Oaks
Rolling Oaks Estates
Rolling Oaks Ph 7
Rolling Park
Rolling Pines T/H
Rolling Ranch Estate
Rolling Ranch Estates
Rolling Ridge
Rolling Ridge Ii
Rolling Road Farms
Rolling Terrace
Rolling Valley
Rolling View
Rolling Woods
Rollingwood
Rollingwood Village
Rollinsdale
Roman Nose Spa
Roman Ridge
Roman Village
Romancoke On The Bay
Romney
Romney Fruit Ranches
Rond Point Condo
Rondelay
Roney Palace
Roney Palace Condo
Ronnie Park
Ronola Apts Condo
Roop Road Estates
Roosevelt City
Roosevelt Estates
Roosevelt Gardens
Roosevelt Gardens 2nd Add
Roosevelt Heights
Roosevelt Homesites
Roosevelt House Co-Op
Roosevelt Park
Roosevelt Pk Addn No 1
Rosa Sub
Rosabella
Rosales Condo
Roscommon
Rose Bower Amd Pl
Rose Estates
Rose Gardens Condo
Rose Hill
Rose Hill Estates
Rose Hill Falls
Rose Hill Farm Estates
Rose Hill Farms
Rose Hill Park
Rose Hill Reserve
Rose Hill South
Rose Lawn Pk A Sub
Rose Manor
Rose Pointe
Rose Tree Woods
Rose Valley
Rose Valley Estates
Rose Valley-Plat Eight>
Rose-Wood Amd
Rosebank
Rosebud
Rosecliff Point
Rosecroft
Rosecroft Commons
Rosecroft Park
Rosecroft Terrace
Rosecroft Village
Rosedale
Rosedale Acres
Rosedale Estates
Rosedale Gardens
Rosedale Heights
Rosedale Manor
Rosedale Park
Rosedale Terrace
Rosedale/Camelot
Rosehaven
Rosehill Condo
Rosehill Manor
Roseland
Roseland Heights
Roselawn Heights
Roselle Park
Rosemary Add In The Nwd Neighborhood
Rosemary Hills
Rosemont
Rosemont Condo
Rosemont East
Rosemont Gardens Unit A
Rosemont Park
Rosemont Park Delray
Rosemore Ests
Rosemount
Rosen Tr
Roseneath Palms
Rosenmiller Woods
Roseville Plantation
Rosewald Beach
Roseway Sub
Rosewood
Rosewood Condo
Rosewood Court Subdivisio
Rosewood Court Subdivision
Rosewood Forest
Rosewood Homes
Rosewood Park
Rosewood Residences
Rosewood Village
Rosini
Roslyn
Rosmoor
Rosni Estates
Ross
Ross Haven
Ross Neck
Rosser Reserve
Rosslyn
Rosslyn Heights
Rossmoor
Rossmoor Adult
Rossmoor Adult Comm
Rossmoor Adult Comm.
Rossmoor Leisure World
Rossmoor Mutual #19
Rossmoor Mutual #19b
Rossmoor Mutual 6-B Codm
Rossum Crossing
Rotanda Lakes
Rothrock State Forest
Roths Farm
Rothsville
Rothwell Estates
Rotonda
Rotonda Sands
Rotonda Heights
Rotonda Heigths
Rotonda Hts
Rotonda Lakes
Rotonda Lakes Segment 01
Rotonda Meadows
Rotonda Meadows & Villas
Rotonda Pebble Beach
Rotonda Sand Unit 1
Rotonda Sands
Rotonda Sands Un1
Rotonda Sands Unit 1
Rotonda Villas
Rotonda West
Rotonda West Long Meadow
Rotonda West Oakland Hills
Rotonda West Pinehurst
Rotonda West White Marsh
Rotonda White Marsh
Rottau Village
Round Bay
Round Hill
Round Top Estates
Roundtop West
Roundtree
Roundwood Ridge
Rousby Hall Woods
Rouse Mountain
Route 50
Rouzerville
Rovan Farms
Rowe C W Sub
Rowe Estates
Rowens Mill
Rowland Acres 3
Rowland Park
Rowtons Sub
Roxboro
Roxborough
Royal Acres
Royal Ambassador
Royal Ambassador Condo
Royal Atlantic Condo
Royal Atlantic In Delray Beach Condo
Royal Bahamian East Condo
Royal Bahamian West
Royal Coast Condo
Royal Country
Royal Court
Royal Crest Estates
Royal Embassy Condo
Royal Exchange
Royal Flagler Condo
Royal Flamingo Villas
Royal Flamingo Villas - Beach Resort
Royal Flamingo Villas Beach Resort
Royal Forest Townhouses
Royal Garden Condo
Royal Garden Estates
Royal Glen
Royal Grand Condo
Royal Grant
Royal Grenadier Ii Condo
Royal Harbour Yacht Club
Royal Hidden Cove
Royal Highlands
Royal Highlands Unit 7
Royal Hills Estates
Royal Homes West
Royal Homestead Condo
Royal Hrb Yacht Cl Marina
Royal Lakes
Royal Lakes 1st Addn
Royal Land Amended
Royal Lauderdale Landings Condo
Royal Legacy
Royal Mariner Condo
Royal Oak
Royal Oak Hills
Royal Oak Hills 1st Sec
Royal Oak Hills 2nd Sec
Royal Oaks
Royal Oaks Condo
Royal Oaks Francesca
Royal Oaks Townhouse 11 Condo
Royal Oaks Townhouse 4 Co
Royal Oaks Townhouse 5 Condo
Royal Oaks/Regents Glen
Royal Palm
Royal Palm 47 Condo
Royal Palm Acreage
Royal Palm Acres 10 Sec
Royal Palm Acres Eighth Sec
Royal Palm Acres First Se
Royal Palm Acres First Sec
Royal Palm Acres Fourth S
Royal Palm Acres Ninth Sec
Royal Palm Acres Sec 6
Royal Palm Acres Second S
Royal Palm Acres Second Sec
Royal Palm Acres Third Se
Royal Palm At Plantation
Royal Palm Bch Acreage Sec 25
Royal Palm Estates
Royal Palm Estates 2
Royal Palm Estates No 5 S/D
Royal Palm Estates Sec 2
Royal Palm Estates Sec Th
Royal Palm Estates Sec Three
Royal Palm Forest
Royal Palm Gardens
Royal Palm Gardens Condo
Royal Palm Golf Est Unit 1
Royal Palm Harbor 1st Add
Royal Palm Lake Estates
Royal Palm Mobile Home Community
Royal Palm North 1st Addn
Royal Palm Park
Royal Palm Place
Royal Palm Pointe
Royal Palm Polo
Royal Palm Polo Plat
Royal Palm Residences
Royal Palm Residences Condo
Royal Palm Villas
Royal Palm Vista
Royal Palm Yacht & Country Club
Royal Palmetto Condo
Royal Palms Condo
Royal Palms Park
Royal Palms Park Sec 1
Royal Palms Park Sec 3
Royal Palms South
Royal Park
Royal Park Add To P B In
Royal Park Condo
Royal Park Estates
Royal Park Gardens
Royal Park Gardens 3-M Co
Royal Park Gardens I-A Co
Royal Park Gardens I-B Co
Royal Park Gardens I-B Condo
Royal Park Gardens I-C Co
Royal Park Gardens I-C Condo
Royal Park Gardens I-J Co
Royal Park Gardens I-J Condo
Royal Park Gardens Ii-D C
Royal Park Gardens Ii-D Condo
Royal Park Gardens Ii-K Condo
Royal Park Gardens Ii-L C
Royal Park Gardens Ii-L Condo
Royal Park Gardens Iii-F
Royal Park Gardens Iii-F Condo
Royal Park Gardens Iii-G Condo
Royal Park Gardens Iii-H
Royal Park Gardens Iii-H Condo
Royal Park Gardens Iii-M
Royal Park Gardens Iii-M Condo
Royal Pines
Royal Pines Est
Royal Plaza
Royal Poinciana
Royal Poinciana Condo
Royal Point At Palm Aire
Royal Saxon
Royal Saxon Inc
Royal Singapore Lake
Royal South Beach Condo
Royal Terrace Condominium
Royal Townhomes
Royal Village
Royal Village Townhouses Cond
Royal Village Townhouses Condo
Royal White Oaks
Royal Woods
Royale Gardens
Royale Gardens Condo
Royale Green Condo 6
Royale Green Condo 7
Royale Green Sec 5
Royale Green Sec Four
Royale Green Townhouse Se
Royale Point-Townvillas C
Royston
Rozland Condo
Rrc13s River Ranch
Rrc20 River Ranch
Rrc28 River Ranch
Rrc48 River Ranch
Rrc49 River Ranch
Rrc52 River Ranch
Rrc53 River Ranch
Rrc54 River Ranch
Rre1 Frostproof
Rrhn1 River Ranch Hunting North
Rrhn2 River Ranch Hunting North
Rrhn3 River Ranch Hunting North
Rrhn6 River Ranch Hunting North
Rs
Rse10 St. John's Riverside Estates
Rse11 St. John's Riverside Estates
Rse2 St. John's Riverside Estates
Rse4 St. John's Riverside Estates
Rse6 St. John's Riverside Estates
Rse7 St John's Riverside Estates
Rsj1 Rio De St. John
Rsj2 Rio De St. John
Ruby
Ruby Condo
Rucks Park
Rudell Park Sec 1
Rudnick Don
Ruff's Little Dixie
Ruffano Italy
Ruffin's Pond
Rugby Hall Estates
Ruhlman
Ruhlman Subdivision
Rumbridge Acres
Rumsey Island
Runaway Bay
Runaway Bay Condo
Runions Creek
Runnemede Gardens
Runnemede Manor
Running Brook
Running Brook Hills
Running Mead
Runnymeade
Runnymeade Farms
Runnymede
Runnymede West
Rural
Rural Adams County
Rural Agricultural Land
Rural Area
Rural Estate Residential
Rural Littlestown
Rural New Oxford
Rural Richland
Rural Tracts In Lorida Are
Rural- Horse Country
Rural/Agricultural Acreage
Rural/Agricultural Residen
Rush Township
Rushbrook
Rushing River Farms
Ruskin City Map Of 1v5
Ruskin Colony Farms
Russell
Russell Estates
Russell Office Park Codm
Russell Terrace
Russett
Russett Farms
Russett Reserve
Rustfield
Rustic Acres
Rustic Acres Unrecorded
Rustic Hills
Rustic Knolls
Rustic Lakes
Rustic Ranches
Rustic Ranches Estates
Rustic Ranches Of Wellington
Rusty Red
Rutgers
Ruth Ridge
Rutherford
Rutland Estates
Rutledge
Ruxton
Ruxton Crossing
Ruxton Heights
Ruxton Hill Manor
Ruxton Hills
Ruxton Landing
Ruxton/Riderwood
Ruxton/Towson
Ryans Run
Rydal
Rydal East
Ryder Cup Villas Condo
Rye
Ryers
Ryerss Hunt
Rygate
Rymer Sub
Ryon Woods
S & R Of Inverrary
S & R Of Inverrary Par F
S & R Of Inverrary Prcl S
S 13sw E Us1 -
S Allapattah Gardens
S D S Square
S L & I C
S Miami Heights Addn B
S Miami Heights Addn C
S P G Heights 4th Add
S Punta Gorda Hts 4th Add
S Punta Gorda Hts 7th Add
S.P. Powell Sub
S/D
S/D Of 1-44-35
S/D Of 10-44-43, Gov Lts 1, 2 & 3
S/D Of 13-42-36 By St Survey In Pb 3 P 3
S/D Of 19-44-43, Resub Of Trs 47 Thru 50
S/D Of 2-44-35
S/D Of 25-43-36
S/D Of 33-45-43, W 3/4
S/D Of 34-43-35 Frac Sec In
S/D Of 35-40-37 In Chancery
S/D Of 36-44-42, Sw 1/4
S/D Of 8-42-37 In Pb 7 P
S/D Of 8-42-37 In Pb 7 P 29 & Official
S/D Of 8-46-43
S/D Of 9-46-43 In
S/D Of Lot 17, 31-43-37 Amnd Pl In
Sabal Chase
Sabal Creek Phase 2
Sabal Gardens At Boca Teeca 2
Sabal Lake Estates
Sabal Lake West
Sabal Lakes
Sabal Lakes Ph 3
Sabal Lakes Ph 4
Sabal Palm By Prestige
Sabal Palm Of Pine
Sabal Palm Village 2 Cond
Sabal Palm Village 2 Condo
Sabal Palm Village Condo
Sabal Pine
Sabal Pine Condo
Sabal Pine East
Sabal Pine East Condo
Sabal Pine South Condo
Sabal Point Apts Condo
Sabal Pointe At Ballenisles
Sabal Ridge Condo
Sabal Shores Apts Condo
Sabbia
Sabbia Beach
Sabbia Beach Condo
Sable Chase
Sable Palm Estates
Sable Pass
Sable Pine Condo
Sable Point
Sablewood
Sabrina Park
Sacarma
Saddle Bridge
Saddle Club Garden Apts
Saddle Club Garden Apts A
Saddle Creek
Saddle Ridge
Saddle Ridge Estates
Saddle Trail Park
Saddle Trail Park Of Wellington
Saddle Wood
Saddle-Up Plat
Saddlebrook
Saddlebrook Estates
Saddlebrook Lakes
Saddlebrook West
Saddlebrooke Farms
Saddlewood At Polo Legacy
Saddlewood Unit Two
Sadsbury Park
Saefern
Safe Harbor Landing
Safe Harbor Maritime (5.0)
Safe Harbour Marina
Safety Harbor Sec 1
Sag Harbor Trace
Saga Bay
Saga Bay Gardens Condo
Saga Bay Sec 1
Saga Bay Sec 1 Pt 4
Saga Bay Sec 1 Pt 5
Saga Bay Sec 1 Pt 6
Saga Bay Sec 1 Pt 9
Saga Bay Sec One Part One
Saga Bay Sec One Part Two
Saga Bay Townhomes
Saga Bay Townhomes 1st Ad
Saga Bay Townhomes 1st Addn
Saga View
Sagamore Forest
Sage Beach
Sage Beach Condo
Sage Hill
Sage Intracoastal
Sage Intracoastal Residences
Sage Mdws At Pidcock
Sage On 3rd Condo
Sage On Lenox Condo
Sage Run
Sagebrook
Sagewood
Saigon
Sailaway Bay
Sailboat Bend
Sailboat Cay Condo
Sailboat Point Wellington
Sailboat Pointe
Sailboat Pointe Condo
Sailfish Cove
Sailfish Cove Condominium
Sailfish Cove Downtown Stuart
Sailfish Cove Luxury Newes
Sailfish Point
Sailfish Point 01
Sailfish Point 04
Saint Albans
Saint Andrews
Saint Andrews Es
Saint Andrews Wood
Saint Calixte
Saint Charles
Saint Clair
Saint Clair Point
Saint Davids Park
Saint George Island
Saint Helena
Saint Inigoes
Saint John Cir
Saint Josephs
Saint Lucie Gardens
Saint Matthews Wds
Saint Moritz
Saint Stephens Gre
Saint Tropez
Sala Del Mar
Salato Pompano Beach
Salato Residence Pompano Beach
Salato Residences
Salem
Salem Farm
Salem Farms
Salem Fields
Salem House
Salem House Condo
Salem Manor
Salem Meadows
Salem Run
Salento, Quindio, Colombia
Salerno
Salerno Reserve
Salerno Reserve At Showcase Pud
Salerno Reserve At Showcase Pud Phase 2
Salford Pond
Salisbury
Salisbury Condo
Salisbury Condos
Salona Village
Salt Aire
Salt Life Park Llc
Salt Pond
Salta Capital
Saltaire
Saltwater Landing
Salvatore Add To Pahokee
Salzedo In The Gables Con
Salzedo Manor Condo
Samara - Guanacaste
Samari Lake Condominium
Samari Lake East Condo
Saminik Sub
Samson Highlands
Samuel Beck Sub
San Bernardo Del Viento
San Carlos
San Carlos Estates
San Carlos Park
San Castle 1st And 2nd Ad
San Castle 1st And 2nd Adds
San Castle 3rd And 4th Adds
San Cristobal
San De Vance Golf & Tennis Club Condo
San De Vance Golf And Tennis Club
San Denis Estates
San Domingo Cove
San Felipe Rancho Californ
San Fernando
San Francisco By The Bay
San Francisco East
San Gregorio Assisi
San Lorenzo
San Lorenzo Condo
San Lucie Plaza Subdivisi
San Lucie Plaza Subdivision Unit 1
San Marco
San Marco Condo
San Marino
San Marino Condo
San Marino Island
San Mateo
San Matera The Gardens Condo
San Mellina
San Michele
San Michele Condo
San Pedro Estates
San Raphael Condo
San Remo
San Remo Condo
San Remo Golf & Tennis Club Condo
San Remo Townhouses Condo
San Sebastian
San Sebastian Twnhses
San Sebastian Unit 2
San Sebastian Unit No 5
San Simeon Homes
San Simeon The Calif Club
San Souci
San Souci Estates
San Telmo Buenos Aires
San-Di-Gan
Sanatoga Crossing
Sanatoga Ridge Comm
Sanctuary
Sanctuary 2
Sanctuary At Farmhill
Sanctuary At Hawks Cay
Sand And Sea
Sand Cove
Sand Dollar
Sand Dollar Condo
Sand Dollar North Condominium
Sand Dollar Shores
Sand Dollar Villas Condominium A
Sand Dollar Villas Condominium B
Sand Dollar Villas Condominium C
Sand Hill Shores
Sand Lake Point Ut 4
Sand Place Acres
Sand Ridge Estates
Sand Spring Run
Sand Trail (Aka Copperleaf)
Sand Trail Pud
Sand Trail Pud Aka Copperleaf
Sandalfoot Blvd Apts Cond
Sandalfoot Blvd Apts Condo
Sandalfoot Cove Sec 1
Sandalfoot Cove Sec 11
Sandalfoot Cove Sec 12
Sandalfoot Cove Sec 3
Sandalfoot Cove Sec 4
Sandalfoot Cove Sec 9
Sandalfoot Estates
Sandalfoot Estates East
Sandalfoot South
Sandalfoot South One
Sandalfoot South One Cond
Sandalfoot South One Condo Pt Of Lts 12, 33 And 34
Sandalfoot South Three Cond
Sandalfoot South Three Co
Sandalfoot South Three Cond
Sandalfoot South Three Condo
Sandalfoot South Three In
Sandalfoot South Two Condo Or2089p775
Sandalfoot Squire
Sandalfoot Squire Condo
Sandalwood
Sandalwood Condo Apts
Sandalwood Estates
Sandalwood Lakes
Sandalwood Of Vero
Sandbridge
Sandbridge Beach
Sandcastle Cove
Sandcastle Estates
Sandcastles At Doral
Sanderling
Sanderling Condo
Sanderling Subdivision
Sanders
Sanders Park
Sandhill Shores
Sandhill Village
Sandlake Station
Sandoval
Sandpebble
Sandpebble Condo
Sandpebbles Townhouse Con
Sandpiper At Calif Club
Sandpiper At Calif Club C
Sandpiper At Hibiscus Con
Sandpiper Bay
Sandpiper Bay Wyldwood
Sandpiper Condo
Sandpiper Cove At Botanic
Sandpiper Cove At Botanica Condo
Sandpiper Cove Ii At Botanica Condo
Sandpiper Pointe
Sandpoint
Sandpointe West Sub
Sandringham
Sands Of Key Biscayne Con
Sands On The Ocean
Sands On The Ocean Section 1 Condominium
Sands On The Potomac
Sands Point 5 Condo
Sands Point Condo Iv
Sands Point Condominium I
Sands Point Condominium Ii
Sands Point Condominium Iii
Sands Point Condominium Iv
Sands Point Condominium V
Sands Point Iii Condo
Sands Pointe Ocean Beach
Sands Subd
Sandtown-Winchester
Sandtree
Sandy Ashley Plat
Sandy Beach
Sandy Brae
Sandy Brae Th
Sandy Cay Bahamas
Sandy Cove
Sandy Depths
Sandy Hill
Sandy Meadows
Sandy Oaks
Sandy Pines Estates
Sandy Ridge Acres
Sandy Ridge Estates
Sandy Ridge Townhomes
Sandy Run
Sandy Shores
Sandy Shores Heights
Sandy Shores Vista
Sandy Spring
Sandy Spring Estates
Sandyford Park
Sanford D Adler
Sanford Ridge
Sanford Shores
Sang Run Rd
Sanibel Estates
Sanibel Village
Sanora Units 1 And 2 Replat
Sans Souci Condo
Sans Souci Estates
Sans Souci Manor
Sans Souci Rev & Amd
Sansbury Park- 1st Addn
Sanstrom Estates
Sant'anna_Canal Di Valle-
Santa Barbara
Santa Barbara 1st Addn
Santa Barbara Estates
Santa Barbara Estates Resub
Santa Barbara Gardens Condo
Santa Barbara Shores
Santa Barbara Villas
Santa Catalina
Santa Clara Sub
Santa Cruz
Santa Fe
Santa Fe De Antioquia
Santa Maria
Santa Maria Condo
Santa Monica
Santa Monica Condominium
Santa Monica Estates
Santa Rosa Groves
Santa Teresa
Santamaria Harbor
Santi Heights
Santo Domingo
Santo Domingo Este
Santona Condo
Santorini At Vizcaya
Santorini Isles
Santrys
Sapphire Condo
Sapphire Fort Lauderdale
Sapphire Fort Lauderdale Condo
Sapphire Pointe - Diamond
Sapphire Pointe - Diamond Lake
Sapphire Shores-Sapphire
Sappington Hill
Saquenay Quebec Canada
Saraceno
Saratoga
Saratoga At Royal Palm 1
Saratoga At Royal Palm 4
Saratoga Bay
Saratoga Farms
Saratoga Heights Addn No
Saratoga Heights Re-Sub
Saratoga Hunt
Saratoga Pines
Saratoga Pointe
Saratoga Townhouses
Saratoga Woods
Sarawoods
Sardinia Porto Rotondo Ita
Sarita Heights West
Sartori Lake
Sassafras
Sassafras Meadows
Satori
Satterfield
Saturnia
Saturnia Isles 1
Saturnia Lakes
Saunders
Saunders Point
Sausalito Place
Sausalito Townhouses
Savage Meadows
Savanah Ranches
Savanna
Savanna - Sector 2- Parcels 21b 22 23 & 24
Savanna At Riverside
Savanna Club
Savanna Club Condo
Savanna Club Plat I
Savanna Club Plat Ii
Savanna Club Plat Iii
Savanna Club Plat Phase Three
Savanna Highlands
Savanna Lakes North
Savannah Apartments Condo
Savannah At Doral
Savannah At Riverside
Savannah At Riverside Con
Savannah At Riverside Condo
Savannah Estates
Savannah Lakes Paired Villas
Savannah Overlook
Savannah Pines Condo Ph4
Savannah Place
Savannah Plat 1
Savannah Plat 3
Savannah Plat 4
Savannah Ranch Estates
Savannah's Condominium S1
Savannah's Condominium Section 1 Phase 1-H
Savannahs Condominums
Savannahs Landing
Savannas Club Condo
Savona
Savoy At Reston Town Center
Savoy East Condo
Savoy Park Condominiums
Savoy Woods Estates
Saw Creek Est
Saw Creek Estates
Saw Mill Run
Saw Mill Valley
Sawfish Bay
Sawgrass At White Oak Creek
Sawgrass Estates
Sawgrass Exchange Plat
Sawgrass Lakes
Sawgrass Lakes Homes
Sawgrass Lakes Phase 2
Sawgrass Lakes Phase 3a
Sawgrass Lakes Phase 4
Sawgrass Lakes Phase 5
Sawgrass Plantation
Sawgrass Plantation - Phase 1b Section 2
Sawgrass Preserve
Sawgrass Villas Condo
Sawhill
Sawyers Creek
Saxon Woods North Condo
Saxony B/Kings Point
Saxony Square
Sayan Condo
Saybrook
Saybrook Vil
Saybrooke
Saybrooke Landing At Seven Oaks Condominium
Sayerville
Saylor Farm
Sayreville
Scarborough I
Scarborough Ii
Scelzi
Scenery Pointe Codm
Scenic Hills
Scenic Manor
Scenic Terrace South Ph 1
Scenic View Estates
Schaffer Homesites
Schefflera Gardens Unrecorded
Schelford North
Schellsburg
Schenectady
Schenley Park
Schenley Park Gardens
Schenley Park Sec 1
Schindler Sub
Schlusser Village
Schmidts Pine
Schnecksville
Schoentown
School Bell Garden
School Gardens
School House Sub
School House Village
School Lane Hills
School Valley Farms
Schoolhouse Commons
Schoolhouse Gate
Schoolhouse Lane
Schoolhouse Mews
Schooner Bay Condo
Schooner Landing
Schroeders
Schrom Hills
Schumaker Glen
Schumaker Manor
Schumaker Woods
Schuylkill Haven
Schwenksville
Scientists Cliffs
Scot-Greene Estates
Scotch Run
Scotchbrook
Scotland
Scotland Beach
Scotland Heights
Scotland Run
Scots Fancy
Scots Glen
Scott Gardens
Scott Greene Estates
Scott Lake Manor Sec 1
Scott Lake Manor Sec 2
Scott Lake Manor Sec 4
Scott Lake Manor Sec 5
Scott Lake Manor Sec 6
Scott Lake Manor Sec 7
Scott Lake Manor Sec 8
Scott Mccoy
Scott Ridge
Scott's Crossing Condo
Scottfield
Scotts Hill
Scotts Park First Add
Scranton
Sea Air Mobile City
Sea Air Towers
Sea Air Towers Condo
Sea Air Village
Sea Breeze Estates
Sea Breeze Mobile Manor Unrec Co-Op
Sea Brook Place
Sea Brook Place Condo
Sea Chase
Sea Club Of Hillsboro Beach
Sea Coast Court
Sea Colony
Sea Colony Condo
Sea Colony East
Sea Colony West
Sea Crest Condo
Sea Dunes
Sea Edge
Sea Gate
Sea Grape Town Homes
Sea Haven
Sea Haven Garden Aire Vil
Sea Haven, Garden Aire Village
Sea Island
Sea Isle City
Sea Lofters Condo
Sea Mark
Sea Meadow
Sea Meadows
Sea Mist Court
Sea Monarch Condo
Sea Oaks
Sea Oaks Village
Sea Oaks West Cluster Iii
Sea Oats Of Juno Beach Condo
Sea Palms
Sea Palms Condominium
Sea Pines
Sea Pines Estates
Sea Pines Unit 1
Sea Pines Unit 2
Sea Pines Village
Sea Pointe Towers Of Fort Pierce, A Condominium
Sea Ranch
Sea Ranch Club A
Sea Ranch Club A Condo
Sea Ranch Club B Condo
Sea Ranch Club Condo
Sea Ranch Club Of Boca
Sea Ranch Club Of Boca I Condo
Sea Ranch Club Of Boca Ii
Sea Ranch Club Of Boca Ii Condo
Sea Ranch Club Of Boca Iii Condo
Sea Ranch Lakes
Sea Ranch Lakes North Con
Sea Ranch Lakes North Condo
Sea Ranch Villas Association Inc
Sea Rise Condo
Sea Shell By The Ocean
Sea Tern Of Hutchinson Island
Sea Tower
Sea Tower Apts Co-Op
Sea View
Sea View Park Amd
Sea View Park-Amended
Sea View Ridge
Sea Wash Condo
Sea Winds Condo
Sea Winds Condominium
Sea-Wood
Seaboard Heights
Seaboard Highlands
Seaboard Park
Seabranch
Seabreeze At Atlantic View Condominium
Seabreeze At Lacey
Seabrook
Seabrook Acres
Seabrook Estates
Seabrook Park
Seabrook Park Estates
Seabrook Village
Seacoast 5151 Condo
Seacoast 5152 Condo
Seacoast 5700 Condo
Seacoast Gardens Condos Unit 2
Seacrest
Seacrest Estates
Seacrest Gulfstream
Seacrest Hills
Seacrest Isles 1 Add
Seacrest Park
Seacrest Pines
Seacrest Towers
Seacrest Villas Condo
Seaford
Seaford Manor
Seagate At The Hamlet
Seagate Country Club
Seagate Country Club At The Hamlet
Seagate Ext
Seagate Golf At The Hamlet
Seagate Golf Club
Seagate Golf Club At The Hamlet
Seagate Harbor
Seagate Manor
Seagate Manor Condo
Seagate Of Gulfstream
Seagate Of Gulfstream Con
Seagate Of Gulfstream Condo
Seagate Of Highland Condo
Seagate Residences Condo
Seagate Sec B
Seagate Towers
Seagate Towers Condo
Seaglass Condo
Seaglass Cottages
Seaglass P. D.
Seagrape
Seagrape Cond Decl Filed 12-19-80
Seagrape Condo
Seagrape Gardens Condo
Seagrape Village Condo
Seagrass Condominium
Seagrass Plantation
Seagrove
Seagrove Pud
Seagrove West
Seagull Townhomes Condo
Seagulls Condominium
Seahorse Oceanside Apartments
Seamark Condo
Seapines
Searise
Seas Subdivision
Seascape Condo
Seascape I Condominium
Seascape Ii Condominium
Seashore Club
Seashore Villas
Seaside
Seaside Condo
Seaside Court
Seaside Dunes
Seaside Heights
Seaside Heights Boro
Seaside Of Stuart Condo
Seaside Resubd
Seaside Village East Condo
Seaside Village West Cond
Seaside Village West Condo
Seaside Villas
Seasons
Seasons At Big Sky
Seasons At Round Mill Meadows
Seasons Condo
Seastone Townhomes
Seat Pleasant
Seat Pleasant Heights
Seaville
Seawanna Park
Seawanna Sub Of Pt
Seaward At Atlantic View Condominium
Seawatch At Jupiter Islan
Seawatch At Jupiter Island Condo
Seaway
Seaway North
Seaway Villas
Seawinds
Seawinds Condo
Sebastian Highlands
Sebastian Highlands Replat Unit 2 Page 3
Sebastian Highlands Unit
Sebastian Highlands Unit 10
Sebastian Highlands Unit 11
Sebastian Highlands Unit 12
Sebastian Highlands Unit 15
Sebastian Highlands Unit 16
Sebastian Highlands Unit 17
Sebastian Highlands Unit 2
Sebastian Highlands Unit 5
Sebastian Highlands Unit 6
Sebastian Highlands Unit 8
Sebastian Highlands Unit 9
Sebastian River Landing Phase Two Sub
Sebring
Sebring Country Est Sec 02
Sebring Country Est Sec 03
Sebring Country Estates
Sebring Hills
Sebring Hills So
Sebring Hills So Unit 2
Sebring Hills So Unit 3
Sebring Hills So Unit 4
Sebring Hills South
Sebring Hills South Unit2
Sebring Hills South West
Sebring Indian Streets
Sebring Lakes
Sebring Lakes Acres Unit 01
Sebring Lakes Unit 2 A
Sebring Lakes Unit 2 B
Sebring Lakes Unit 2 C
Sebring Lakes Unit 4 A
Sebring Manor Sub
Sebring Park
Sebring Rdg Sec C
Sebring Ridge Sec C
Sebring Ridge Sec D
Sebring Ridge Sec E
Sebring Ridge Sec F
Sebring Ridge Sec G
Sebring Summit
Sebring Sun N Lake Est
Sebrings Hills South Pb 8 Pg 93 Lot 27 Blk 2
Sec 35 Twp 17 Rge 21 Plat Book O Page 107 Marion O
Sec 44 Atriums At Snapper
Sec 48 Atriums At Snapper
Sec 7
Secane
Seclusion Shores
Second Add To Lauderdale
Second Addition Biscayne
Second Addn To Starlight
Second Amd Plat Of Norman
Second Amd Plat Of Normand
Second Antietam
Second Bayshore Condo
Second Forum Condo
Second Gulfstream Garden
Second Horizons Condo
Second Replat Of Portofino Isles
Second Westmoreland Addn
Second Wind
Section 2
Section 21 Bel-Aire
Section 22 Bel-Aire
Section Twenty Bel Aire
Sector 1 Boundary Plat
Sector 2 Boundary Plat
Sector 2- Parcels 21b 22
Sector 2- Parcels 21b 22 23 & 24
Sector 2-Parcels 1 2 3 4
Sector 2-Parcels 1 2 3 4 5 6 7
Sector 2-Parcels 12 13 14
Sector 2-Parcels 12 13 14 15
Sector 2-Parcels 17 18 19
Sector 2-Parcels 17 18 19 & 20
Sector 2-Parcels 17, 18,
Sector 2-Parcels 21a 25 2
Sector 2-Parcels 9 & 10
Sector 3 -
Sector 3 - Parcels C D E
Sector 3 - Parcels C D E F & G
Sector 3 - Parcels H I J
Sector 3 - Parcels H,I,J,K
Sector 4
Sector 4 North
Sector 5 Parcel
Sector 5 Single Family
Sector 6
Sector 6 East
Sector 7 -
Sector 7 - Parcels F G H
Sector 7 - Parcels J-2 &
Sector 7 Parcel
Sector 7 South
Sector 7 South-Parcel 1
Sector 7-Parcel N-2
Sector 7-Parcel Q
Sector 7-Parcel W
Sector 8 9 & 10 Plat(Blks
Sector 8 9 And 10
Sector El Campestre, Medelln, Antioquia, Colombia
Sector Gualdleg
Sector W In Emirates Hills
Sectors 3 & 4 Boundary Pl
Sectors 3 & 4 Boundary Plat
Sectors 8 9 And 10 Plat
Sectors 8,9 And 10 Plat
Sectors 9 And 10-Parcel H
Security Homesites
Sedgely Farms
Sedona Estates
Sedona Palms Subdivision
See Remarks
See Tax
Seemiller Harry
Segers
Segers Add In
Segovia Condo
Segovia Gardens Condo
Segovia Gardens Condominiu
Seiders Hill
Seitzland
Sel-Clar Manors
Selassie Villa
Selberg Properties K/A Ashley Villas
Selby On The Bay
Seldins Estates
Selene
Selene Condo
Selene Condominium
Selene Oceanfront
Selene Oceanfront Res
Selene Oceanfront Residen
Selene Oceanfront Residences
Seligman Ranches
Seligman-Kia Acres
Selinsgrove-Snyder County
Sella Sub
Sellersville Hgts
Sellner Estates
Selma Condo
Seminary Heights
Seminary Hill
Seminary Overlook
Seminary Park
Seminary Ridge
Seminary Springs
Seminary Valley
Seminary Walk
Seminary Woods
Seminola City Sec 2
Seminola Gardens Sub No 3
Seminole Add F R Olivers
Seminole Add F R Olivers Amen
Seminole Beach
Seminole City Sec 1
Seminole Club
Seminole Cove
Seminole Cove Condo
Seminole Cove Condominium
Seminole Estates & Townho
Seminole Estates & Townhomes
Seminole Forest
Seminole Gardens At Woodbine
Seminole Heights
Seminole Lake Townhomes
Seminole Landing
Seminole Manor
Seminole Manor 1
Seminole Manor 2
Seminole Mnr
Seminole Palms
Seminole Park
Seminole Park Green Height
Seminole Park Sub
Seminole Ranches
Seminole Woods Unit 2
Senators
Senators Walk
Senderos De Quirama 1
Seneca Chase
Seneca Crossing
Seneca Green
Seneca Harbor
Seneca Highlands
Seneca Hill
Seneca Knolls Codm
Seneca Park
Seneca Ridge
Seneca View Estates
Seneca Whetstone
Sengs Sub
Senseny Glen
Senseny Road
Senseny Village
Sentinel Of Landmark
Sentry Ridge
Sequoia Estates
Sequoia Farms
Sequoia Gardens
Sequoia Gardens I Condo
Sequoia Gardens Ii Condo
Sequoia Gardens Iii Condo
Sequoyah
Serena Vista Condo
Serenata Condominium
Serene Townhouse Village
Serenity At Cubbage Pond
Serenity On The River
Serenity On The River Con
Serenity On The River Cond
Serenity Palms Condo
Sereno Residences
Sereno Residences Condo
Serenoa Lakes Ph 2
Serenola Manor Unit 3 (Nap
Serino Sub
Serpentine Acres
Sessa Eight
Setai Resort & Residences
Seton Hill
Settle Woods
Settle Woods Sub
Settlers Bend
Settlers Landing
Settlers Ridge
Seven Acres
Seven Bridges
Seven Corners Prof Park
Seven Corners Townhomes
Seven Courts
Seven Farms At Worthington Valley
Seven Isles
Seven Lakes
Seven Locks Hills
Seven Mile Pikesville
Seven Oaks
Seven Park Residences
Seven Springs
Seven Springs 1
Seven Stars Area
Seven Valleys
Seventeen Fifty Las Olas Co-Op
Seventeenth Ave Heights
Seventeenth Green Condo
Seventeenth Place Condo
Seventh Ave Park
Seventh Horizons Condo
Severn
Severn Acres
Severn Hollow
Severn House
Severn Meadows
Severn Mobile Home Park
Severn Place
Severn Woods
Severna Park
Severna Park Gateway Village
Severndale
Sevilla Courts
Sevilla Courts Condo
Sevilla Palace At Halland
Sevilla Palace At Hallandale
Seville
Seville 6a Ph 2
Seville 6a Phase 2
Seville 6b Phase 1
Seville Condo
Seville Phase 1
Seville Townhouses Condo
Sewalls Meadow
Sewalls Point
Sewells Orchard
Sexton Cove
Sexton Coves Estates
Sexton Tract
Seybold Pointe Condo
Seychelles
Shackelford Estates
Shaddock Estates
Shade Court
Shadeland Woods
Shadow Creek
Shadow Lakes
Shadow Mountain Tracts
Shadow Oak
Shadow Oaks
Shadow Wood
Shadow Wood Condo
Shadow Woods
Shadowbrook
Shadowlawn
Shadowlawn Condo
Shadowlawn Extension Sub
Shadowood
Shadowstone
Shadowstone Village
Shady Acres
Shady Cove
Shady Cove Estates
Shady Dale
Shady Grove
Shady Grove Mhp
Shady Grove Professional Center
Shady Grove Village
Shady Hills Estates
Shady Lane
Shady Lane Estates
Shady Nook
Shady Oaks 152131517
Shady Oaks A Sub
Shady Oaks Of Palm Beach Polo & Country
Shady Park
Shady Rest
Shady Ridge
Shady Ridge Estates
Shady Side
Shadydell Park
Shadylane
Shadyside
Shadywoods Ph One
Shafer's Subdivision
Shah Valley
Shaker Village
Shaker Village Phase 1
Shaker Woods Village
Shalako Mhp
Shalamar Gardens
Shamokin
Shamrock By The Gables
Shamrock By The Gables Co
Shamrock Estates
Shamrock Townhomes
Shanarah Estates
Shand Tract
Shangri-La
Shangrila
Shannon Cove
Shannon Glen
Shannon Greene
Shannon Hill
Shannon Hills
Shannon Park Beach
Shannon Pk 1st Addn
Shannon Run
Shannon Station
Shannondale
Shannons Glen
Shanonvale 1st Addn
Sharon
Sharon Gardens
Sharon Hill
Sharon Mews
Sharpe's Subdivision
Sharpley
Sharpsburg
Sharswood
Shaw
Shawcrest
Shawcrest Island
Shawnee Acres
Shawnee Country
Shawnee Hills Development
Shawnee Land
Shawnee Woods
Shawneeland
Shawns Hideaway
Sheaffer Ridge
Shear Development Sub
Shear Groves South
Shearwater At Jonathans Landing
Shearwater Condo
Shearwood
Sheffield
Sheffield Condos A To Q
Sheffield Condos J
Sheffield Farms
Sheffield Gate
Sheffield Manor
Sheffield Woods At Wellington Condo
Sheffield/Fairway Village
Sheldon
Shell Point Beach
Shelley Farms
Shelley Gardens 3 Condo
Shellfield Shores
Shelter Cove
Shelter Islands
Shelter Islands 43-6 B
Sheltered Harbor
Shen Farms
Shen Farms Mt Lake
Shen Farms Mt View
Shen Farms Riverview
Shen Highlands
Shen River Estates
Shen Shores
Shen Valley Golf
Shenandoah
Shenandoah River Bend
Shenandoah Shores
Shenandoah County
Shenandoah Crossing
Shenandoah Crossing Country Club
Shenandoah Farms
Shenandoah Forest
Shenandoah Gap
Shenandoah Heights
Shenandoah Highlands
Shenandoah Junction
Shenandoah Land & Improvement Comp.
Shenandoah North
Shenandoah Park
Shenandoah Retreat
Shenandoah River Bend
Shenandoah Section Four
Shenandoah Section One
Shenandoah Section Two
Shenandoah Springs
Shenandoah Valley
Shenandoah Village
Shenandoah Woodlands
Shenandoah, Lake Frederick
Shenanwood
Shepard Funk
Shephard Heights 3 Addn
Shepherd Park
Shepherd Village
Shepherds Cove
Shepherds Knoll Garden
Shepherdstown District
Shepherdstowne Estates
Shepley Estates
Shepperds Grove
Sheraton Hills
Sheraton Hills East
Sheraton Plaza Unit 1
Sheraton Plaza Unit 2 Replat
Sheraton Plaza Unit 4 Replat
Sherbrooke
Sherbrooke Condo
Sherbrooke Ii Th Condo
Sherbrooke Manor
Sheridan Beach Club Condo
Sheridan Beach Club Condominium
Sheridan By The Beach Cond
Sheridan East Condo Bldg
Sheridan East Condo Bldg 1
Sheridan East Condo Bldg 2
Sheridan East Condo Bldg 3
Sheridan Estates
Sheridan Hills Sec 1
Sheridan Hills Sec One
Sheridan Lakes
Sheridan Lakes Condo
Sheridan Lakes Condo Apts
Sheridan Lakes Condo Apts No 6
Sheridan Lakes Condo Apts No 7
Sheridan Lakes Condo Apts No 9
Sheridan Lakes Condo Hous
Sheridan Lakes Condo Houses No 1
Sheridan Oaks Townhouses
Sheridan Ocean Club
Sheridan Ocean Club Condo
Sheridan Ocean Club Condominium
Sheridan Park
Sheridan Station
Sherita Condo
Sherlock Holmes Estates
Sherman Heights
Sherman Hills Sec 2
Sherman Park
Sherman Wood Ranches
Shermans Dale
Sherna Park
Sherrill Gardens
Sherry Lyn Woods
Sherry Ridge
Sherry Village
Shervettes Corner
Sherwood
Sherwood Acres
Sherwood At The Crossroads
Sherwood Codm
Sherwood Court
Sherwood Forest
Sherwood Forest Ii
Sherwood Forest Manor
Sherwood Forest Shores
Sherwood Forrest
Sherwood Gardens Condo
Sherwood Heights
Sherwood Lakes
Sherwood Lakes Plat No 2
Sherwood Manor
Sherwood On The River
Sherwood Park
Sherwood Park Ii
Sherwood Pk Repl Blks 7 To
Sherwood Square
Sherwood Square Condomini
Sherwood Square Condominium
Sherwood Village Condo
Sherwood West
Shickle Lots
Shillington
Shiloh
Shiloh Acres Ii
Shiloh Farms
Shiloh Ridge
Shingle Camp
Shingle Creek Reserve
Ship Bottom
Shipbuilders Village
Shipley
Shipley Heights
Shipley Hill
Shipley Homestead
Shipley Property
Shipleys Choice
Shipleys Grant
Shipleys Retreat
Shipoke
Shippensburg
Shippensburg Borough
Shippensburg Mobile Estates
Shippensburg Township
Shippensburg Twp
Shippensburg Village
Shipwreck Farm
Shire, The First Addition
Shireman Manor
Shires Crossing
Shireton
Shirley Acres
Shirley Gate Park
Shirley Heights
Shirley Ridge
Shirlington Crest
Shoal Creek At Lighthouse
Shoal Creek At Lighthouse Point
Shockley Subdivision
Shoma Bay
Shoma Condo At Keys Cove
Shoma Courtyards
Shoma Courtyards 3 At Royal Palm Condo
Shoma Courtyards At Royal Palm Beach
Shoma Courtyards I At Roy
Shoma Courtyards I At Royal Palm Condomi
Shoma Courtyards I At Royal Palm Condominiums
Shoma Courtyards Ii At Ro
Shoma Courtyards Ii At Royal Palm Condom
Shoma Estates
Shoma Homes At Country Cl
Shoma Homes At Imperial L
Shoma Homes At Kendall
Shoma Homes At Tamiami Ii
Shoma Homes At Tamiami Iv
Shoma Townhomes At Keysco
Shoma Townhomes At Royal
Shoma Townhomes At Royal Palm Beach Condo
Shoma Villas Ii At Countr
Shoma Villas Ii At Royal Palm Condoiu
Shon-Mor Estates Sec 2
Shopes Garden
Shore Acres
Shore Acres Amd Pl
Shore Club Apts A Inc
Shore Club Apts B & C Cond
Shore Club Apts B & C Condo
Shore Club Apts.
Shore Club Condo
Shore Crest
Shore South - Ortley Beach
Shore View
Shore Village Unrec
Shore Village Unrecorded
Shore Vista
Shorecrest
Shoreham Beach
Shoreland
Shoreland Co-Op
Shores 01
Shores 2
Shores 5
Shores At Boca Raton Ph 0
Shores At Boca Raton Ph 2
Shores At Keys Gate
Shores At Wellington
Shores At Wellington Condo
Shores At Wellington Ii C
Shores At Wellington Ii Condo
Shores Lindgren
Shores Of Calvert
Shores Plaza West Condo
Shores Pointe
Shores Villas Condo Bldg
Shores-Calusa
Shoreview Woods
Shoreway Sub
Shorewood
Shorewood Estate
Shorewood Estates
Short Gap
Short Hills
Short Mountain Heights
Shouse Village
Showfield
Shraders Haven
Shreiner Village
Shreve Road
Shrewsbury
Shrewsbury Boro
Shrewsbury Twp
Shutters Condo
Shy Beaver Lakeview Estates
Sian Ocean Residences
Sian Ocean Residences Con
Sian Ocean Residences Condo
Siena
Siena At Deering Bay
Siena Lakes At Venetian Isles
Siena North
Siena Oaks
Siena Place
Siena Reserve
Siena Reserve South
Siena Reserve West
Sienna
Sienna Club
Sienna Reserve
Sienna Reserve South
Sienna Villas Condo
Sierra
Sierra Bay
Sierra Bay Aka Villa Rosa
Sierra Condo Apts
Sierra Cove At Addison Village
Sierra Del Mar
Sierra Heights
Sierra Landing Codm
Sierra Meadows
Sierra Mirada
Sierra Mirada 3rd Addn Re
Sierra Mirada Sec 1 4th A
Sierra Ridge
Sierra Ridge Condo B
Sierra Ridge Condo E-2
Sierra Ridge Condo H
Sierra Ridge Condo M-41
Sierra View-Chestnuthill Twp
Sierra View-Tunkhannock
Sierra Woods Condo
Siesta Properties Inc Unit 1
Signal Hill
Signal Hill Station
Signature Club
Signature Club At Greenview
Signature Place
Signature Property Management
Silas Sines
Silkwood
Sillery Bay
Silo Acres
Silo Point
Siloam Acres
Silver Beach Condo One
Silver Belle
Silver Bluff
Silver Bluff Est Sec C
Silver Bluff Est-Sec B
Silver Bluff Est-Sec C
Silver Bluff Ests-Sec A
Silver Bluff Gardens
Silver Bluff Hmsts
Silver Bluff Homesites
Silver Brook
Silver Creek
Silver Crest
Silver Cup
Silver Falls
Silver Falls Pod
Silver Gardens Villas Con
Silver Hill
Silver Hill Heights
Silver Hill Manor Apts Co
Silver Lake
Silver Lake Estates
Silver Lake Manor
Silver Lake Park Addition
Silver Lake Park Subdivis
Silver Lake Park Subdivision
Silver Lakes At Pembroke
Silver Lakes At Pembroke Pines
Silver Lakes Ph 111 Repla
Silver Lakes Phase Ii Rep
Silver Lakes Phase Ii Replat
Silver Lakes Phase Iii
Silver Lakes Phase Iii Pa
Silver Lakes Phase Iii Re
Silver Lakes Phase Iii Replat
Silver Lakes Sec 1
Silver Lakes Sec 1 Amend
Silver Lakes West Amend
Silver Leaf Estates
Silver Oaks Estates
Silver Palm
Silver Palm Acres
Silver Palm City
Silver Palm East Sec Four
Silver Palm East Sec Thre
Silver Palm East Sec Two
Silver Palm East Section
Silver Palm Ests Pt 1
Silver Palm Homes
Silver Palm Lake
Silver Palm Park
Silver Palm Residential H
Silver Palm Residential Ho
Silver Palm Residential Homes
Silver Palm Southwest
Silver Palm Villas
Silver Palm West
Silver Palms
Silver Palms At Dadeland
Silver Palms Midtown
Silver Palms Rv Resort
Silver Palms Rv Village
Silver Palms Rv Village P
Silver Parc
Silver Park West
Silver Preserve
Silver Ridge
Silver Ridge Park - Silver Ridge Park North
Silver Ridge Park - Silver Ridge Park West
Silver Ridge Ph 2
Silver Rock
Silver Run
Silver Sands
Silver Shores
Silver Shores (Parcels A
Silver Shores (Parcels A Thru G)
Silver Shores (Parcels H
Silver Shores (Parcels H Thru I)
Silver Shores Mobile Home
Silver Shores Parcels A T
Silver Shores Sec Of Laud
Silver Shores Sec Of Lauderdale
Silver Shores Sky230 Sky 230
Silver Shores Unit
Silver Shores-Sub Tract
Silver Sogs Shore Un #21
Silver Spgs Shores Un 07
Silver Spgs Shores Un 12
Silver Spgs Shores Un 31
Silver Spgs Shores Un 36
Silver Spring
Silver Spring Cntry Club
Silver Spring Ranches
Silver Spring Shore Unite
Silver Spring Shores
Silver Spring Tower Condo
Silver Spring Twp
Silver Springs Heights
Silver Springs Shore
Silver Springs Shores
Silver Springs Shores # 31
Silver Springs Shores #44
Silver Springs Shores Lt37
Silver Springs Shores Lt38
Silver Springs Shores Lt42
Silver Springs Shores Unit
Silver Springs Shores Unit 04
Silver Springs Shores Unit 09
Silver Springs Shores Unit 16
Silver Springs Shores Unit 19
Silver Springs Shores Unit 28
Silver Springs Shores Unit 37
Silver Thatch
Silver Thatch Atlantic Pl
Silver Thatch Atlantic Plaza
Silver Thatch Atlantic Plaza Condo
Silver Thatch Intracoasta
Silver Thatch Intracoastal
Silver Thatch Intrracoast
Silver Tree Landing
Silver Tree Suites
Silver Woods
Silver Woods Ph Ii
Silverbrook Farms
Silverbrook Wood
Silvercrest Addition Unit 2
Silvercrest Lake Estates
Silvergate
Silvergate Village
Silverton
Silverton - Green Island
Silverton Codm
Silverview Farm Mhp
Silverwood
Silverwood At Ave Maria
Silverwood At Ave Maria Ph
Silverwood/Ave Maria Ph 2
Silview
Simme Valley Estates
Simmons Acres
Simmons Acres Plat 17
Simmons Acres Plat 5
Simmons Acres-Addn
Simmons Ridge
Simmons S/D Pts Sibbald &
Simms
Simonds Gardens
Simons Plat
Simpson
Simpson Bay Sint Maarten
Simpsons Crossing
Sims Creek Ph Ii
Sinclair Park
Sindamanoy
Sindons Subdivision
Singer
Singer Sub No 2
Singer Woods
Singletons Grove
Singletree
Sinking Spring
Sinking Springs
Sirene Villas
Sitio Urucum
Six Lakes
Six Lakes West
Six Palms
Six Senses Residence
Sixth & Rio
Sixth Horizons Condo
Sixth Moorings Condo
Sixth&Rio
Skippack
Skipton
Sky 360 Villas Condo
Sky Bryce
Sky Bryce Subdivision
Sky Cove
Sky Cove Phase 1 A
Sky Cove South
Sky Cove South Phase 1 A
Sky Cove South Phase 1 B
Sky Duo
Sky Harbour East
Sky Harbour East Condo
Sky Lake
Sky Lake 1
Sky Lake 2
Sky Lake 3
Sky Lake Estates
Sky Lake Gardens No 1 Con
Sky Lake Gardens No 3 Con
Sky Lake Gardens No 3 Condo
Sky Lake Gardens No 4 Con
Sky Lake Villas
Sky Lake Villas - Californ
Sky Lake Villas 2nd Addn Pb108-60
Sky Lake Villas First Add
Sky Lake Villas First Addn To
Sky Line
Sky Ranch
Sky Ranch Estates
Sky Ranch Townhomes
Sky Valley
Sky Vista
Sky Vista 3rd Addn
Sky Vista 5th Addn
Sky-Lin Park
Skyknoll Estates Replat
Skylake
Skylake Sub Sec
Skylake Sub Sec B
Skyland Estates
Skyline
Skyline 1st Addn
Skyline Bend Farm
Skyline Courts
Skyline Forest
Skyline Heights
Skyline Hills
Skyline Hills Plat Five
Skyline House
Skyline Lakes
Skyline On Brickell Condo
Skyline Plaza
Skyline Square Condo
Skyline Towers
Skyview
Skyview Drive
Skyview Meadows
Skyview Park
Slade
Slade Condo
Slae26 Sun N Lakes Estates
Slae75 Sun N Lakes Estates
Slae76 Sun N Lakes Estates
Slate Run Farm
Slatington
Slaughter Beach
Sleep Hollow Amended
Sleepy Creek Farms
Sleepy Creek Orchard
Sleepy Hollow
Sleepy Hollow 1
Sleepy Hollow Estates
Sleepy Hollow Manor
Sleepy Hollow Woods
Sleepy River Acres Add
Sleepy Shores
Sligo Park Hills
Sligo Park Hills Th
Sligo Park Knolls
Sloan Hammock Land Condo
Sloan Tract
Sloop Pointe
Sls
Sls Brickell
Sls Lux
Sls Lux Brickell
Sls Lux Brickell Hotel
Sls Lux Residences
Sm One Loudoun Condo
Smalls Nursery
Smallwood Est Sub
Smallwood Estates
Smart Brickel Condo
Smart Brickell
Smart Brickell Condo
Smart Brickell Lodging
Smart Brickell Lodging 1 C
Smathers Four Fillies Far
Smith & Daugherty
Smith Dairy West 4
Smith Dairy West 7 Ph 2
Smith Dairy West 8
Smith Dairy West Pud 1
Smith Dairy West Pud 10
Smith Home Farm
Smith Island
Smith Lake Estates
Smith Mill Farms
Smith Plaza
Smithfield
Smithsburg
Smithtown
Smithville
Smithwood Manor
Smoke Hole Road
Smoketree
Smokey Run
Smyrna
Smyrna Landing
Smza 20
Snader's Summit
Snapper Creek Estates Sec
Snapper Creek Groves
Snapper Creek Lakes Sub
Snapper Creek Oaks
Snapper Creek Townhouses
Snapper Creek Townhouses Sec 3
Snapper Creek Village Amd
Snapper Creek Villas
Snapper Creek West Sec 2
Snapper Village Condo Pha
Snapper Village Ph 2 Sec
Snapper Village Phase 2 S
Snapper Village Phase Ii
Snook Hole
Snow Hill
Snow Hill Estates
Snow Ridge Village
Snow Shoe
Snow Shoe Mountain Forest
Snowball Gate
Snowden Bridge
Snowden Oaks
Snowden Overlook
Snowdens Manor
Snowdens Mill
Snowy Creek Estate
Snuff Mill
Snug Harbor
Snug Harbor Condo
Snug Harbor Gardens
Snug Harbor Gardens Condo
Snug Harbor S F Condo Land Files
Snug Harbor Sec Four
Snug Harbor Sec One
Snug Harbor Sec Three
Snug Harbor Sec Two
Snug Harbor Village Sec 1
Snyder County
So Allapattah Gardens
So Gulf Waterway Ben Unit
So Highland Estates
So Miami Gdn Heights
So Miami Heights Addn D
So Miami Heights Addn E
So Miami Heights Addn N
So Miami Heights Addn V
So Miami Heights Manor
Sobe Phoenix Condo
Sobe Village Condo
Society Court
Society Hil
Society Hill
Society Hill Cannongate
Society Hill I
Society Hill I Hamil
Society Hill Ii
Society Hill Ii Hami
Society Hill Lawrenc
Society Pl
Sodus Manor Sub
Soggy Bay
Soho Paradisus
Soigne Plat
Solana Bay
Solana Bay At Avenir
Solana Condo
Solara Resort Vacation
Solara Resort Vacation Vil
Sole At Fort Lauderdale
Sole At Fort Lauderdale C
Sole At Fort Lauderdale Condo
Sole Condo
Sole Mia
Solebury
Solebury Twp
Soleil At Fontainebleau C
Soleil Lake Condo
Solemar Condominium
Solemar Pompano Beach
Solena
Solimar At Boca Del Mar Ph 1
Solimar At Boca Del Mar Ph 3
Solimar Condo
Solis Grande
Solley
Solley Heights
Solomons Island
Solomons Landing
Solstice
Solterra
Solterra Phase 2d
Solterra Radiance
Sombrero Anglers Club Sou
Sombrero Beach Village
Somers Point
Somerset
Somerset At Abacoa Condo
Somerset At Belair
Somerset At Laud Lakes
Somerset At Lauderdale La
Somerset At Lauderdale Lak
Somerset At Lauderdale Lakes
Somerset At Westridge
Somerset Condominiums
Somerset Condos
Somerset Estates Community
Somerset Four Replat
Somerset Green
Somerset House
Somerset House Condos
Somerset Ii South
Somerset Lake
Somerset Lakes Condo
Somerset Landing
Somerset Lauderdale Lakes
Somerset No 1 Condo
Somerset No 2 Condo
Somerset No 3 Condo
Somerset No 4 Condo
Somerset No Eight Condo
Somerset No Seven Condo
Somerset No Six Condo
Somerset Park
Somerset Park Condo Phas
Somerset Plaza
Somerset Sub
Somerton
Somerton Chase
Somerton Ests
Sommerfield
Sommerset At Jacaranda
Sommerset Condominiums
Sonara At Malibu Bay
Sonata At Mission Bay
Sonoma Bay
Sonoma Isles
Sonoma Lake Condo
Sonoma Resort At Tapestry Ph 1
Sopetran Antioquia
Sopetrn Antioquia
Sophia Frey
Sophia Seneca Estates
Sorrell Court
Sorrento Lakes
Sorrento Lakes At Sunrise
Sorrento Lakes At Sunrise Point
Sorrento Townhomes
Soto Mansions
Sotogrande
Sound View Acres
Sourthern Colonization
South 12th St Area
South 620
South Addison Hghts Town
South Allapattah Terr
South Annville Twp.
South Baltimore
South Bank
South Bay
South Bay Club
South Bay Club Condo
South Bay Estates
South Beechwood
South Bend Area
South Bethany Harbor
South Bowers
South Brick Condo
South Bridge
South Brook
South Broward Ranches
South Broward Ranches No
South Broward Ranches No 2
South Camden
South Carillon Beach
South Carillon Beach Cond
South Coatesville
South Coral Homes Sec 2
South Creek Village
South Dania Heights Amen
South Dania Heights Amen Plat
South Dorchester
South Dover Acres
South Dover Manor
South Eastern York Co
South Easton
South Edison
South End
South Essex
South Flagler Condo
South Florida Wmd
South Fork
South Fork Crossing
South Fork Estates
South Fork Estates 55-2 B
South Fork Ests
South Fort Foote Village
South Forty
South Four Corners
South Garden Condo Of Dee
South Garden Condo Of Deerfield
South Glymont Sub
South Golf Cove
South Greenway
South Guilford
South Guilford Hills
South Gulf Cove
South Hampton
South Hampton Sub
South Hanover
South Hanover Township
South Heidelberg
South Hill Estates
South Hills
South Hollywood Amd Plat
South Kendall Townhomes
South Kensington
South Lake
South Lake Condo
South Lake Conds One
South Lake Villas Condo
South Lakes Subdivision
South Lancaster
South Landing Estates
South Lebanon Area
South Lebanon Township
South Leisure By The Sea Condo
South Londonderry
South Market
South Meadows
South Media
South Miami
South Miami Garden Height
South Miami Gdn Heights 1
South Miami Heights 1st A
South Miami Heights 2nd A
South Miami Heights Addn
South Miami Heights Addn X
South Miami Hgts Add B
South Miami Hgts Addn C
South Miami Lakes
South Middle River
South Middleton Twp
South Mitchell Manors
South Moon Under Sub
South Mountain
South Mountain Village
South New River Isles
South New River Isles Sec
South Newberry St
South Oaks
South Of Southern
South Palm Beach Estates
South Palm Beach Villas Condo
South Palm Park
South Palm Place Condo
South Palm Residence Inc
South Passage
South Piscataway
South Pointe
South Pointe Cove Condo
South Pointe Ii
South Pointe Towers Condo
South Port Saint Lucie Unit 16
South Port St Lucie
South Port St Lucie Unit
South Port St Lucie Unit 1
South Port St Lucie Unit 10
South Port St Lucie Unit 14
South Port St Lucie Unit 15
South Port St Lucie Unit 16
South Port St Lucie Unit 16 1st Replat
South Port St Lucie Unit 17
South Port St Lucie Unit 19
South Port St Lucie Unit 4
South Port St Lucie Unit 5
South Port St Lucie Unit 6
South Port St Lucie Unit 7
South Port St Lucie Unit 8
South Port St Lucie Unit 9
South Potomac Forest
South Punta Gorda Heights
South Punta Gorda Hgts
South Queen Townhouses
South Redland
South Rehoboth
South Riding
South River Boro
South River Colony
South River Colony Unrec
South River Landing
South River Town
South River Village 01 Condo
South River Village 03 Condo
South River Village 04 Condo
South River Village Condo
South Road Pud
South Run Forest
South Run Oaks
South Saint George
South Sea Islanderc Condo
South Seas West Condo Apts
South Shenandoah
South Shore
South Shore 1 Of Wellingt
South Shore 1 Of Wellington
South Shore 1 Of Wellington, Lakeside Shores
South Shore 1, Lakeside Shores
South Shore 3 Of Wellington
South Shore 4 Of Wellin
South Shore 4 Of Wellingt
South Shore 4 Of Wellington
South Shore Harbour Codm
South Shore Marina
South Shore Yacht And Gol
South Shores
South Side Of City
South Side Park
South Springs
South Springs Homes
South Tamaqua
South Temple Heigh
South Tower At The Point
South Tower At The Point Condo
South Treeview Estates
South Twenty-Fifth Street Replat
South Two Seven Lofts Con
South View
South Wales
South West
South West Lancaster
South West Waters
South Winds Condo
South Woods
South York
Southall Meadows
Southampton
Southampton Condo
Southampton Condo A,B,C
Southampton Condo A-C
Southampton Condominium
Southampton Condominium F
Southampton Condominium G
Southampton Condominium I
Southampton Condominium J
Southampton Forest
Southampton Twp
Southampton/Franklin Co.
Southaven
Southbend
Southbend Lakes
Southbend Manor
Southbend Port St Lucie Section 39
Southbend, South Bend
Southboro Park
Southbridge
Southbrook Park
Southcoate Village
Southdale Condo
Southdown Estates
Southdown Shores
Southeast Lehigh
Southeast Park Condo
Southeastern Mexico
Southerland Sub
Southerly Hill
Southern Blvd Park
Southern Boulevard Pines
Southern Colonizat Co
Southern Colonization
Southern Colonization - Viking
Southern Colonization Co
Southern Colonization Co 29
Southern Colonization Comp
Southern Colonization Company
Southern Colonization Company Plat
Southern Colonization Company T34s R33e
Southern Colonization Companys
Southern Colonization Subdivision
Southern Colonization/Prairie
Southern Courtyard Town Homes
Southern Cove
Southern Estates 13th Add
Southern Estates 9th Addn
Southern Ests 2nd Addn
Southern Ests 4th Addn
Southern Ests 6th Addn
Southern Ests 7th Addn Se
Southern Flds
Southern Grove Parcel 28
Southern Grove Parcel 28 Replat
Southern Hills
Southern Hills Plantation
Southern Hills Plantation Ph 2
Southern Homesteads
Southern Meadows
Southern Pine Addition
Southern Pine Villas
Southern Pines
Southern Reading
Southern Seas Condo
Southern Slopes
Southern Star Condo
Southern Star Stables
Southern Star Stables Subdivision
Southern View
Southern Village
Southern Woods/Smw Phase Iv
Southfield At Whitemarsh
Southfields
Southfields Wellington Country
Southgate
Southgate Center
Southgate Condo
Southgate Gardens Condo
Southgate Second Add
Southgate Square Cluster
Southgate Village
Southgate Villas Condo
Southgate Woods Townhouses
Southglen At University Center
Southlake At Montclair
Southlake Condominium
Southland Hills
Southland Park
Southland Park Add In
Southland Pines
Southpoint
Southpoint Commons
Southpoint Condo
Southpoint Condominium
Southpoint Of Hershey
Southpointe
Southport At Hunters Run Condo
Southport Landing
Southport On The Bay Unit One
Southport Square Condo
Southport Townhomes
Southporte One At Jonathans Landing Condo
Southridge
Southridge Village Homes
Southshore Falls Phase 1
Southside
Southside Crossing
Southside Landing
Southview
Southview 08
Southview At Aventura Con
Southview At Aventura Condo
Southview Farm
Southwark On Reed
Southwest Addition
Southwest Baltimore
Southwest Center City
Southwest Manors Sec 4
Southwest Manors Sec 8pb
Southwest Pines
Southwest Reading
Southwest Schuylkill
Southwest Waterfront
Southwind
Southwind Point
Southwind Shores
Southwinds
Southwinds At Boca Pointe
Southwinds At Boca Pointe Condo
Southwinds At Crosswinds Condo
Southwood
Southwood 5th Addn
Southwood 6th Addn
Southwood 8th Addn
Southwood Condominium
Southwood Crossing
Southwood Heights
Southwood Unit 25
Southwoods
Sovereign Village
Sovereigns Condo
Soverel Harbour Marina
Sowe Neighborhood / Cabbage Hill
Spa At Sunset Isles Condo
Space 01 Condo
Spangler Meadows
Spanish Court
Spanish Isles Ii
Spanish Lake Golf Village
Spanish Lakes
Spanish Lakes 1
Spanish Lakes 1st Addn
Spanish Lakes Cc Village Leasehold Estates
Spanish Lakes Country Club
Spanish Lakes Country Club Vill Leasehold Estates
Spanish Lakes Country Club Village
Spanish Lakes Fairways
Spanish Lakes Fairways Le
Spanish Lakes Fairways Leasehold Estates
Spanish Lakes Fairways Ne Phase
Spanish Lakes Golf V
Spanish Lakes Golf Village
Spanish Lakes Golf Village Community
Spanish Lakes I
Spanish Lakes One
Spanish Lakes One Leaseho
Spanish Lakes One Leasehold Estates
Spanish Lakes Riverfront
Spanish Lakes Riverfront Leasehold Estates
Spanish Lakes, Riverfront
Spanish Oaks
Spanish Oaks Condo
Spanish River Land
Spanish River Land Co A
Spanish River Land Co Sub
Spanish River Land Co Sub Unit 1
Spanish River Land Co Sub Unit 2
Spanish River Land Co Sub Unit 3
Spanish River Land- The Estates
Spanish Trace Condo
Spanish Village
Spanish Villas Condo
Spanish Wells
Spanish Wells Condo I
Spanish Wells Condo Ii
Spar-Rich Resub Of Blks 2
Sparks
Sparks Glencoe
Sparks Tract
Sparrow Run
Sparrows Point
Sparrows Walk Condo
Sparta Rd North End
Spartan Village
Spaulding Heights
Spaulding Knolls
Spear Acres
Spear At Aqua Condo
Spectrum At Reunion
Speedway
Spenceola Farms
Spenceola North
Spencer Lakes 1
Spencer Place Condo
Spencerville
Sperryville
Spg Hts
Spiaggia Ocean Condo
Spicer's Run At Bolton Hill
Spicewood Sub
Spicewood Subdivision
Spiering
Spiering Estates
Spinnaker Bay At Lake Cha
Spinnaker Bay At Lake Charleston
Spinnaker Point Condominium
Spinnerstown Cross
Spinnler Point
Spirit Of Sebastian
Spirit Of Sebastian Pud - Pod 1b-1
Split Rock
Sport Acres
Sportsmans Haven 1st Addn
Sportsmans Paradise
Spot Lots
Spotslee
Spotswood North
Spotsylvania
Spotsylvania County
Spout Run Terrace
Spray Beach
Spring Acres
Spring Arbor
Spring Arts
Spring Bank
Spring Branch
Spring Branch Estates
Spring Breeze
Spring Brook Estates
Spring Cove
Spring Cove Condo
Spring Creek
Spring Forge
Spring Garden
Spring Garden Estates
Spring Garden Meadows
Spring Garden Twp
Spring Gardens Unit 1
Spring Glen
Spring Grove
Spring Grove Boro
Spring Grove Farm
Spring Haven
Spring Hill
Spring Hill Acres
Spring Hill Farm
Spring Hill Unit 1
Spring Hill Unit 23
Spring Hill Unit 9
Spring Hills
Spring Hills Villas
Spring Hollow
Spring Hollow Estates
Spring Hope Estates
Spring Isle Unit 3
Spring Knoll
Spring Lake
Spring Lake Farm
Spring Lake Farms
Spring Lake Garden Condominium
Spring Lake Vill 01
Spring Lake Vill 03
Spring Lake Vill 04
Spring Lake Vill 05
Spring Lake Vill 06
Spring Lake Village
Spring Lake Village I
Spring Lake Village Ii
Spring Lake Village Iii
Spring Lake Village Vi
Spring Lake Village Vii
Spring Lake Villas
Spring Lake Villiage
Spring Lake Villlage Viii
Spring Lakes
Spring Lakes Village Ii
Spring Meadow
Spring Meadow Reserve
Spring Meadows
Spring Meadows Condo
Spring Mill
Spring Mills
Spring Mount
Spring Mount Summi
Spring Oak Ests
Spring Oaks
Spring Ridge
Spring Ridge Crossin
Spring Ridge Estates
Spring Run Acres
Spring Run Estates
Spring Tide Apts Co-Op
Spring Town Farms
Spring Valley
Spring Valley Estates
Spring Valley Farm
Spring Valley Phase Iii
Spring Valley Villag
Spring Valley Westfork
Spring View
Spring View Estates
Spring View Farms
Springbank
Springbank Park
Springbank Park Sec 2
Springbrook
Springbrook Condos
Springbrook Farms
Springbrook Manor
Springbrook Village
Springcrest Condo
Springdale
Springdale Estates
Springdale Farm
Springdale Homes
Springdale Lake B Condo
Springdale Prof Center
Springettsbury
Springettsbury Twp
Springfield
Springfield Chase
Springfield Court
Springfield Green
Springfield Manor
Springfield Manor Cluster
Springfield Oaks
Springfield Twp
Springhaven Walk
Springhaven Woods
Springhill Farm
Springhouse Farms
Springhouse Station
Springhouse West
Springlake
Springlake Ii
Springlea
Springmill
Springridge
Springs
Springs At Shepherdstown
Springs Colony Club Condo
Springs Gateway
Springs Park Condo
Springs Towers Condo
Springs Townhomes Condo
Springside
Springside Park
Springton Pointe Woods
Springton Village
Springton Woods
Springtree
Springtree Lakes
Springtree Lakes Tr 32
Springtree West
Springvale
Springview
Springwood
Springwood Condo
Springwood Estates
Springwood Green
Springwood Hills
Springwood Village
Sproul Estates
Spruce Creek Iii
Spruce Creek South
Spruce Hill
Spruce Hill Estates
Spruce Hill North
Spruce Meadows
Spruce Mill
Spruce Park Sub
Spruce Pine Hollow
Spruces
Spy Hill
Spyglass
Spyglass At Admirals Cove Condo
Spyglass At Pga Village
Spyglass Condominium 1
Spyglass Hill
Spyglass Walk Condo
Spykes Grove
Square Lake
Squire Hill Condo
Squirrel Hill
Sr 510
St Albans Park
St Andrew's Estates
St Andrews
St Andrews At Boynton Bea
St Andrews At Boynton Beach Condo
St Andrews At Polo Club C
St Andrews At Polo Club Condo
St Andrews Condo
St Andrews Country Club
St Andrews Country Club 10
St Andrews Country Club 14
St Andrews Country Club 2
St Andrews Country Club 4
St Andrews Court Condo
St Andrews Of Sherbrooke
St Andrews Palm Beach
St Andrews Palm Beach Condo I
St Andrews Townhomes
St Andrews Townhomes Replat No 1
St Anne
St Asaph Square
St Catherines Island-Oak Harbor
St Charles
St Charles - Carrington
St Charles Bannister
St Charles Carrington
St Charles Dorchester
St Charles Gleneagles
St Charles Hampshire
St Charles Horizon
St Charles Huntington
St Charles Lancaster
St Charles Sub
St Charles Sub - Bannister
St Charles Sub - Carrington
St Charles Sub - Dorchester
St Charles Sub - Fieldside
St Charles Sub - Gleneagles
St Charles Sub - Hampshire
St Charles Sub - Heritage
St Charles Sub - Huntington
St Charles Sub - Lancaster
St Charles Sub - Sheffield
St Charles Sub - Wakefield
St Charles Sub Restricti
St Charles Towns
St Charles Wakefield
St Clair
St Clements Wood
St Cloud 2nd Plat Town
St Elmo
St Francis Apts Co-Op
St George House Condo
St George Island
St Georges
St Georges Hundred
St Helen's Crossing
St James
St James Area
St James Bay
St James City
St James Court West Amen
St James Golf Club Parcel A
St James Golf Club Parcel B Phase 1
St James Golf Club Parcel C Phase 1
St James Golf Club Parcel D Phase I
St James Golf Club Pod E Phase 1
St James Golf Club Pod E Phase Ii
St James Golf Club Pod F
St James Park
St James Park North
St James Park Northeast P
St James Park Second Add
St James Park South Add
St James Park West Add
St James Place
St James Plat
St James Subd
St Jeromes
St John's Woods
St Johns Drainage District Unit 1
St Johns Riverside Estates
St Johns Village
St Jones Commons
St Josephs Court
St Jude Harbors
St Leonard Shores
St Leonards Tra
St Lucie Business Park
St Lucie Center Replat
St Lucie Club And Apartment Homes Condo
St Lucie Club&Apt Hms Bldg D
St Lucie Estates
St Lucie Falls
St Lucie Falls (Aka River Forest)
St Lucie Gardens Sub
St Lucie Gardens Subdivision
St Lucie Inlet Farms
St Lucie Park
St Lucie River Heights
St Lucie Settlement Unrecorded
St Lucie Vista Estates
St Lucie West Plat No 36
St Lucie West 134 Lake Charles Ph 3f
St Lucie West 55 Lake Charles Ph 1a
St Lucie West Plat No 197
St Maarten At Grand Bay C
St Maarten At Grand Bay Co
St Margarets Landing
St Martins Retreat
St Marys Beach
St Moritz
St Moritz At Doral Condo
St Moritz Estates
St Mortiz At Doral
St Mortiz At Doral Condo
St Regis Bal Harbour
St Regis Residences Condo
St Regis South
St Regis Sunny Isles
St Remy Condo
St Thomas
St Thomas Twp
St Tropez Ocean Condo
St Tropez On The Bay
St Tropez On The Bay 1 Co
St Tropez On The Bay Ii C
St Tropez On The Bay Ii Condo
St Tropez On The Bay Iii
St. Andrews Palm Beach
St. Augustine South
St. Charles
St. Charles Gleneagles South
St. Charles Towns
St. Charles, Gleneagles South
St. Clair Farm
St. George
St. Jerome's Crossroads
St. JohnS Riverside Estates
St. Mary's Beach
St. Michaels
St. Regis Bal Harbour
St. Regis Residences
Stablehill
Stadium District
Stafford
Stafford County
Stafford Estates
Stafford Glen
Stafford Heights
Stafford Lakes Village
Stafford Meadows
Stafford Mews
Stafford Pointe
Staffordshire
Staffordshire Farm
Stagecoach
Stagecoach Stop
Stagg Run
Stallman Sub Plt 18-69
Stamford At Sunset Trace
Stamford At Sunset Trace Md 36
Stamford At The Villages Of Palm Beach L
Stamm 917 Ne 8th Avenue
Stan Haven
Stanbrook
Stanford Sub
Stanley
Stanley Heights
Stanley Va
Stansbury
Stanton
Stanton House Condo
Stanwick Glen
Stanwood
Stapleton Court Garden
Star Acres
Star Fort
Star Hill
Star Island
Star Lake Estates No 15 C
Star Lake Estates No 29 C
Star Lake Estates No 30 C
Star Lake Estates No 4 Co
Star Lakes Estates No 21
Star Lakes Estates No 3 C
Star Lakes Estates No 5 C
Star Lakes Estates No 6 C
Star Lakes Estates No 8 C
Star Lakes Estates No 8 Condo
Star Lofts On The Bay Con
Star Meridian Condo
Star Paradise Condo
Starfield Farms
Starfish Condos
Starlight
Starlight 1st Addn
Starlight Landing
Starlight Meadows
Starlight Towers Condo
Starling Court At Martin Downs (Aka Martin Downs P
Starlite Condo
Starnes Subdivision
Starpoint
Starview
Starview Countryside
Starwood Phase N-1b North
State College Boro
State Park Road
Station East
Station North Arts District
Station Sq At Ambler
Station Square
Staubs Thurmont Acres
Staunton
Stearns Crossing
Stedwick
Stedwick Townhouses
Steele
Steele Land Dev
Steeles Ridge
Steelpointe
Steelton
Steelton Borough
Steeple Chase
Steeple Glenn
Steeplechase
Steeplechase / Polo Club
Steeplechase At Eagle Tra
Steeplechase Village
Stein Assemblage
Stein Assemblange
Stellar Pembroke Pines
Stenning Hills
Stenning Woods
Stephanie Sub
Stephen Knolls
Stephen Manor
Stephens Ridge
Stepney Fields
Steppes Of Barcroft
Sterling
Sterling Park
Sterling Arms
Sterling Bridge
Sterling Codm
Sterling Crossing
Sterling Estates
Sterling Fifty-Six Condo
Sterling Hill Ph 1a
Sterling Ranch
Sterling Village
Sterling Village 150 Condo
Sterling Village 170 Condo
Sterling Village 200 Condo
Sterling Village 240 Condo
Sterling Village 300 Condo
Sterling Village 350 Condo
Sterling Village 370 Condo
Sterling Village 460 Condo
Sterling Village 480 Condo
Sterling Village 680 Condo
Sterling Village 740 Condo
Sterling Village 800 Condo
Sterling Village 880 Condo
Sterling Villages Of Palm
Sterling Villages Of Palm Beach Lakes Condo
Stevens
Stevens Forest
Stevens Homesites No 2
Stevens Homesites No 3
Stevens Park Unit No 1
Stevens Park Unit No 2
Stevensburg
Stevenson
Stevenson Crossing
Stevenson Estates
Stevenson Park
Stevenson Square
Stevenson Village
Stevenson Village Condo
Stevensville
Stever Mills
Stewarts Landing
Stewartstown
Stewartstown Boro
Stewartstown Station
Still Pond
Still Pond Creek
Stillmeadows
Stillmeadows Condo
Stillpond
Stillwate Lakes Civi
Stillwater Estates
Stillwater Lake Est
Stillwater Lakes Civic Assoc.
Stillwright Point No 2
Stilwater
Stilwell Isles
Stilwell Isles Isle Of Pa
Stilwell Isles Isle Of Palms
Stilwell Isles Isles Of P
Stilwell Isles Isles Of Palms
Stinson
Stinson Hall
Stirling Lake
Stirling Oaks Estates
Stirling Palm Estates
Stirrup Key Subd
Stj14 St. Johns River
Stj26 St. Johns River
Stj34 St. Johns River
Stkbrdge At Tanglwd Cod
Stockbridge Condo
Stockdale
Stockley Subdivision
Stockman Estates
Stockton
Stockton Address
Stockton Ave
Stockton Boro
Stockton Run
Stocton
Stone Creek At Wekiva A Condominium
Stone Creek By Del Webb Longleaf Replat No. 3
Stone Creek Estates
Stone Creek Pointe A Condo
Stone Creek Ranch
Stone Farm
Stone Fox Estates
Stone Gate
Stone Harbor
Stone Haven
Stone Hill At Barnegat
Stone Hill Estates
Stone Hill North
Stone Hollow
Stone House Manor
Stone House Village
Stone Lake
Stone Mill
Stone Mill Estates
Stone Ridge
Stone Ridge East
Stone Ridge North
Stone Ridge South
Stone Spring
Stone Springs Condominiums
Stone Tavern
Stonebriar At Bayside Lakes
Stonebriar At Maplewood
Stonebridge
Stonebridge 1
Stonebridge 2
Stonebridge Country Club
Stonebridge Crossing
Stonebridge Estates 1 Add
Stonebridge Ests
Stonebridge Gardens
Stonebridge Gardens Condo
Stonebridge Gardens Secti
Stonebridge Gardens Section
Stonebridge Gardens Section One
Stonebridge Phase 1
Stonebridge Reserve Condom
Stonebridge Run
Stonebrook
Stonebrook At Upper Merion
Stonebrook Farms
Stonebrook Village
Stonecreek
Stonecreek At Russett
Stonecrest
Stonecroft Condo
Stonecroft Village
Stonefield
Stonegate
Stonegate 03
Stonegate At Faircrest
Stonegate At Patapsco
Stonegate At Regents Glen
Stonegate Condo- Phase I
Stonegate Farms
Stonegate Of Wellington
Stonehall
Stonehaven
Stonehaven 1
Stonehaven Estates
Stonehaven Mews
Stonehaven Mews In Crofton Village
Stonehedge
Stonehedge Condo
Stonehedge Ests
Stonehedge Ii
Stonehenge
Stonehenge Estates
Stonehouse
Stonehouse Wooded Estates
Stonehurst
Stonelea Estates
Stoneleigh
Stoneleigh Summit
Stonemill
Stonemill Village
Stonepoint
Stoneridge
Stoneridge Condominiums
Stoneridge Knoll
Stoneridge Lake Estates Plat
Stonerise
Stoners Farm
Stones Throw
Stones Throw Townhomes
Stonewal Estates
Stonewall
Stonewall Estates
Stonewall Heights
Stonewall Manor
Stonewater Creek
Stonewicke
Stonewold
Stonewood
Stonewood Crossings - Phase 1
Stonewood-Pentwood-Winston
Stoney Beach
Stoney Brook Farm
Stoney Chase Court
Stoney Creek
Stoney Creek Farm
Stoney Ford Estate
Stoney Glen South
Stoney Hill Mhp
Stoney Point
Stoney Ridge
Stoney Ridge Farm
Stoney Run
Stoney Springs
Stoneybrook
Stoneybrook Ests
Stoneybrook North
Stoneybrook Of Elizabethtown
Stoneybrook South
Stoneybrook South North
Stoneybrook South Ph
Stoneybrook South Ph J-2 &
Stoneybrooke
Stoneybrooke Village
Stoneymead
Stoneymeade
Stonington
Stonington Condominiums
Stony Brook
Stony Creek
Stony Creek Farms
Stony Point
Stony Pointe
Stony Ridge
Stony Run
Stony Run Village
Stony View
Stonybrook
Store Road Estates
Storey Lake
Storey Park - Parcel L
Storey Park - Phase 3
Storlas Add
Stormproof Sub
Stotesbury Park Rev
Stotler Crossroads
Stotters 1st Replat Part
Stouffer Avenue
Stow Creek Twp
Stowe Of Amyclae
Stowers
Straban Township
Straban Twnshp
Strada 315 Condo
Straffan Condos
Strafford Village
Strafford Walk
Stranahans Sub
Strand Condo
Strap: 12-44-27-L3-02008.0
Strasburg
Strasburg Borough
Strasburg Business And Industrial Park
Stratford
Stratford Apartments Cond
Stratford At Aberdeen
Stratford At Aberdeen Con
Stratford At Hunters Run
Stratford At Hunters Run Condo
Stratford Club
Stratford Commons
Stratford Condominium
Stratford Condominiums
Stratford Condos
Stratford Court
Stratford Estates
Stratford Glen
Stratford Green
Stratford Harbour
Stratford House Condo
Stratford Landing
Stratford On The Potomac
Stratford Place
Stratford Place At Kings
Stratford Square
Stratford Towers Condo
Stratford Woods
Strath Haven
Strathcona
Strathcona Hills
Strathmeade Square
Strathmore At Bel Pre
Strathmore Estates At Boynton Beach 2
Strathmore Gate I Unit One
Strathmore Gate I Unit Two
Strathmore Gate West
Strathmore Gate West Unit
Strathmore Gate West Unit 1
Strathmore Gate West Unit 2
Strathmore Gate West Unit 3
Strathmore Park
Strathmore Place
Strathmore Tower
Strathmore View
Stratshire Crossing
Stratton Commons
Stratton House
Stratton Woods
Strattons
Strattons Subd
Strattons Subdivision Pb2-
Strawberry Field Sub
Strawberry Fields
Strawberry Glenn
Strawberry Hill
Strawberry Hill Est Sub
Strawberry Hills
Strawberry Hills Estates
Strawberry Lakes 1
Strawberry Lakes 2
Strawberry Lakes 4
Strawberry Mansion
Strawberry Village
Strawbridge Park
Streamaire
Streamview Sub
Strinesville
Strok Plat No 2
Stroudsburg
Stuart
Stuart Creek Farms
Stuart Mechanic
Stuart Terrace
Stuart West
Stuart West Ph 03b
Stuart Woods Ranch Unrecored
Stuarts Crossing
Stubbs Overlook
Studio Addn To Town Of Hi
Sturbridge
Sturbridge Lakes
Sturbridge Oaks
Sturbridge Village
Sturbridge Woods
Sub 19-44-43
Sub Of 21-51-42 B B-13 D
Sub Of E1/2 Of Out
Sub Of F H Dunbar Tract
Sub Of Lagorce Island
Sub Of Pb 7-113
Sub Of Tropico
Subdivision De Aurora
Subdivision Of
Subdivisions 1 & 2 Ambers
Suburban Ac
Suburban Estates
Suburban Greene
Suburban Greens
Suburban Homes
Suburban Homes And Groves
Suburban Oaks
Suburbanite Condominium
Suburbanite Square I Co-O
Suburbia
Suburbia/Village Of Timber Grove
Sudlersville
Sudley
Sudley Manor
Sudley Place
Sudley Springs
Sudvale
Sue Creek Landing
Sue Grove
Suffield Meadows
Suffolk
Suffolk At Century Villag
Suffolk At Century Village
Suffolk At Century Village Condo
Suffolk Place
Sugar Loaf Overlook
Sugar Pines
Sugar Pond Manor Of Welli
Sugar Pond Manor Of Wellington
Sugar Sands
Sugar Sands Condo
Sugar Sands Condo 10
Sugar Sands Condo 11
Sugar Sands Condo 14
Sugar Sands Condo 16
Sugar Sands Condo 17
Sugar Sands Condo 20
Sugar Sands Condo 22
Sugar Sands Condo 7
Sugar Sands Condo 9
Sugar Sands Replat Of Replat As
Sugar Tree Grove Sub
Sugar Valley
Sugarhill
Sugarland
Sugarland Heights 2
Sugarland Heights 3
Sugarland Run
Sugarland Square
Sugarloaf Estates
Sugarloaf Shores Plat #2
Sugarloaf Shores Plat #2 Sec C
Sugarmill Woods Oak Village
Sugarmill Woods (Cypress Villa
Sugarmill Woods Oakvillage
Suitland
Suitland-Silver Hill
Sukoshi Oki
Sully Estates
Sully Station
Sully Station Ii
Summer Breeze
Summer Chase / Cypress Woods 2
Summer City
Summer Gate Townhomes
Summer Haven
Summer Hill
Summer Hill Estates
Summer House Ii
Summer Lake
Summer Lake Condo
Summer Lakes Condo
Summer Layne
Summer Ridge Codm
Summer Sea
Summer Solitude
Summer Winds Of Jupiter
Summerbreeze
Summerbreeze Condo
Summerbreeze Condominium
Summerbrooke
Summercrest
Summerdale
Summerfield
Summerfield At Elverson
Summerfield At Morgan St
Summerfield Crossing
Summerfield Golf Club 01 Ph 01a & 02
Summerfield Golf Club A Pud
Summerfield Hoa
Summerfield In Covington
Summerfield Village
Summerfields
Summerfields West
Summerglen
Summerhill
Summerhouse Condo
Summerhouse Ii Condo
Summerland Cove Isles Blk 2, 3
Summerland Estates
Summerland Key
Summerland Manor
Summerlins
Summerlyn
Summerplace Unit 1
Summerplace Unit 2
Summerridge
Summers Landing
Summerset
Summerset Ridge South
Summertime
Summertime Isles Second A
Summertree Condo Apts
Summertree Vilg Calif Cl
Summertree Vilg Calif Cl Condo
Summervale
Summerville Sub
Summerville Villas
Summerwalk
Summerwalk At Stone Ridge
Summerwind Sub
Summerwood
Summerwood-Plat Eight>
Summerwoods
Summit
Summit At New Freedom
Summit Bridge Farm
Summit Chase
Summit Chase Condo
Summit Condo
Summit Creek
Summit Crest
Summit Crossing Codm
Summit Crossing Estates
Summit Hall
Summit Hall Reserve
Summit Hill
Summit Hill Borough
Summit House
Summit Lake
Summit Oaks
Summit Park
Summit Pines
Summit Pines Unit
Summit Pines Unit 02
Summit Pines Unit 1
Summit Pines Unit 3
Summit Pines Unit 4
Summit Point
Summit Pointe
Summit Pond
Summit Ridge
Summit Terrace
Summit Tower I Of Dadelan
Summit Townhouses
Summit Towns
Summit View
Summit Village
Summit Walk
Sumner
Sumner Lake
Sumner Village
Sumter Crossing
Sumter Point
Sun And Country Ranches
Sun And Lake Condo
Sun And Sand
Sun And Surf
Sun And Surf Club Communi
Sun And Surf Club Community
Sun And Surf One Hundred And Thirty Condos
Sun Coral Ests 3rd Addn
Sun Country Condo
Sun Gardens First Add
Sun Glade Estates
Sun Grove Estates
Sun Harbour
Sun Haven Sub
Sun Haven Towers Condo
Sun Hill
Sun Lake Estates Sebring
Sun Lake Estates Of Sebrin
Sun Lakes Country Club Vil
Sun Land Park
Sun Meadow
Sun N Fun
Sun N Laake Est Of Sebring
Sun N Lake
Sun N Lake Est Of Sebring
Sun N Lake Estates
Sun N Lake Of Sebring Unit
Sun N Lake Seb Unit 16
Sun N Lake Sebring
Sun N Lakes
Sun N Lakes Est
Sun N Lakes Est Sec 5
Sun N Lakes Est Sec 6
Sun N Lakes Est Sec 7
Sun N Lakes Estates
Sun N Lakes Estates Holida
Sun N Lakes Estates Sec 18
Sun N Lakes L.P. East Side
Sun N Lakes Lp East Side
Sun N Lakes Unit 16
Sun N Lakes Unpop
Sun N Lk
Sun N Lk Holiday Cc Sec
Sun N Lk Lp Holiday Cc Sec
Sun N Lk Lp Unit 01
Sun N Lk Lp Unit 03
Sun N Lk Lp Unit 06
Sun N Lk Lp Unit 10
Sun N Lk Lp Unit 11
Sun N Lk Lp Unit 14
Sun N Lk Lp Unit 16
Sun N Lk Lp Unit 17
Sun N Lk Lp Unit 18
Sun N Lk Lp Unit 19
Sun N Lk Lp Unit 20
Sun N Lk Seb Unit 02
Sun N Lk Seb Unit 06
Sun N Lk Seb Unit 08
Sun N Lk Seb Unit 09
Sun N Lk Seb Unit 10
Sun N Lk Seb Unit 11
Sun N Lk Seb Unit 16
Sun N Lk Seb Unit 25 Rplt
Sun N' Surf
Sun Ray Homes Greynolds P
Sun Retreats Rehoboth Bay
Sun Run Condo
Sun Run No Ii Condo
Sun Set Apts Co-Op
Sun Set Manors First Add
Sun Valley
Sun Valley 2
Sun Valley Condominiums
Sun Valley East
Sun Valley East Condo
Sun Valley Est Sub
Sun Valley Subd
Sun Village
Sun Vista Gardens
Sun Vista Gardens Condo
Sun Vly Acres
Sun-Tan Vill Sec 5
Sun-Tan Village Sec 1
Sun-Tan Village Sec 2
Sun-Tan Village Sec 3
Sun-Tan Village Sec 4
Sunayr
Sunbury
Sunbury Village
Sunbury Ward 3
Suncoast Estates
Suncreek
Suncrest
Suncrest Townhouse Condo
Sundance
Sundance At Davie Condo
Sundance At Plantation Co
Sundance At Plantation Con
Sundance Forest
Sundance West
Sunderland Estates
Sunderland Woods
Sunderlandville
Sunderleigh
Sundown Chase
Sundown Creek
Sundown Hills
Sundowner Park
Sundy & Tenbrook
Sunfish Park Sub
Sunflower
Sunflower Condo
Sunflower First Add
Sunflower Gardens Condo
Sunflower Margate
Sunflower Second Add
Sunguild Iii
Suniland Estates
Suniland Estates 1st Addn
Suniland Manor
Sunkist Estates A
Sunkist Grove
Sunland Gardens
Sunland Gardens Plat 2
Sunland Gardens Plat 3
Sunland Park Sec 2 25-37
Sunland Park Section 2
Sunland Ranch
Sunn Lakes Est
Sunn Lakes Est Sec 10
Sunn Lakes Estates
Sunn Lakes Estates Acres
Sunning Hills
Sunningdale Meadows
Sunny Acres
Sunny Acres Subdivision
Sunny Court Apts Condo
Sunny Day Homes Sec 1
Sunny Dell
Sunny Estates
Sunny Grove
Sunny Haven
Sunny Hill
Sunny Hills
Sunny Isl.
Sunny Isle Of Kent
Sunny Isles Inland
Sunny Isles Shores Sec A
Sunny Palm Estates
Sunny Ridge Estates
Sunny Shores Condo
Sunny Side
Sunny Slope Pk
Sunny South Estates
Sunny View
Sunny Way
Sunnybrae Village
Sunnybrook
Sunnybrook Farms
Sunnyburn
Sunnydell Subd
Sunnyfield Estates
Sunnyland Park No 2
Sunnylane Farms
Sunnyside
Sunnyside Estates
Sunnyside Farms
Sunnyside Section
Sunnyview Knoll Ii
Sunnyview Sub
Sunrise
Sunrise Acres
Sunrise Bay
Sunrise Bay Club Co-Op
Sunrise Beach
Sunrise Club Condo
Sunrise Condominiums
Sunrise East Condo
Sunrise Estates
Sunrise Estates Unit C
Sunrise Ests 2nd Addn
Sunrise Golf Village
Sunrise Golf Village 2nd
Sunrise Golf Village 3rd Add To
Sunrise Golf Village First Add
Sunrise Golf Village Four
Sunrise Golf Village North
Sunrise Golf Village Sec
Sunrise Golf Village Sec 12 62-31 B Lot 2
Sunrise Golf Village Sec 16
Sunrise Golf Village Sec 19
Sunrise Golf Village Sec 20
Sunrise Golf Village Sec 21
Sunrise Golf Village Sec 23
Sunrise Golf Village Sec 24
Sunrise Golf Village Sec 26
Sunrise Golf Village Sec 3
Sunrise Golf Village Sec 7
Sunrise Golf Village Second Add
Sunrise Golf Village Sect
Sunrise Golf Village Third Add
Sunrise Golf Vlg Sec 24
Sunrise Groves Unrec
Sunrise Harbour Rev Pl
Sunrise Heights
Sunrise Hills
Sunrise Homesites Subdivision
Sunrise Industrial Park Phase Ii
Sunrise Intracoastal
Sunrise Intracoastal Residences
Sunrise Island
Sunrise Island Condominiu
Sunrise Island Condominium Iii
Sunrise Isle
Sunrise Key
Sunrise Lake
Sunrise Lakes
Sunrise Lakes 119 Condo
Sunrise Lakes 209 Condo
Sunrise Lakes 10 Condo
Sunrise Lakes 100 Condo
Sunrise Lakes 103 Condo
Sunrise Lakes 104 Condo
Sunrise Lakes 105 Condo
Sunrise Lakes 106 Condo
Sunrise Lakes 108 Condo
Sunrise Lakes 109 Condo
Sunrise Lakes 110 Condo
Sunrise Lakes 111 Condo
Sunrise Lakes 113 Condo
Sunrise Lakes 114 Condo
Sunrise Lakes 115 Condo
Sunrise Lakes 117 Condo
Sunrise Lakes 118 Condo
Sunrise Lakes 12 Condo
Sunrise Lakes 120 Condo
Sunrise Lakes 122 Condo
Sunrise Lakes 123 Condo
Sunrise Lakes 125 Condo
Sunrise Lakes 126 Condo
Sunrise Lakes 129 Condo
Sunrise Lakes 131 Condo
Sunrise Lakes 132 Condo
Sunrise Lakes 134 Condo
Sunrise Lakes 135 Condo
Sunrise Lakes 138 Condo
Sunrise Lakes 139 Condo
Sunrise Lakes 140 Condo
Sunrise Lakes 142 Condo
Sunrise Lakes 143 Condo
Sunrise Lakes 144 Condo
Sunrise Lakes 145 Condo
Sunrise Lakes 146 Condo
Sunrise Lakes 147 Condo
Sunrise Lakes 148 Condo
Sunrise Lakes 151 Condo
Sunrise Lakes 152 Condo
Sunrise Lakes 153 Condo
Sunrise Lakes 154 Condo
Sunrise Lakes 155 Condo
Sunrise Lakes 156 Condo
Sunrise Lakes 157 Condo
Sunrise Lakes 158 Condo
Sunrise Lakes 159 Condo
Sunrise Lakes 16 Condo
Sunrise Lakes 161 Condo
Sunrise Lakes 165 Condo
Sunrise Lakes 166 Condo
Sunrise Lakes 167 Condo
Sunrise Lakes 168 Condo
Sunrise Lakes 17 Condo
Sunrise Lakes 171 Condo
Sunrise Lakes 172 Condo
Sunrise Lakes 173 Condo
Sunrise Lakes 177 Condo
Sunrise Lakes 178 Condo
Sunrise Lakes 179 Condo
Sunrise Lakes 18 Condo
Sunrise Lakes 180
Sunrise Lakes 183 Condo
Sunrise Lakes 184 Condo
Sunrise Lakes 185 Condo
Sunrise Lakes 186 Condo
Sunrise Lakes 187 Condo
Sunrise Lakes 19 Condo
Sunrise Lakes 190 Condo
Sunrise Lakes 193 Condo
Sunrise Lakes 194 Condo
Sunrise Lakes 196 Condo
Sunrise Lakes 20 Condo
Sunrise Lakes 200 Condo
Sunrise Lakes 201 Condo
Sunrise Lakes 203 Condo
Sunrise Lakes 204 Condo
Sunrise Lakes 206 Condo
Sunrise Lakes 208 Condo
Sunrise Lakes 209 Condo
Sunrise Lakes 21 Condo
Sunrise Lakes 211 Condo
Sunrise Lakes 213 Condo
Sunrise Lakes 214 Condo
Sunrise Lakes 215 Condo
Sunrise Lakes 216 Condo
Sunrise Lakes 217 Condo
Sunrise Lakes 218 Condo
Sunrise Lakes 219 Condo
Sunrise Lakes 220 Condo
Sunrise Lakes 24 Condo
Sunrise Lakes 25 Condo
Sunrise Lakes 26 Condo
Sunrise Lakes 27 Condo
Sunrise Lakes 29 Condo
Sunrise Lakes 3 Condo
Sunrise Lakes 30 Condo
Sunrise Lakes 31 Condo
Sunrise Lakes 32 Condo
Sunrise Lakes 34 Condo
Sunrise Lakes 36 Condo
Sunrise Lakes 40 Condo
Sunrise Lakes 41 Condo
Sunrise Lakes 42 Condo
Sunrise Lakes 47 Condo
Sunrise Lakes 49 Condo
Sunrise Lakes 5 Condo
Sunrise Lakes 51 Condo
Sunrise Lakes 52 Condo
Sunrise Lakes 53 Condo
Sunrise Lakes 55 Condo
Sunrise Lakes 58 Condo
Sunrise Lakes 59 Condo
Sunrise Lakes 6 Condo
Sunrise Lakes 60 Condo
Sunrise Lakes 61 Condo
Sunrise Lakes 62 Condo
Sunrise Lakes 63 Condo
Sunrise Lakes 64 Condo
Sunrise Lakes 65 Condo
Sunrise Lakes 66 Condo
Sunrise Lakes 67 Condo
Sunrise Lakes 68 Condo
Sunrise Lakes 69 Condo
Sunrise Lakes 7 Condo
Sunrise Lakes 71 Condo
Sunrise Lakes 72 Condo
Sunrise Lakes 73 Condo
Sunrise Lakes 74 Condo
Sunrise Lakes 75 Condo
Sunrise Lakes 76 Condo
Sunrise Lakes 79 Condo
Sunrise Lakes 8 Condo
Sunrise Lakes 81 Condo
Sunrise Lakes 82 Condo
Sunrise Lakes 84 Condo
Sunrise Lakes 85 Condo
Sunrise Lakes 86 Condo
Sunrise Lakes 87 Condo
Sunrise Lakes 88 Condo
Sunrise Lakes 9 Condo
Sunrise Lakes 90 Condo
Sunrise Lakes 91 Condo
Sunrise Lakes 92 Condo
Sunrise Lakes 93 Condo
Sunrise Lakes 94 Condo
Sunrise Lakes 95 Condo
Sunrise Lakes 96 Condo
Sunrise Lakes 97 Condo
Sunrise Lakes 98 Condo
Sunrise Lakes Condo
Sunrise Lakes Condominium Phase 4 Inc 2
Sunrise Lakes Iv
Sunrise Lakes Ph 4 Inc 2
Sunrise Lakes Phase 1
Sunrise Lakes Phase 3
Sunrise Lakes Phase 4
Sunrise Lakes Phase I
Sunrise Lakes Phase Iii
Sunrise Lakes Phase Iv
Sunrise Manor South
Sunrise Manor West
Sunrise Meadows
Sunrise Mnr
Sunrise No 2 Condo
Sunrise Of Delray
Sunrise Of Palm Beach Con
Sunrise Of Palm Beach Cond No 1,2,3,4, 14 & 17
Sunrise Of Palm Beach Condo 1,2,3,4, 14 And 17
Sunrise Park 1
Sunrise Park No 1
Sunrise Point
Sunrise Point (95.0)
Sunrise Point Add Amd
Sunrise Point Rev
Sunrise Springs Condo I
Sunrise Springs Condo Ii
Sunrise Springs Condo Iii
Sunrise Summit
Sunrise Terrace
Sunrise Terrace Condo
Sunrise Tower Condo
Sunrise Towne 1
Sunrise Towne Preferred 1
Sunrise Towne Preferred 3
Sunrise Towne Preferred 4
Sunscapes
Sunset
Sunset Acres
Sunset Acres Unit 1
Sunset Area
Sunset Bay Subd
Sunset Beach
Sunset Circle
Sunset Condor Ph I
Sunset Coop Inc
Sunset Cove
Sunset Cove Condo
Sunset Creek Estates
Sunset East
Sunset East Second Sec
Sunset East Villas 13122
Sunset Estates
Sunset Estates Mhp
Sunset Falls Plat 1
Sunset Falls Plat 2
Sunset Gardens
Sunset Grove
Sunset Grove 2nd Amd
Sunset Groves Unrec
Sunset Hammock
Sunset Harbour
Sunset Harbour North Cond
Sunset Harbour Sec 3
Sunset Harbour Sec Iv
Sunset Harbour Sec Vi
Sunset Harbour South
Sunset Harbour South Cond
Sunset Harbour South Condo
Sunset Heights
Sunset Hills
Sunset Hills 1 Condo
Sunset Hills I Condo
Sunset Hills I Condominiu
Sunset Hills I Condominium
Sunset House Condominium
Sunset Island
Sunset Islands-Island No
Sunset Islands-Island No 3
Sunset Isles Sec 1
Sunset Isles Sec 2
Sunset Isles Sec 3
Sunset Lake
Sunset Lake Amd Pl
Sunset Lake Park
Sunset Lakes Estate
Sunset Lakes Estates 1st
Sunset Lakes Plat One
Sunset Lakes Plat Three
Sunset Lakes Plat Two
Sunset Landing
Sunset Lane
Sunset Manor
Sunset Manors Amen Plat
Sunset Meadows
Sunset Palm Villas Condo
Sunset Palms
Sunset Palms East Condo
Sunset Palms West Condo
Sunset Park
Sunset Park Addition
Sunset Park Lake Villas S
Sunset Park Subdivision
Sunset Park Town Houses
Sunset Pines
Sunset Pines Condo
Sunset Plaza
Sunset Point
Sunset Point Sub
Sunset Pointe At Fort Myers Condo.
Sunset Pointe/Fort Myers C
Sunset Ranches
Sunset Ridge
Sunset Shores
Sunset Station
Sunset Strip Airpark
Sunset Trace
Sunset Trace At Martin Downs (Aka Martin Downs Pla
Sunset Trace Ph 01 Md 06
Sunset Trails
Sunset Trails No 2
Sunset Trails No 4
Sunset Trails No 5
Sunset View
Sunset Village
Sunset Villas Condo
Sunset Villas No 3 Condo
Sunset Villas No 3 Condo Bldg 16
Sunset Villas No 3 Condo-
Sunset Waterways
Sunset West Sec 3
Sunset West Sec1
Sunset Woods
Sunshine Acres
Sunshine Bay Condo
Sunshine City
Sunshine Estates
Sunshine Fruits Co
Sunshine Holiday
Sunshine Manor
Sunshine Manor Mobil Home Park
Sunshine Manor Mobile Home Park
Sunshine Manor No 2
Sunshine Park
Sunshine Park Add 1
Sunshine Park Add 2
Sunshine Park Estates
Sunshine Park Estates Add
Sunshine Pkwy Manor
Sunshine Ranches
Sunshine Villa Co-Op
Sunshine Village Phases
Sunshine Villas
Sunshine Villas First Add
Sunshine Vistas
Sunshores Condo
Sunstone
Sunstone Preserve
Sunswept Groves
Sunswept Heights Sec 1
Sunswept Isle
Sunswept Isle 1st Addn
Sunterra Pud
Sunterrace At The Gardens
Suntide Condo
Sunwood Condo
Sunwood Farm
Superfine Lane
Superior Heights
Superior Homes Sec 4
Superior Homes Sec 6
Superior Park
Surf & Sand Condo
Surf City
Surf Club Condo
Surfside
Surfside Hills
Surfside Palms Condo
Surfside Plaza Unit 1 Rep
Surfside Unit 1 Sub
Surfside Unit 1 Subdivisi
Surfside Unit 1 Subdivision
Surfside Unit 2
Surfside Unit 2 Unrec
Surfside Villas
Surora Heights Resubdivision
Surprise Lake
Surratts Gardens
Surratts Manor
Surratts Village
Surrey At The Potomac
Surrey Place East
Surrey Square
Susan Gardens
Susquehanna Highland
Susquehanna Manor
Susquehanna Point
Susquehanna River View
Susquehanna Township
Susquehanna Trails
Susquehanna Union Green
Sussex
Sussex Condo
Sussex East Mhp
Sussex House
Sussex Place
Sussex Square Condo
Sussex West Mhp
Sussman Agr Pud North Pla
Sussman Agr Pud North Plat One
Sussman Agr Pud North Plat Three
Sussman Agr-Pud North 3
Sutphin Pines
Sutter's Meadow
Sutton Acres Sub
Sutton Heights
Sutton Hill
Sutton House Condo
Sutton Manor
Sutton Place
Sutton Place Condo
Sutton Run
Sutton Terr
Sutton Woods
Suw Riv Subd
Suw River Subd
Suwannee Highlands Subdiv 1st Addition
Suwannee River Hillcrest
Suzanne Park
Suzanne Plaza Condo
Sw Waterfront
Swan Dale Farms
Swan Harbor
Swan Harbor Dell
Swan Lake
Swan Meadows
Swan Point
Swan Point Sub
Swan Woods
Swann Cove
Swann Cove West
Swann Estates
Swann Hill
Swann Hill Condominiums
Swann Keys
Swann Point
Swann Road
Swans
Swans Landing
Swansea Condo
Swanton
Swarthmore
Swarthmorewood
Swatara Shores
Swatara Township
Swatara Village
Sway Shores
Swedes Run
Sweepstakes
Sweet Air Estates
Sweet Briar
Sweet Briar Mhp
Sweet Hollow
Sweet Rewards Farm
Sweet Village Condo
Sweetbay
Sweetbriar Creek
Sweetbriar Woods
Sweetwater
Sweetwater Creek
Sweetwater Creek Condo
Sweetwater Estates Sub
Sweetwater Ests Sub
Sweetwater Gardens Amd Pl
Sweetwater Golf Course To
Sweetwater Groves
Sweetwater Groves .14 Ac
Sweetwater Park
Sweetwater Park Condo
Sweetwater Sec 1
Sweetwater Sub
Sweetwater Subd
Swinton Heights D B
Swiss Chalet South Condo
Sycamore Acres
Sycamore Chase
Sycamore Court
Sycamore Crossing
Sycamore Edge
Sycamore Farm
Sycamore Gardens
Sycamore Heights
Sycamore Hill
Sycamore Mews
Sycamore Park
Sycamore Ridge
Sycamore Run
Sycamore Shoals
Sycamore Village
Sycamores At Van Dorn
Sylda Heights Belle Glade
Sylvan Acres
Sylvan Heights
Sylvan Lakes Subdivision
Sylvan Run Estates
Sylvan Shores
Sylvan Square
Sylvan View On Magothy
Sylvan Vista
Sylvania Heights
Sylvania Heights Resub
Symington Avenue
Symmes - Sharman Tract
Symmes-Sharman Tract
Symphony At Jupiter
Symphony Bay
Symphony Meadows
Symphony North Condo
Symphony Place
Symphony South Condo
Symphony Village
Symphony Village At Centreville
Symphony Woods
Synnott Tract
Syrola Pines
T L Johnson Sub In Sw1/4
T M Rickards Sub
T M V Gardens
T.B. Hicks Subdivision
Table Rock Terrace
Tabler Station Manor
Tacketts Farm
Tacketts Mill
Tacony
Taft-Wilson
Takoma
Takoma Park
Talamore
Talavera
Talbot County
Talbot House Iii Condo
Talbot Run Estates
Talbots Landing
Talbott Estates
Talisman Court
Tall Grass Meadows
Tall Oak Estates
Tall Oaks
Tall Oaks Crossing
Tall Oaks Estates
Tall Oaks Manor
Tall Pines
Tall Pines Mhp
Tall Pines Unrec
Tall Timbers
Tall Trees Condo
Tall Woods
Tallamoody Amd Pl
Tallamoody Manor
Talleybrook
Tallman Pines 2nd Sec
Tallowwood Isle
Tallwood East Condo
Tallwood West Condo
Tally Ho
Tallyn Ridge
Tallyn Ridge At Pinecliff Park
Tam Oshanter
Tam Oshanter Gardens Fami
Tam Oshanter Gardens Family
Tamaqua
Tamaqua Boro
Tamar Commons
Tamarac
Tamarac Forest
Tamarac Gardens
Tamarac Gardens Condo 12
Tamarac Gardens Condomini
Tamarac Gardens Condominium No 9
Tamarac Hills 3rd Sec
Tamarac Lakes
Tamarac Lakes North
Tamarac Lakes North 2nd Sec
Tamarac Lakes North 3rd S
Tamarac Lakes Second Sect
Tamarac Lakes South
Tamarac Lakes South 62-24
Tamarac Village
Tamarack Mhp
Tamarind Bay Club Condomi
Tamarind Park
Tamarraon
Tamarron Dr
Tamberlane
Tamberlane 1 Condo
Tamberlane 3 Condo
Tamberlane 4 Condo
Tamberlane 5 Condo
Tamberlane 6 Condo
Tamberlane 7 Condo
Tamberlane No 2 Cond Irreg Par In N 1/2 Of Sec
Tambor Hills
Tamerlane
Tamiair Industrial Park S
Tamiami Acres Plan 1
Tamiami City Revised
Tamiami Highlands
Tamiami Lakes Sec 1
Tamiami Lakes Sec 2
Tamiami Lakes Sec 4
Tamiami Lakes Sec 5
Tamiami Lakes Sec 7
Tamiami Pines
Tamiami Place Plan 1
Tamiami Place Plan No 3
Tamiami Trail Park
Tammany Manor
Tan Tara
Tanager Woods
Tanama
Tanama Lodge
Tanbark
Taneytown Village
Tangerine Condominium Six
Tanglewood
Tanglewood Arvida Country Club
Tanglewood At Russett
Tanglewood Lakes
Tanglewood Manor N
Tanglewood Preserve
Tanglewood Townhomes
Tanglewood Townhomes Sect
Tanglewood Townhomes Sub
Tanners Ridge Iv
Tannery Yard
Tantallon
Tantallon Hills
Tantallon North
Tantallon On The Potomac
Tantallon South
Tantallon Square
Tanyard Cove North
Tanyard Shores
Tanyard Springs
Tanyard Springs Townhomes
Tao Sawgrass Condominium
Taormina Sicily Italy
Tapestry
Tara
Tara Apartments Condo
Tara Cove
Tara Estates
Tara Estates As
Tara Gardens 1 Condo
Tara Ii Condo
Taracoma Townhomes Condo
Taralyne Oaks
Taramino
Tarelton Manor Apts Co-Op
Tareyton Estates
Tarleton
Tarnsfield
Taromina Apts Co-Op
Taromina Co-Op
Tarpon Bay Villas
Tarpon Bay Yacht Club Condo A
Tarpon Bay Yacht Club Condo E
Tarpon Bay Yacht Club Condo H
Tarpon Bay Yacht Club Condominium B
Tarpon Bay Yacht Club Condominium H
Tarpon Flats Subdivision
Tarpon Island Club Condo I
Tarpon River
Tarpon River 4
Tarpon River Iv
Tarpon River Park
Tarpon River Village
Tarrencoyd
Tarrington Village
Tarrington Woods
Tartan Coconut Creek Parcel
Tartan Coconut Creek Phas
Tartan Coconut Creek Phase 1
Tartan Coconut Creek Phase I
Tartan Coconut Creek Phase Ii
Tartan Coconut Creek-Parc
Tartan Coconut Creek-Parcel 'C'
Tartan Hill
Tartan Lakes 1
Tartan Lakes 2
Tartan Lakes Plat No 1waterchase
Tartan South-Plat Four>
Tartan Village
Taskers Chance
Tattersall
Tatum Ridgedale Addn
Tatums Addition No 1
Tatums Colored Town Addn
Tatums Sub
Tatums Sub Govt
Taunton Lakes
Taunton Trace
Tauxemont
Tavenner Woods
Tavern Gate
Tavistock
Tavistock At Mays La
Tavistock Estates
Tavistock Farms
Tavistock Hills
Taylor Cove
Taylor Creek
Taylor Creek Condominiums
Taylor Heights
Taylor Ridge
Taylor Ridge Condominiums
Taylor Street
Taylor Village
Taylor's Island
Taylors Island
Taylors Pointe
Taylorstown
Taylortowne
Tayman Farm-Plat 1>
Tba
Tbd
Tcpb Condo
Tdr Tower 1
Tdr Tower I Condo
Tdr Tower Ii Condo
Tdr Tower Iii Condo
Tdr Tower Two
Teaberry Ridge
Technology Trading Park
Tee & Grn Ests
Tee And Green Estates
Tee And Green Estates 1st Add
Tee And Green Ests
Teipewood
Telaro At Southern Grove
Telaro At Southern Grove Phase 2 And 3
Telaro At Tradition
Telford
Telstar
Telstar Condominium Inc
Temple
Temple Heights
Temple Hill Acres
Temple Hills
Temple Hills Park
Temple Plaza-Plat 1>
Temple Terrace
Temple University
Temple View
Templeton
Templeton Knolls
Templeton Of Alexandria
Tempo Condo Ph I
Ten Acres
Ten Aragon Condo
Ten Hills
Ten Museum Pk Residential
Ten Museum Pk Residential Condo
Ten Square Farms (A Of E)
Tenby Chase
Tenleytown
Tennessee Estates
Tennis Club
Tennis Club Davis Condo
Tennis Club Ii Courts Con
Tennis Club Ii Courts Condo
Tennis Club Johnston Cond
Tennis Club Lenglen Condo
Tennis Club Mc Loughlin Condo
Tennis Club Of Palm Beach
Tennis Club Outerbridge C
Tennis Club Outerbridge Condo
Tennis Club Tilden Condo
Tennis Club Wingfield Condo
Tennis Lodges
Tennis Lodges 1 Condo
Tennis Lodges No 1 Cond Decl Filed 4-2-79 Or3034p1
Tennis Park
Tennis View Condo Ph I
Tennis Villas Condo
Tennis Villas Condo 02 Irp
Tenzer Plat
Tequesta
Tequesta Cay
Tequesta Cay Condo
Tequesta Country Club
Tequesta Cove
Tequesta Cove Condo
Tequesta Garden Conco No 7
Tequesta Garden Condo 1
Tequesta Garden Condo 4
Tequesta Garden Condo 6
Tequesta Garden Condo 7
Tequesta Garden Condo 8
Tequesta Garden Condo No 7
Tequesta Lakes - Country Isles
Tequesta Oaks
Tequesta Pines
Tequesta Point
Tequesta Towers Condo
Tequesta Trace
Tequesta Trace Condo
Ternberry
Ternbridge
Terra Alta
Terra Beachside Condo
Terra Lago
Terra Lake Villas Condo
Terra Mar
Terra Mar Island Estates
Terra Sol
Terra Tranquila
Terrace Condos Inc
Terrace East Condo
Terrace Gardens Condo
Terrace Lofts
Terrace Towne Homes Of Gunston
Terrace Towne Homes Of Woodlawn
Terrace View Towers Condo
Terraces Condo
Terraces North Turnberry
Terraces Of Adelphi
Terraces Of Westlake
Terraces Of Westlake Phase 2
Terracina
Terracina Johnson Propert
Terracina Johnson Property
Terramar One
Terranova Condo #10
Terranova Condo #6
Terrapin Station
Terrazas Riverpark Villag
Terrazas Riverpark Village
Terrazas Riverpark Village Condo
Terreno At Valencia G&Cc Ph 3 And Country Club Ph3
Terreno At Valencia Golf And Country Club Ph 2
Terrestria
Terry & Tice Vanderwalker
Terry Manor
Terrys Run Estates
Terrys Tr Pk
Tesoro
Tesoro 2
Tesoro 3
Tesoro 4
Tesoro Club
Tesoro Court
Tesoro Estates
Tesoro Plat No 15
Tesoro Plat No 2
Tesoro Plat No 20
Tesoro Plat No 3
Tesoro Plat No 4
Tesoro Plat No 5
Tesoro Plat No 6
Tesoro Preserve Plat No 2
Tesoro Preserve Plat No 5
Th At Heritage Cntr
That's Up To You!
Thayer Towers
The 1120 On 7th Street Co
The 1401
The 1525 Residence
The Acrage
The Acreage
The Acreages
The Addison At St Paul
The Admiralty Condo
The Alameda
The Alexander Condo
The Alexander Condominium
The Ambassador Condo
The Ambassadors Condo
The Anchorage
The Antilles Subdivision
The Anton Condo
The Arlington
The Armstrong Condo
The Ashmore
The Aston Condo
The Atlantic Hotel Condo
The Atrium
The Atrium At Aventura Co
The Atrium At Metrowest
The Atrium On The Ocean I
The Atrium On The Ocean Ii, A Condominium
The Atrium On The Ocean, A Condominium
The Aventura Beach Club
The Aventura Beach Club C
The Aventura Beach Club Co
The Aventura Beach Club Condo
The Avenue At Forest Run
The Avenue Coral Gables
The Avenues
The Axis On Brickell Cond
The Axis On Brickell Ii C
The Axis On Brickell Ii Condo
The Bank Condo
The Banyan Drive Estates
The Bath Club
The Bayliss Condo
The Beach Club Fontainebl
The Beach Club Fontaineble
The Beacon
The Bearings
The Belcrest Condo
The Bellagio Condo
The Belmont At St Lucie West Condo
The Belmont At St Lucie West, A Condominium
The Belmont Condo
The Belmont Ii At St Luci
The Belmont Ii At St Lucie West, A Condominium
The Bentley Bay Condo
The Berkeley
The Berkeley Condo
The Biltmore Regent Condo
The Birches
The Blue A Resort Hotel
The Blue A Resort Hotel C
The Blue A Resort Hotel Co
The Blue A Resort Hotel Condo
The Blue At Resort Hotel Condo
The Blue Provident
The Bluffs At Quarry Lake
The Bluffs At Sleeter Lake
The Bluffs Ellicott Mill
The Bond
The Bond (1080 Brickell)
The Bondo (1080 Brickell)
The Boro Tysons
The Boulevards At Westfields
The Bower
The Breakers Condominiums
The Brickyard
The Bridges
The Bridgewater Condo
The Brittany
The Buchanan School
The Buckingham At Loudoun Valley
The Caribbean Condo
The Carleton Of Chevy Chase
The Carlton
The Carlyle Deco Hotel Co
The Carlyle On 75th Stree
The Carolyn
The Carriage Club North
The Carriage Club North C
The Carriage Club North Cond0
The Carriage Club South
The Carriage Homes At Sickler Court
The Carriage House
The Carriage House Condo
The Carrollton
The Casa Bella Condo On S
The Casa Canal
The Cascades
The Castle Meridian Condo
The Cavalli Tower
The Cavendish
The Cedars
The Cedars Of Kendall
The Chatham
The Chimneys
The Christopher
The Citadel Condo
The Cliffs At Iron Valley
The Clipper At Bisc Cove
The Cloisters
The Cloud One Residences
The Club At Brickell Bay
The Club At Ibis - Sandpiper
The Club At Indian Lakes
The Club At St Lucie West, A Condominium
The Clubhouse
The Cluster At Was
The Coconut Grove Bayshor
The Collins Condo
The Colonies
The Colonnade At Kentlands
The Colony
The Commodore
The Commodore Condominium
The Commons At Radish Farm
The Commons On William Square
The Coral Crest Condo
The Coronet Condo
The Corvette Condo
The Cosmopolitan
The Cosmopolitan Residenc
The Court Yards Condo
The Courts At Bayshore I
The Courts At Bayshore I Condo
The Courts At Bayshore Ii
The Courts At Doral Isles
The Courts At Kendall Con
The Courts At Kendall Cond
The Courts At South Beach
The Courts At South Beach Condo
The Courts Brickell Key
The Courts Of Inverrary
The Courtyards At Pond
The Courtyards Of Broward
The Courtyards Of Overlook
The Cove
The Cove 2nd Sec 33-27 B
The Cove 4th Section
The Cove At Storey Lake
The Crescent At Cherry Lane
The Crimson Condo
The Crimson Condominium
The Crosby
The Crosby Miami
The Crosby Miami World
The Crosby Miami World Center
The Crosby Miami World Center Condo
The Crosby Miami Worldcen
The Crosby Miami Worldcent
The Crosby Miami Worldctr
The Crosby Unit 1607
The Crosby Unit 204
The Crosby Unit 2207
The Crosby Unit 513
The Crossby Miami Worldcen
The Crossing At Gateway
The Crossing At Great Cacapon
The Crossing, Long Island
The Crossings
The Crossings At East New Market
The Crossings At Riverside Farms
The Crossings At Sweetbriar
The Danians
The David William
The Decoplage Condo
The Dells
The Dells 64-40 B
The Domaine At Soso
The Dorchester
The Dorilton Condo
The Dove Condo
The Downs
The Drake Condo
The Dune Of Hutchinson Island
The Dunes
The Edge On 15
The Elaine Condo
The Elizabeth
The Elmont
The Elser
The Elser Condo
The Elser Hotel Miami
The Elser Residences
The Elysee Condo
The Elysium
The Emerald At Brickell
The Emerald At Brickell C
The Emeraldbay @ Key Colo
The Empire Condo
The Enclave
The Enclave At Carrollton Manor
The Enclave At Chaddsford
The Enclave At Coral Ridge Country Club
The Enclave At Sills Mill
The Enclave At Upper
The Enclave/Heron Bay
The Esplanade Beach Condo
The Estates At Acqualina
The Estates At Bridgewater
The Estates At Cedarday
The Estates At Deacon Hill
The Estates At Hearthside
The Estates At Morikami Park Road
The Estates At Tweed
The Estates Of Aqualina
The Estates Of Beacon Woods Golf & Country
The Estates Of Forest Ridge
The Estates Of Wimbledon
The Estuary
The Evelyn Condo
The Executive Condo
The Exotic Villas Condo
The Fairchild Coconut Grov
The Fairmont 1005 Condo
The Fairmont 1009 Condo
The Fairways
The Fairways At Bens
The Falls
The Falls At Lee's Parke
The Falls Garden
The Falls Iii At Grand Harbor Plat 32
The Falls Of Inverrary
The Falls Of Jensen Beach
The Fallswood
The Fallswood Codm
The Fenimore Condo
The Fields
The Fields At Gulfstream Polo
The Fields At Jacobs Way
The Fitz
The Flamingo Condo
The Flats At Heathcote Village
The Flats At Morningside
The Flats At National Harbor
The Flats At Northside
The Flats At Tysons
The Floridian Condo
The Forest Unit 1
The Forum
The Fountainhead Condo
The Fountains
The Fountains At Fontaine
The Fountains I Condo
The Fountains Of Fontaine
The Fountains Of St Lucie
The Four Seasons
The French Village
The Gables At Elm Tree
The Gables At Mount Laure
The Gables Condo
The Gables On Tuckerman
The Gale
The Gallery
The Gallery Plaza Condo
The Garden North
The Gardens
The Gardens At Lauderhill
The Gardens At Owings Mills
The Gardens At Poppleton Creek
The Gardens At River Grove
The Gardens Of Kendall Co
The Gates
The Gates At Doral Isles
The Gatherings
The Gatsby Condo
The Georgian Condo
The Glade
The Gleanings
The Glen
The Glenn
The Glens
The Granary At Draper Farm
The Grand
The Grand Fka Venetia
The Grand Marina
The Grand Marina At Deeri
The Grand Venetian Condo
The Grand View Palace Cond
The Grande
The Grande At Riverview
The Grande Condo
The Grandview Condo
The Grandview Palace
The Grandview Palace Cond
The Grandview Palace Condo
The Green
The Greens
The Greens At Doral Condo
The Greens At Lee's Hill
The Greens At Winston Trails
The Greens At Wisp
The Greens Condo
The Greens Condominiums
The Greens Of Dove
The Greens Of Doyl
The Greens Of Inverrary
The Greens Of Westminster
The Grove
The Grove At Arlington
The Grove At Grand Bay
The Grove At Jackson Village
The Grove At Panther Woods
The Grove Club Condo
The Grove Condominium Sec
The Grove Condominium Section 1
The Grove Resort
The Guards
The Habana Condo
The Hamlet
The Hamlets At South River Colony
The Hammocks
The Hamptons
The Hamptons At Brandon A Condominium
The Hamptons In Woodfield Country Club
The Harbour
The Harbour Condo
The Harbour North Condo
The Harbour South Condo
The Harbours At Solomons Island
The Haven
The Hawthorn Condominium
The Heath
The Heights@ Lebanon
The Hemingway, A Condomin
The Hemingway, A Condominium
The Hemispheres
The Henry
The Hideout
The Highlands
The Highlands At Quarry Lake
The Highlands Condo
The Highlands Condoe
The Hill
The Hill Condos
The Hills
The Hills At Big Spring
The Hills Of Bryn
The Hills Over Mullikan
The Hollows Of Deer Creek
The Holly Woods
The Homestead
The Horizon At Brush Valley
The Horizons Condo #3
The Horizons Condo #5
The Horizons Condo #6
The Horizons Condo #7
The Horizons Condo East
The Horizons West Condo
The Hudson
The Imperial
The Island
The Island At Pga National
The Islands
The Isles
The Isles Condo
The Ivory Residence Condo
The Ivy Condo
The Jamieson
The Jefferson
The Jefferson - Sunrise Senior Living
The Jefferson Club
The Jumeirah Marsa Al Arab
The Kensington Condo
The Kenwood
The Knightsbridge Condo
The Knoll At Irons Lane
The Knolls
The Lakes
The Lakes At Martinsburg
The Lakes At Pga Village
The Lakes At Shell Point S
The Lakes At St Lucie Wes
The Lakes At St Lucie West
The Lakes At The Savannahs
The Lakes At The Savannahs Condo
The Lakes At The Savannahs Condominium
The Lakes At Tradition
The Lana Residences
The Landing At Cannon Branch
The Landings
The Landings At Garden Spot Reserve
The Landings At Hobe Sound
The Landings At Hobe Sound Village
The Landings At Pecan Park
The Landings At River Bridge
The Landings At River Oaks
The Landings Estates
The Landings Sec 1
The Landings Second Sec 5
The Landmark Condo
The Laurels
The Lauren
The Ledges Condo
The Legends
The Leslie Condo
The Lexi Condo
The Lexington Euclid Cond
The Lincoln
The Lincoln Condo
The Links At Avalon
The Links At Gettsburg
The Links At Gettysburg
The Links At Grand Reserve
The Links At Savanna Club
The Links At Savanna Club, 1st Replat
The Links At Sprin
The Little Club
The Little Club Condo
The Lodge Of Northbrook
The Loft At Byron Condo
The Loft Downtown
The Loft Downtown Condo
The Loft Downtown Ii
The Loft Downtown Ii Cond
The Loft Downtown Ii Condo
The Lofts
The Lofts At Abbott Condo
The Lofts At Collins Cond
The Lofts At Harding Cond
The Lofts At Sebastian Co
The Lofts Town Villas Con
The Lorena Condo
The Luxor Residences Cond
The Lynx Golf Estates
The Madison Condo
The Majorcas Condo
The Manhattan Condo
The Manor
The Manors
The Mansion Town House Co
The Mansions On Fisher
The Mantell Condo
The Maples
The Maritime Condo
The Maritimes Condo
The Mark On Brickell
The Mark On Brickell Bay Condo
The Mark On Brickell Cond
The Mark On Brickell Condo
The Martinique
The Meadow At New Market
The Meadows
The Meadows At Colonial Club
The Meadows At Dahlgren
The Meadows At Hei
The Meadows At Martin Dow
The Meadows Florida
The Meadows Lake North Co
The Meadows Of Crystal Lake
The Meadows Of Green Spring
The Meadows Of Hershey
The Meadows Of Palm Beach Gardens
The Meadows Unrec
The Mercedes-Benz Places
The Meridian
The Meridian Condo
The Metropolitan Condo
The Mews
The Mews At Burnham Farms
The Mews At Menlough
The Minorca Condo
The Missions
The Monarch Grove Condo
The Moorings
The Moorings At Aberdeen East
The Moorings Of Manatee Condo
The Moorings Pb 31-52
The Moorings Unit 2
The Moors Cluster Homes
The Moors Sec 1
The Moors Townhouses
The Moyaone Reserve
The Mutiny Condo
The National
The National Country Club
The National Golf & Countr
The Netherland Condo
The New French Village Co
The Niche At 62nd St Cond
The Nolobi Condo
The Norma Condo
The Oaks
The Oaks At Miami Gardens
The Oaks At Moores's Creek Ii
The Oaks At Oaklnd Forest
The Oaks At Wash Woods Condo
The Oaks At Waters Edge
The Oaks Boca Raton
The Oaks Condominums
The Oaks I Condo
The Oaks Of Davie I
The Oaks Of N Londonderry
The Oaks Unit Vii A Condominium
The Oakton
The Oasis
The Oasis At Pearl Lake
The Oasis Condominiums
The Ocean Corporation Subdivision
The Oda Homes Condo
The Oglethorpe
The Olympus
The One Canal
The Orchard
The Orchards
The Orchards Of Sandy Spring
The Orion Codm
The Overlook
The Overlook At Broad Creek
The Paddock
The Paddock @ Equine Meadows
The Palace At Bal Harbour
The Palace Condo
The Palisades
The Palm At Atlantis
The Palm Bay Yacht Club C
The Palm Bay Yacht Club Condo
The Palm Crown
The Palm Estates
The Palms
The Palms 51 Condo
The Palms At Weston
The Palms Condo
The Palms Of Key Biscayne
The Palms Of Pembroke
The Parc At Turnberry Isl
The Parc At Turnberry Isle Condo
The Parc Vendome
The Parc Vendome Condo
The Park At Addison Metro
The Park At Courthouse
The Park Gardens Condo
The Park Townhomes Condo
The Park Vintage Condo
The Parklands
The Parks At North Walnut
The Patricia Condo
The Patrician Of Palm Beach
The Patterns
The Pavilion
The Pavilion Condo
The Peach Orchard
The Peninsula Condo
The Peninsula Condo
The Peninsula Ii Condo
The Perigon Miami Beach
The Phoenix Condominiums
The Pines
The Pines - Pineapple Plantation
The Pines At Cherry Hill
The Pines At West Penn
The Pinnacle
The Pinnacle Condo
The Pinnacle Condominium
The Place At Channelside A
The Plains
The Plantations
The Plaza
The Plaza 851 Brickell Co
The Plaza 901 Brickell Co
The Plaza 901 Brickell Condo
The Plaza At Brickell Cond
The Plaza Of Bal Harbour
The Plaza On Brickell
The Point
The Point Condo
The Pointe
The Pointe On Haystack
The Polo Grounds At Pointe West Pd
The Pond
The Pond At Church Hill
The Ponds
The Ponds At Bayberry
The Porches Of Allenberry
The Port Condo Residences
The Prairie
The Prairies
The Preserve
The Preserve At Avery Lak
The Preserve At Avonlea
The Preserve At Hobe Sound
The Preserve At Indian Point
The Preserve At Ironhorse
The Preserve At Long Branch
The Preserve At New Creek Lake
The Preserve At Park Trace Pud
The Preserve At Piscataway
The Preserve At Savanna Club
The Preserve At Southfields
The Preserve At St. Andre
The Preserve At St. Andrews
The Preserve At St. Andrews Phase 2
The Preserve At The Savannahs Condominium
The Preserve At Timber Ridge
The Preserve At Tuscarora
The Preserve At Wye Mills
The Preserve Of Vero Phase Two Subdivision
The Preserves
The Preserves At Braemar
The Preserves At Cumberland Village
The Preserves At Stonebriar Phase 2
The Presidential Condo
The Preston
The Provinces
The Pt At Newtons Ln
The Racquet Club
The Reaches
The Redland
The Redlands
The Redlands Sec 1
The Redlands Sec 2
The Redlands Sec 3
The Redlands Sec 4
The Reef (Aka Colony Of Rocky Point)
The Regents At Lake Manassas
The Representative
The Reserve
The Reserve At Ch
The Reserve At Doral
The Reserve At Eastpointe
The Reserve At Glen Loch
The Reserve At Grand Harbor
The Reserve At Heritage Harbour
The Reserve At Mullica Hill
The Reserve At Pelican Island Subdivision
The Reserve At Severna Park
The Reserve At Sombrero
The Reserve At Triadelphia Crossing
The Reserve Condominiums
The Reserve Marina Palms
The Reserve Of Pinecrest
The Reserve Willow Pines E At Pga Village
The Reserves
The Residence
The Residences At The Bat
The Residences At The Bath
The Retreat
The Retreat At Westfields
The Rider Residences Miami
The Ridgely
The Ridges
The Ridges @ Belmont Country Club
The Ridges Amend
The Ridges/Fern Ridge
The Ridings
The Ridings At Woolwich
The Rings
The Ritz Carlton Residence
The Ritz-Carlton Residence
The Ritz-Carlton Residences
The Ritz-Carlton Residences West Palm Beach
The Ritz-Carlton Residences, Palm Beach Gardens
The Riviera
The Riviera Arms Condo
The Riviera At Coral Lake
The Riviera Condo
The Riviera Of Chevy Chase
The Roosevelt
The Roosevelt Condo
The Royal Club Condo
The Ruskin Condo
The Sabals
The Sail
The Sail Condo
The Sanctuary
The Sanctuary - Two Rivers
The Sanctuary At Hawks Cay
The Sands
The Sands Sec 1 Condo
The Sands Section 1 Condominium
The Seasons
The Seasons Villas & Thms
The Seasons Villas & Thms Condo
The Seven Palms - A Key West Oasis
The Shamrock Condo
The Sheridan Condo
The Sherwood
The Shireatsomerdale
The Shores Condo
The Shores Condo No 1
The Shores Condo No 2
The Sierra
The Signet
The Singing Woods
The Skylark Condo
The Soundings
The Soundings Yacht And Tennis Club
The Southend
The Southern Colonization
The Southern Colonization Company
The Southern Colonization Company Plat
The Southerner Coloniation Company
The St George Condo
The Stables
The Standard
The Standard Midtown
The Standard Residence
The Standard Residences
The Standart Residences
The Stella Cozumel
The Sterling Condo
The Sticks 111-12 B
The Strand On Ocean Drive
The Summit
The Summit At Lost River
The Summit Condo
The Summit Of Harwood
The Surf Condo
The Talbots Of Fredericktowne
The Tecumseh
The Terrace Condo
The Ths At Sunset Harbour
The Tiers Of Laurel Lake
The Tiffany Of Bal Harbou
The Tiffany Of Bal Harbour
The Timbers
The Tower At Port Royale
The Tower Residences Cond
The Tower Residences Condo
The Towers
The Towers Of Oceanview
The Towers Of Quayside Co
The Towers Of Quayside Condo #4
The Townes At Briar Creek
The Townes At Cambridge
The Townes At Grosvenor Place
The Townes At Hampden
The Townes At Maryland Hall
The Townes At Red Oak
The Townes At Tasker
The Townes At Village Place
The Townes At Washington Square
The Townes Condominium
The Townes Of Berlin
The Townes Of Orrs Bridge
The Townes Of Ridgeway
The Townhomes Of Doral Oa
The Towns At South Alex
The Towns At Walker Mill
The Trails At Oak Woodlands I
The Trails Sub
The Tropical Resort Condo
The Tropics Addn
The Tropics Amd
The Tropics Revised
The Venue
The Venue At Lighthouse Station
The Verse Condo
The Veu Condo
The Victoria Codm
The View
The Views At Bridgewater
The Viking Estates
The Viking Estates Vk3065
The Viking Estates Vk3068
The Vikings
The Village At Collington
The Village At Courthouse Commons
The Village At Greens Of Patuxent
The Village At Hawks Cay
The Village At Lake Anna
The Village At Lakeside
The Village At Waugh Chapel
The Village At Woodstream
The Village By The Sea
The Village Of College Park
The Village Of Stuart Condo
The Village Of Washington Trail East
The Village Park
The Village Southfield
The Villages At Bristol
The Villages At Northridge
The Villages At Pine Valley
The Villages At Wellington
The Villages Condo
The Villages Of Creekside
The Villages Of Lyonsfield Run
The Villages Of Steeplec
The Villages Of Steeplechase
The Villages Of Urbana Greenspring
The Villas
The Villas @ Sv
The Villas At Countryside
The Villas At Falls Run
The Villas At Hawks Cay
The Villas At Hollywoods
The Villas At Regent Par
The Villas At Three Oaks
The Villas At Warm Springs
The Villas Of Rock Oak
The Vines Of Sandhill
The Vineyard
The Vineyards
The Vineyards Codm
The Vintage Condo
The Vintage East Condo
The Vistas
The Vistas Condo
The Vue
The Vue Condo
The Vue Condominiums
The Waterclub Condo
The Waterford
The Waterfront - Highlands Reserve
The Waters At Lake Anna
The Waters Of Weeki Wache
The Waters Of Weeki Wachee
The Waterview
The Waterway
The Waterways
The Wave Condo
The Wave On Bayshore
The Waverly @ South Beach
The Waverly At South Beac
The Waverly At South Beach
The Waverly At Surfside
The Waverly At Surfside B
The Waves
The Waves Condo
The Weldon
The Well
The Well At Harbor Islands
The Well Bay Harbor
The Well Coconut Grove
The West Boundary
The Westerlies
The Westfields
The Wharf
The Wharf Cluster
The White House Condo
The Whitney Town Center
The William Lee Condo
The William Residences
The Willows
The Willows Of Crofton
The Willows Phase 2
The Windjammer Condo Apartments
The Wisconsin
The Wisconsin Codm
The Woodland S/D
The Woodlands
The Woods
The Woods - Mt Springs
The Woods @ Cream Rd
The Woods At Bayside
The Woods At Hidden Creek
The Woods At Meetinghouse
The Woods At Myrtle Point
The Woods At Stoney Ridg
The Woods Resort
The Woodyard
The Yacht Club At Aventur
The Yacht Club At Aventura
The Yorker Condo
Theatre District
Then Run
There Is Not A Subdivision
Thevillasatfiveponds
Third Addn To Sierra
Third Amd Of Por Of
Third Amend Plat Of Porti
Third Avenue Condominium
Third Gulfstream Garden
Third Horizons Condo
Third Miramar Condo
Third Moorings Condo
Third Replat Of Portofino Isles
Thirty Five Sixty Condo
Thirty Five Sixty Condo, Concordia East
Thirty One Twenty Condo
Thirty Six Hundred Ocean Condo
Thirty Two Hundred Condo
Thirty-Three Sixty Condo
Thistle Gardens Condo
Thistledown
Thoburns New Smyrna Beach
Thomas Choice
Thomas Choice Gardens
Thomas Choice West
Thomas Circle
Thomas Cove
Thomas Gardens
Thomas Grove Condo
Thomas Landing
Thomas Landing Ii
Thomas Park S/D
Thompson Creek
Thompson Creek Condos
Thompson Estates
Thompsons Run
Thomson Estates
Thorburn Estates
Thoreau Place Condos
Thornburg
Thornbury
Thornbury Hunt Ii
Thorndale Woods
Thornewood Park
Thornhill
Thornhill Green
Thornleigh
Thornridge
Thornrose
Thornton Wood
Thornwood
Thornwood Farms
Thornwood Village
Thoroughbred Lake Estates
Thoroughbred Lake Estates 2
Thoroughbred Terrace
Thoroughgood
Thousand Acres
Thousand Acres At Dcl
Thousand Oaks
Thousand Oaks Phase 1
Thousand Pines
Thread Haven
Three Eighty Nine Corp Lessee
Three Fifty Condo
Three Flags
Three Flags Of Culpeper
Three Horizons East Condo
Three Horizons North Cond
Three Horizons South Cond
Three Hundred Ocean Blvd Apts Inc
Three Islands 3rd Sec
Three Islands 3rd Section
Three Lakes
Three Mosser North
Three Point Park
Three Pond
Three River Estates
Three Rivers East Condo
Three Run Woods
Three Seasons Condo Bldg
Three Tequesta Point
Three Tequesta Point Cond
Three Thousand South
Threeoaks
Thumb Point
Thumb Point Sub
Thumb Point Subdivision
Thunder Hill
Thunderbird Farm
Thunderbird Park
Thunderbird Ranch
Thunderbird Terrace
Thunderhill
Tiara
Tiara Cond
Tiara Condo
Tiara East
Tiara East Condo
Tiber Island
Tiburon
Tiburon 1 Ph 1
Tiburon I Ph Ii
Tiburon I Ph Iv
Tiburon Ii Ph I
Tiburon Ii Ph Ii
Tidbury Crossing
Tidbury Manor
Tidelands
Tidelands Condo
Tides At Bridgeside Squar
Tides At Bridgeside Square
Tides At Newport Bay
Tides On Hollywood Beach
Tides On Hollywood Beach Condo
Tidesfall
Tidewater Colony
Tidewater Farms
Tidewater Landing
Tidewater Lots Sub
Tidewater Pointe
Tidewater Trail
Tierra Alta
Tierra Del Mar
Tierra Del Mar Condo
Tierra Del Mar Condo South
Tierra Del Rey
Tierra Del Rey Estates South
Tierra Del Sol
Tierra Del Sol Condo
Tierra Verde At Delray Beach Condo
Tierra Verde Condo 07 & 07a
Tiers At Silver Spring
Tiers At Wheaton
Tiers Of Manchester Lakes
Tiffany Apts Co-Op
Tiffany Gardens North Condo
Tiffany Gardens West Cond
Tiffany Gardens West Condo
Tiffany House
Tiffany House Condo
Tiffany Woods
Tigertail Bay Condo
Tilden Woods
Tilford A Condo
Tilford C Condo
Tilford F Condo
Tilford I Condo
Tilford K Condo
Tilford M Condo
Tilford M Condo At Century Village East
Tilford N Condo
Tilford O Condo
Tilford P Condo
Tilford Q Condo
Tilford R Condo
Tilford T Condo
Tilford U Condo
Tilford V Condo
Tilford W Condo
Tilford X Condo
Tilghman
Tilghman Island
Tilghman On Chesapeake
Tillett's View
Tillman Lakes -Chaparral P.U.D Phase Three B
Timber Cove
Timber Creek
Timber Farms
Timber Glen
Timber Grove
Timber Hill Community Assoc.
Timber Hollow
Timber Lake Condo
Timber Lakes
Timber Mill
Timber Mills
Timber Ridge
Timber Ridge Estates
Timber Ridge Farms
Timber Ridge Village Ii Condo
Timber Ridge-Plat 1
Timber Trails
Timber Trails Ii
Timber Villa
Timberbeach
Timberbirch
Timberbrook
Timberbrook Codm
Timbercreek
Timbercreek As
Timbercreek Sub
Timbercrest
Timbergrove
Timberlake
Timberlake Estates
Timberlake First Add
Timberlake First Add 83-2
Timberlake Village
Timberland Estates
Timberland Ii
Timberlane
Timberlawn
Timberline
Timberline Plat Two
Timberline-Plat One>
Timbernook
Timbers
Timbers At Everlands Phase
Timberview
Timberwalk
Timberwalk Ii Sec 4
Timberwalk Pud
Timberwalk Sec 2
Timberwalk Sec 3
Timberwood East
Timberwood Estates
Timberwood Of Potomac
Timberwyck
Timke Estates
Timonium
Timonium Heights
Timothy Branch 55+
Timothy Branch Towns
Tina Mcbride Property
Tingles Addition
Tintern Mills
Tiree Land Condominiums
Title # 3657116 - 3657117 And In # 41725 - 41725b
Titusville
Titusville Fruit & Farm La
Tivoli
Tivoli Isles Pud
Tivoli Lakes
Tivoli Lakes Pud
Tivoli Reserve
Tivoli Trace Condo No 2
Tivoli Trace Condo No 5
Tivoli Trace Condo No 6
Tivoli Trace Condo No 7
Tle1 Trout Lake Estates
Tlg1 Interlachen Lakes Estates
Tlg2 Interlachen Lakes Estates
Tlg4 Trout Lake Gardens
Tlm2 Trout Lake Estates
Toan & Yost
Toby Farms
Tobyhanna
Tockwogh Terrace
Todd
Todd Estates
Todd Estates Ii
Todd Lakes
Todd Township
Todds Tavern Estates
Toddville
Toft Woods
Toftrees
Tohoqua Ph 8a
Tolchester
Tolchester Estates
Toledo
Toledo Villas Condo
Toll Brothers At West Park
Tollgate
Tolson Heights
Tom Gafisa
Tomes Landing
Tomlinson Green
Toms River
Toms River Twp
Tomstown
Tony Tank
Tooke Oj Unrecorded
Top Of The Mile
Top Of The Mile South
Top Of The Mile South Condo
Top Ridge Tr Pk
Top Road
Topaz North Condo
Topaz South
Topaz South Condo
Topfield
Topfield Condominium Townhouses
Tor-Bryan Estates
Torino
Torpedo Factory
Torre Aura 360 Condo
Torremar Condo
Torrent Sub
Torres De Jamundi
Torres Tower
Torresdale
Torresdale (East)
Torresdale (West)
Torresdale Manor
Torrey Pines
Tortuga Beach
Toscana
Toscana Isles
Toscana Isles Pud Pl
Toscana Isles Pud Pl 2
Toscana North Condo
Toscana South
Toscana South Condo
Toscana South Tower Iii
Toscana West Condo
Toscano Condo
Totterdale Add
Tourist Nook Delray
Towamencin Condos
Towamensing Trail
Towamensing Trails
Towanda
Tower 155
Tower 155 Condo
Tower 1800 Condo
Tower At Biscayne Cove Co
Tower At Biscayne Cove Condo
Tower City
Tower Condo At Cityplace
Tower East Incorporated C
Tower East Incorporated Condominium
Tower Forty One Condo
Tower Hill
Tower Hill Estates
Tower Iii
Tower Oaks
Tower Portsmouth At Port
Tower Residences
Tower Shores
Tower Villas
Towerhouse Condo
Towers Grande Condominium
Towers In Westchester
Towers In Westchester Park
Towers North Condo
Towers Of Kendale Lakes C
Towers Of Key Biscayne Co
Towers Of Ocean View
Towers Of Oceanview East
Towers Of Oceanview South
Towers Of Porto Vita-Nort
Towers Of Porto Vita-Sout
Towers Of Quayside Condo
Towers Of Westland Condo
Towers Quayside Ct-Yard V
Town & Country Apts Condo
Town & Country Condo Phas
Town & Country Estates
Town & Country Estates Co
Town & Ranch Estates
Town & Ranch Ests
Town Acres
Town And Country
Town And Country Gardens
Town Center
Town Center At Camp Springs
Town Center Commons
Town Colony Condo
Town Creek
Town Creek Manor
Town Lakes Ph 3
Town Of Avon Park Sec 22
Town Of Bath
Town Of Berryville
Town Of Cambridge
Town Of Centreville
Town Of Citrus Park, Lot 3
Town Of Colonial Beach
Town Of Concord
Town Of Culpeper
Town Of Dania
Town Of Delray
Town Of Denton
Town Of Easton
Town Of Federalsburg
Town Of Fellsmere
Town Of Fla City
Town Of Florida City
Town Of Front Royal
Town Of Greensboro
Town Of Gulf Stream
Town Of Hallandale B-13
Town Of Hamilton
Town Of Harding Sec 02
Town Of Hedgesville
Town Of Hialeah 1 Addn Am
Town Of Hialeah 1st Addn
Town Of Hialeah Fla
Town Of Homestead Proper
Town Of Indian Head
Town Of Irvington
Town Of Lake Worth
Town Of Lake Worth: Tropical Ridge
Town Of Leesburg
Town Of Louisa
Town Of Luray
Town Of Melrose
Town Of Middleburg
Town Of Mineral
Town Of Modelo (Dania) B
Town Of Modelo (Dania) B-
Town Of Modelo (Dania) B-49
Town Of Mount Jackson
Town Of Oakland
Town Of Orange
Town Of Port Royal
Town Of Preston
Town Of Purcellville
Town Of Remington
Town Of Ridgely
Town Of Rock Hall
Town Of Round Hill
Town Of Santa Rosa
Town Of Sebring 7th Add
Town Of Shenandoah
Town Of Stanley
Town Of Sudlersville
Town Of Trappe
Town Of Venus
Town Of Vienna
Town Of Washington
Town Of Waterford
Town Of Whitehall
Town Parc @ Mira Lago
Town Parc @ Miralago
Town Park Heights
Town Park Plaza North Con
Town Park, Stockton
Town Place
Town Place At Delray
Town Place Club Villas
Town Place Condo I And Ii
Town Place Townhomes
Town Point
Town Square Condo
Town Square Towers
Town Villas
Town Villas At Moon Lake
Towne And Country
Towne Greene Condo
Towne Haven
Towne Oak Village
Towne Park Replat No. 2
Towne Park Tr F
Towne Park Tr J
Towne Point
Towne Row
Towne Royale Condo
Townes At Bungalow
Townes At Cameron Parke
Townes At Chatham Glenn
Townes At Chester Springs
Townes At Forest Hills
Townes At Goose Creek Village
Townes At Hershey
Townes At Malvern
Townes At Shady Grove
Townes At Springford
Townes At Tate Manor
Townes At West Windsor
Townes Condominiums
Townes Of Ashleigh
Townes Of Burke
Townes Of Gloucester
Townes Of Hillwood
Townes Of Manchester Woods
Townes Of Moorefield
Townes Of Orange Hunt
Towngate
Towngate Condo Eleven
Towngate Condo Four
Towngate Condo Nine
Towngate Condo Seven
Towngate Condo Six
Towngate Condo Ten
Towngate Condo Thirteen
Towngate Condo Three
Towngate Condo Twelve
Towngate Condo Two
Towngate North
Towngate South Sec 2
Towngate South Sec 3
Towngate--Classic Vista
Townhomes At Conniston
Townhomes At Deer Creek
Townhomes At Riverwalk
Townhomes Of Boca Delray
Townhomes Of Boca Delray Condo
Townhomes Of Doral Place
Townhomes Of Lighthouse Point
Townhomes Of Marlwood At Pga National
Townhomes Of Monterey
Townhomes Of Oriole Ii
Townhomes Of Plantation
Townhomes Of Portsview
Townhomes Of Portsview Condo
Townhouse East 1 Condo
Townhouse Isle Sec 1
Townhouse Village Condo
Townhouses At Frazier Creek
Townhouses At Harbor Beach Condo
Townhouses At Jacaranda C
Townhouses At Jacaranda Condo 16
Townhouses At Nova
Townhouses At Nova 2
Townhouses At Nova 3
Townhouses Of Emerald Hil
Townhouses Of Emerald Hill
Townhouses Of Emerald Hills
Townhouses Of Highland Be
Townhouses Of Highland Beach Condo
Townhouses Of Plantation
Townhouses Of The Calif C
Townhouses Of Venetian Pa
Townhouses Shores Condo
Towns At Meridian
Towns At Parke West
Towns At Seascape
Towns At Stuart Point
Towns Of Forest Hills
Towns Of Oak Springs
Towns Of Tanglewood
Townsend Fields
Townsend Inl Area
Townsend Place
Townsend Place Condo
Townsend Station
Townsend Village
Townsend Village Ii
Township 3 South.
Townsite Apts Four Condo
Townsite Plat Of Roseland
Towson
Towson Estates
Towson Green
Towson Manor
Towson Manor Village
Towsongate Condominiums
Tr 53
Tr M3 Pl
Tract 5 Southern Colonization
Tract 7
Tract C Of Mission Bay
Tract C Subdivision
Tract D Of Mission Bay
Tract M-2 Plat
Tracys Landing
Trad At Ridley Creek
Trade Winds Estates First
Trade Winds Estates First Add
Trade Winds West
Traders Crossing At Jonat
Traders Crossing At Jonathan's Landing
Traders Crossing At Jonathans Landing
Traders Landing
Tradewinds A Condo
Tradewinds At Dos Lagos
Tradewinds At Dos Lagos C
Tradewinds At Dos Lagos Condo
Tradewinds B Condo
Tradewinds By The Sea
Tradewinds By The Sea Con
Tradewinds By The Sea Condo
Tradewinds C Condo
Tradewinds Homes Subd
Tradewinds Of Pompano Beach
Tradewinds Of Pompano Condo
Tradition 29
Tradition Plat No 5
Tradition Plat No 15
Tradition Plat No 16
Tradition Plat No 18
Tradition Plat No 19
Tradition Plat No 19 Replat No 4 Townpark Phase 1
Tradition Plat No 2
Tradition Plat No 20 - The Preserve - Phase 2
Tradition Plat No 21
Tradition Plat No 28
Tradition Plat No 28/Vitalia
Tradition Plat No 29
Tradition Plat No 3
Tradition Plat No 30
Tradition Plat No 35
Tradition Plat No 4
Tradition Plat No 48
Tradition Plat No 72
Tradition Plat No 8
Tradition Plat No 9
Tradition Plat No. 35 (Pb 52-1) Lot 670
Tradition Plat No. 75
Tradition Plat No. 77
Traditions At Christiana
Traditions At Hamilt
Traditions At Inni
Traditions At Jester
Traditions At Long
Traditions At Skip
Traditions At Whitehall
Traditions Of America At East Petersburg
Traditions Of America At Lititz
Traditions Of America At Silver Spring
Traditions Of America At West Brandywine
Trafalgar Flats
Trafalgar Of Highland Beach
Trafalgar Of Highland Beach Condo
Trafalgar Towers
Trafalgar Towers Condomin
Trafalgar Towers Condominium
Trafalgar Towers Condominium 2
Trafalgar Towers Ii
Trafalgar Towers Two
Trafalgar Vlg Ph 2
Trail Park
Trail Run Sec 2
Trail Run Sec 3
Trail Side
Trail View
Trailer City
Trailer City
Trails
Trails At Beech Creek
Trails At Canyon
Trails At Marsh Creek
Trails At Royal Palm Beach Condo
Trails At Woodlot
Trails End Sub
Trails End Villas Inc Condo
Trails Of Beaver Creek
Trails Of El Rancho Acres
Trails West
Trailwood
Tralee Forest
Tranquility Condo
Tranquility Of Sebastian
Tranquility Ridge
Tranquility Townhomes
Tranquilla
Trappe
Trasona At Addison Village
Trasona East
Traumerei Farm
Travertine
Traymore
Treasure Bay Club Condo
Treasure Coast Air Park
Treasure Coast Airpark
Treasure Coast Isles
Treasure Cove
Treasure Cove Dunes
Treasure Island
Treasure Island Unit 11
Treasure Island Unit 2
Treasure Island Unit 3
Treasure Island Unit 4
Treasure Island Unit 6
Treasure Island Unit 7
Treasure Island Unit 8
Treasure Lake
Treasure Mountain Estates
Treasure Plaza
Treasures On The Bay Ii C
Treasures On The Bay Ii Condo
Treasury Condo The
Tree Bank At North Mtn
Tree Garden Condo
Tree Lake
Tree Top
Treebrooke Condominium
Treehouses I Of R
Treehouses Ii Of R
Treeland Hills
Treeside
Treetop Condo
Tregor Estates Ii
Trellis At Bayshore
Trellises 1b Condo
Trellises 4a Condo
Trellises 5a Condo
Trellises 6a Condo
Tremont
Trench Hill Estates
Trends At Boca Raton Unit 1
Trends At Boca Raton Unit Iv
Trent
Trent C Condo
Trent Condominium
Trent Condominium G
Trent Condominium H
Trent Condominium Trellises
Trentino Estates
Treover Condominium
Tres Belle Pud B & C 01
Tres Tesoros Subdivision
Tresslers Twin Lakes Unrecorded
Trestle Woods
Tresulee
Trevi At The Gardens
Trevose
Trevose Hgts
Treywood
Triangle
Triangle Add To Pompano
Trianon
Trianon Condo
Tribeca At Camp Springs
Trice Meadows
Tricia Meadows
Tricity Plat
Trident Residence
Trieste At Boca
Trillium
Trimble Hills
Trimble Meadows
Trindle Park
Trindle Place
Trindle Spring Heights
Trindle Station
Trinidad
Trinidad & Tobago Fyzabad
Trinidad And Tobago, Mayar
Trinity Oaks (A Of E)
Trinity Vicinity
Triple C Estates
Triple Crown Estates
Triple H Ranch Plat
Triple J Mhp
Tripletts Addn To Goulds
Tripoli
Tripoli Heights
Triton Condo
Triton Tower Condo
Trittipoe
Trolley Square
Troon North At Lee's Hill
Trop G A Un 6 Blk81 Lt 9 2
Tropic Bay Condo
Tropic Fair Condo South
Tropic Groves Condo
Tropic Groves Villas
Tropic Groves Villas J
Tropic Harbor
Tropic Harbor Condo Part
Tropic Harbor Condo Part Seven
Tropic Harbor Condo Part Six
Tropic Harbor Condo Part Three
Tropic Isle
Tropic Isle 2nd Sec
Tropic Isle 3rd Sec
Tropic Isle 6th Sec
Tropic Palms
Tropic Palms 1
Tropic Palms 2
Tropic View Condo
Tropic Villas
Tropic Vista
Tropicair Apts Co-Op
Tropical Acres
Tropical Acres Mhp Co-Op
Tropical Atlantic Shores
Tropical Bay
Tropical Bay Add No 3
Tropical Beach
Tropical Breeze Townhouse
Tropical Country Estates
Tropical Court Villas No
Tropical East
Tropical Estates
Tropical Estates 1st Addn
Tropical Ests
Tropical Ests 1st Addn
Tropical Farms
Tropical Fruit Farms
Tropical Gardens Amen Plat
Tropical Golf Acres
Tropical Gulf Acre
Tropical Gulf Acres
Tropical Gulf Acres Un 9
Tropical Haven
Tropical Highlands
Tropical Highlands 1st Ad
Tropical Highlands 2nd Ad
Tropical Homes
Tropical Isle
Tropical Isle Homes Resub
Tropical Isle Homes Sub
Tropical Isle Homes Sub 1
Tropical Isle Homes Sub 2
Tropical Isle Homes Sub 2n
Tropical Isle Homes Sub 3
Tropical Isle Homes Sub 4
Tropical Isles
Tropical Landings
Tropical Landings Condo
Tropical Manor Condo
Tropical Manors
Tropical Manors Add
Tropical Mobile Home Villa
Tropical Park
Tropical Park Condo
Tropical Point No 2
Tropical Terrace
Tropical Terrace Condo
Tropicana Gardens Inc
Tropicana Park Homes
Tropicana Resort
Tropico
Tropico A Sub
Tropicolony Inc No 4
Trossbach Estates
Trotters Chase
Trotters Glen
Trotting Center Property Pud
Trout Lake Shores
Trout Pond
Trout Pond Property Owners Association
Trout Run Forest
Trovinger Mill Estates
Trowbridge
Troxell Manor
Tru Vale Acres
Truitt Homestead
Truitts Subrbn Dev
Trump Hollywood
Trump International
Trump International Beach
Trump International Sones
Trump International Sonesta
Trump Palace Condo
Trump Royale
Trump Royale Condo
Trump Tower
Trump Tower Ii Condo
Trump Tower Iii Condo
Truro
Truxton Circle
Truxton Heights
Tryp
Tryp By Wyndham
Tuckahoe Springs
Tuckerman Station
Tuckerman Station Codm
Tuckers Reach
Tuckerton
Tuckerton Beach
Tuckerton Boro
Tuckerton Meadows
Tudor Condo
Tudor Grove At Timber Springs
Tudor House Condo
Tudor Oaks
Tudor Oaks (Th)
Tudor Two South Condos
Tudor Village In Margate
Tufton Farms
Tula Parc-Ph 1
Tulip Gardens Condo
Tulip Grove At Belair
Tulip Hill
Tullertown
Tunison Palms
Tunison Palms Sec 1
Tunison Palms Sec 2
Tunison Park
Tunkhannock Trails
Turbnberry Ocean Club
Turbridge
Turf Valley
Turkey Hill
Turkey Hill Sub
Turkey Point
Turnberry
Turnberry Courts At Leis
Turnberry East
Turnberry Farm
Turnberry Green
Turnberry Isle
Turnberry Isle Condo
Turnberry Isle North Condo
Turnberry Isle South Cond
Turnberry Isle South Condo
Turnberry Ocean Club
Turnberry Ocean Club Condo
Turnberry Ocean Colony
Turnberry Ocean Colony No
Turnberry Ocean Colony So
Turnberry On The Green
Turnberry On The Green Co
Turnberry On The Green Con
Turnberry On The Green Condo
Turnberry Tower
Turnberry Towers Condo
Turnberry Village
Turnberry Village Condo
Turnberry Village So Towe
Turnberry Vlg No Tower Co
Turnbull Estates
Turnbury
Turner Station
Turners
Turners Field
Turtle Bay
Turtle Bay Sec 1
Turtle Cove
Turtle Creek
Turtle Creek Apartment Buildings Condo
Turtle Creek East Condo
Turtle Run
Turtle Run At Lakes Of Palm
Tuscan Isles
Tuscan Lake Villas
Tuscan View Condominium
Tuscan Villas Condo
Tuscana 1 Condo
Tuscana 3 Condo
Tuscana Ii A Condo
Tuscany
Tuscany 1
Tuscany 173-129 B
Tuscany At Abacoa
Tuscany At Abacoa 2
Tuscany At The Lakes
Tuscany Bay
Tuscany Condos
Tuscany No 1
Tuscany No 1 Condo
Tuscany No 3 Condo
Tuscany No 4 Condo
Tuscany Of Palm Beach Condo
Tuscany On The Intracoastal
Tuscany On The Intracoastal Condo
Tuscany Par A/B
Tuscany Par C
Tuscany Par E
Tuscany Plat
Tuscany Pointe Ph 1
Tuscany Preserve
Tuscany South
Tuscany Village
Tuscany, Italy
Tuscany-Canterbury
Tuscarora
Tuscarora Creek
Tuscarora Knolls
Tuscarora Pike
Tuscarora Village
Tuscawilla (Aka Canopy Creek)
Tuscawilla Hills
Tuscawilla Pud Replat
Tuskegee Park
Tussock Estates
Tuttles Sub
Tuxedo Park
Twelfth St Manors
Twelfth St Manors 1st Add
Twelve Oaks
Twelve Oaks Cond Phase I & Twelve Oaks Cond Cluste
Twelve Oaks Condo
Twelve Pillars
Twelve Pillars Co-Op
Twenty Five Forty Two Corp Of Hampshire Gard
Twenty Five Hundred South Ocean Blvd Condo
Twenty Oaks
Twenty One Hundred Condo
Twenty Seven Seventy South Ocean Blvd
Twenty Six Hundred Condo
Twenty Two Ninety Five South Ocean Blvd
Twin Acres
Twin Arch Crossing
Twin Brook Mhp
Twin Fountains Phase Two
Twin Fountains Replat
Twin Grove
Twin Harbors
Twin Hill Meadows
Twin Hills
Twin Homes Village #4 Con
Twin Homes Village Ii Con
Twin Lake
Twin Lake Estates
Twin Lake Estates Unit 13
Twin Lake Gardens
Twin Lake Grove Sub
Twin Lake Manor Sub
Twin Lake Overlook
Twin Lake Shores Central
Twin Lake Villas
Twin Lakes
Twin Lakes 1st Add
Twin Lakes Ests
Twin Lakes Homes Sec 3
Twin Lakes Homes Sec 4
Twin Lakes Manor Sub
Twin Lakes Overlook
Twin Lakes Resub Of Blks
Twin Lakes South & Town V
Twin Lakes South & Town Villas Condo
Twin Lakes South Condo
Twin Maples Mobile Home P
Twin Oaks
Twin Palm Park
Twin Pines
Twin Ridge
Twin Rivers
Twin Shields Estates
Twin Towers Condo
Twin Water
Twin Willows
Twin Woods Condo
Twinbrook
Twinbrook Forest
Twinkling Acres
Twisting Acres
Two City Plaza Condo
Two Johns
Two Midtown Miami Condo
Two Midtwon Miami
Two North Breakers Row Condo
Two Park Grove Condo
Two Rivers
Two Tequesta Point Condo
Two Thousand Condo
Twymans Mill
Tyler Gardens
Tyler Park
Tyler Village
Tyler Walk
Tylertown
Tymber Creek Phase 1
Tyrone
Tyrone Acres
Tysons Corner
Tysons Court
Tysons Green
Tysons Ridge
Tysons Station
Tysons West
U S Lend Lease Plat No On
U S Lend Lease Plat No One
U Street
U Street Corridor
U. S. 19 3rd Addition
Udko Sub
Ulelah Rev Plat
Ulmstead Estates
Ulmstead Gardens
Ulrich's Subdivision
Ultimar Two Condo
Umbra Gardens Condo
Una Residence Unit 803
Una Residences
Una Residences Condo
Unassigned
Undeveloped Residential
Unicorn Manor
Unicorporated
Unincorporated
Unincorporated Lee County
Unincorporated Loxahatchee
Unincorporated Miami-Dade
Uninjcorporated
Union Farm
Union Hill
Union Mill Estates
Union Park At Mclean
Union Park Gardens
Union Square
Union Station
Union Township
Uniontown
Unionville Crossing
Unison
Unit 09 Block 35, Lot 14 Lee County Lehigh Acres
Unit 1 Monticello Park
Unit 15
United Ranches
United States
Unity Heights
Univ Park East Sec 1
Univ Park East Sec 3
Univeristy Center
Universal Estates South A
University
University Acres
University City
University Courts Sub
University Estates
University Gardens
University Heights
University Heights 1st Add
University Homes Sec 1
University Lakes
University Manors 1st Add
University Manors Condo N
University Mnr
University Oaks Manor
University Parc Residence
University Parc Residences Condo
University Park
University Park Parcels 1
University Park Parcels 4 5 & 6
University Park Parcels 9
University Park West Sec
University Place
University Place Condo
University Shores
University Towers Codm
University Town Center
University Trail
University Trail Condo
University Village East I
Unkn
Unknown
Uno Lago
Unplatted
Unplatted Subdivision
Unrec Sub Se Cor Sec 2-37-29
Unrec Tracts In 09-19s-21e
Unrec Tracts In 17-20s-21e
Unrec Tracts In 23-18s-19e
Unrec Tracts In 34-18s-17e
Unrecorded
Unrestricted
Unsubdivided
Unsworthville
Up Country
Upland Heights
Upland Mystic Islands
Upminster C Condo
Upminster E Condo
Upminster F Condo
Upminster H Condo
Upminster I Condo
Upper Twp
Upper Allen
Upper Allen Twp
Upper Black Eddy
Upper Darby Twp
Upper Deerfield Twp
Upper Deerfield Twsp
Upper Dublin Twp
Upper East Side
Upper Falls
Upper Fells Point
Upper Freehold
Upper Holmesburg
Upper Hooper Island
Upper Macungie
Upper Marlboro
Upper Matecumbe
Upper Moreland Twp
Upper Morningside
Upper Morningside 1st Ad
Upper Park Heights
Upper Seneca Crest
Upper Southampton
Upper Strasburg
Upper Township
Upper Tract
Upperco
Uppereast Sidebisc Heights
Upton
Uptown Lofts Condo
Uptown Marina Lofts
Uptown Marina Lofts Condo
Urb Sta Teresita
Urb. El Vigia
Urban Core
Urban Village At 5th Ave
Urban Village At 5th Ave Condo
Urbana
Urbana At Residences
Urbana At The Residence
Urbana At The Residences
Urbana Highlands
Urbana Villas
Urbanizacin Antigua
Urbanizacin La Zurza Ii
Urbanizacion Las Cumbres
Urbanizacion Metropolis
Urbanizacion Paraiso Del C
Us 27 County Line To Lk Glenada
Us Highway 27
Us211
Usnee Gardens Condo
Utility Drive Commerce Park
Utopia
Uvero Alto
Uwchlan Hunt
V I P Vacation Island Play
Va Beach
Va Holding Corp
Vaca Village (49.5)
Vacant Land
Vacant Residential
Vacation Est
Vale Meadows
Vale Spring Woods
Valencia
Valencia Acres
Valencia At Abacoa
Valencia Bay
Valencia Condo
Valencia Condominium
Valencia Court
Valencia Cove
Valencia Cove Agr Pud Pl
Valencia Cove Agr Pud Pl 8
Valencia Del Mar
Valencia Estates
Valencia Falls
Valencia Falls 3
Valencia Falls 4
Valencia Falls 8
Valencia Falls 9
Valencia Falls Pl 10
Valencia Golf & Country Club Ph 2
Valencia Grand
Valencia Grove
Valencia Grove At Riverland
Valencia Grove, Riverland
Valencia Isles
Valencia Isles 1
Valencia Isles 3
Valencia Lakes
Valencia Lakes 1
Valencia Lakes 2
Valencia Lakes 3
Valencia Palms
Valencia Palms 01
Valencia Palms 1
Valencia Palms 3
Valencia Palms 4
Valencia Parc
Valencia Parc At Riverland
Valencia Pointe
Valencia Pointe 1
Valencia Pointe Pl 1
Valencia Reserve
Valencia Shores
Valencia Shores 04
Valencia Shores 1
Valencia Sound
Valencia Terrace Condo
Valencia Townhomes
Valencia Village Condo Ph
Valencia Village Condo Phase I
Valencia Village Condo Phase Ii
Valencia Walk
Valencia Walk At Riverland
Valencia Walk At Riverland - Plat Six
Valentine Ests
Valentine Villas
Valentines Sub B-29
Valewood Estates
Valle De Angeles, Honduras
Valle Del Cauca
Valley Creek Estates
Valley Crossing
Valley Farm Estates
Valley Forge Crossin
Valley Forge Mtn
Valley Forge Tower
Valley Forge Tr Pk
Valley Forge Woods
Valley Gate
Valley Glen
Valley Green
Valley Green Condo
Valley Green Estates
Valley Greene
Valley Heights
Valley Hi
Valley High Ests
Valley High Timber Farms
Valley Hill Farms
Valley House
Valley Lee
Valley Mede
Valley Mill Farms
Valley Park
Valley Po
Valley Ridge
Valley Run
Valley Spring Estates
Valley Springs
Valley Square Towns
Valley Stream
Valley Stream Estates
Valley View
Valley View Blandon
Valley View Ephrata
Valley View Estates
Valley View Ests
Valley View Village
Valley Vista
Valley Wood
Valleybrook
Valleybrook Estates
Valleys Of Kendall
Valleys Of Towson
Valleywood At Five Farms
Vallhala Village
Vallhala Village Condo
Van Bibber
Van Bibber Manor
Van Dorn Village
Van Dyke Village
Van Lakes Three
Van Lear
Van Lear Manor
Van Ness
Van Ness North
Van Vlecks
Vanderbilt Beach
Vanderbilt Park
Vanderbilt Park Amd Pl
Vanderbilt Towers 3 A Cond
Vanderhoff Sub
Vanguard Village In The
Vanguard Village In The Mainlands Community Two
Vann Sub
Vannoy Acres
Vantage Point East @ Leisure World
Vantage Point East At Leisure World
Vantage Point West At Lw
Vantage Pointe
Vantage View
Vantage View Condo
Vantrician Subdivision
Varadero Condo
Varisty Lakes
Varsity Heights
Varsity Lake
Vasper Sub
Vecino Del Mar
Vecino Del Mar Condo
Vedado
Veirs Mill Village
Velero
Velvet Hills
Velvet Valley
Vendilane Estates
Vendo
Vendo Villa De Lujo
Vendome Place Condo
Venegono Lombardy Italy
Venetia Condo
Venetia Gardens Condo
Venetia Gardens South Con
Venetia Grove
Venetian Acres
Venetian Bay Village Condo
Venetian Condo
Venetian Condominium
Venetian Development Sub-
Venetian Garden Rev
Venetian Gardens Acrespb
Venetian Gardens At Count
Venetian Gardens At Country Club
Venetian Grove - Phase 1
Venetian Isle
Venetian Isles
Venetian Isles 1st Sec
Venetian Isles 2nd Sec
Venetian Isles 2nd Sec 45
Venetian Isles 3rd Sec
Venetian Isles 3rd Sec.
Venetian Manor Condo
Venetian Parc
Venetian Parc West
Venetian Park
Venetian Park Co-Op
Venetian Park Gardens
Venetian Park Gardens Con
Venetian Park Gardens Condo
Venetian Park Iii Condo
Venetian Park Iv Condo
Venetian Park V
Venetian Place Condo
Venetian Sec Keystone Poi
Venetian Shores
Venetian Shores No 1
Venetian Shores No 2
Venetian Shores No 3
Venetian Terrace Condo
Venetian Village
Venetian Villas
Venetian Villas Of So Bea
Venezia
Venezia Homes Estates
Venezia Homes Estates Ist
Venezia Las Olas Condo
Venice
Venice 6-4 B
Venice 8-12 B
Venice Arms
Venice Ashby
Venice Isle Condo
Venice Isle Tower Condo
Venice Park
Venice Resub In Blks 3 & 4
Venice Resub Of Blks 5 &
Ventanas At Homestead
Ventnor
Ventnor B Condo
Ventnor City
Ventnor E Condo
Ventnor G Condo
Ventnor H Condo
Ventnor Heights
Ventnor I Condo
Ventnor K Condo
Ventnor O Condo
Ventnor P Condo
Ventnor Q Condo
Ventnor R Condo
Ventnor S Condo
Ventry At Edgmont Preserve
Ventry Farm
Ventura
Ventura At Malibu Bay
Ventura At Mission Bay
Venture
Venture At Aventura East
Venture At Aventura East Condo
Venture At Aventura West
Venture At Aventura West Condo
Venture Homes
Venture Out
Venture Out At Indian Rive
Venture Out At Indian River Inc Sec D
Venture Out Sec C
Venue At Cobblestone Creek
Venue At Longview
Venue At Smithville Greene
Venue At Winchelsea
Vera Villas 1st Sec
Vera Vruz
Verabella Falls Condo
Veracruz
Veranda
Veranda At Doral Condo No
Veranda Bay
Veranda Condo
Veranda Condominium
Veranda Estates Phase 1
Veranda Gardens
Veranda Gardens East Phase 4
Veranda Landing
Veranda Oaks
Veranda Plat No 4 Veranda Gardens West Phase 2
Veranda Plat No 6 Veranda
Veranda Plat No 8 Veranda Gardens East Phase 2
Veranda Plat No. 9
Veranda Preserve
Veranda Preserve West Ph 2
Veranda Preserve West Pha
Veranda Preserve West Phase 3
Verandah Bay
Verano
Verano (Pga Village)
Verano At Delray Condo
Verano At Miramar
Verano At Miramar Condo
Verano Pud 1 Plat No 15
Verano Pud No 1
Verano Pud No 1 Plat No 1
Verano Pud No 1 Plat No 11- Replat One
Verano Pud No 1 Plat No 14
Verano Pud No 1 Plat No 16
Verano Pud No 1 Plat No 19
Verano Pud No 1 Plat No 20
Verano Pud No 1 Plat No 21
Verano Pud No. 1 Plat No.
Verano Pud No. 1 Plat No. 17
Verano Pud No. 1 Plat No. 22
Verano South - Pod C - Pl
Verano South - Pod C - Plat No. 2
Verano South - Pod G - Plat No. 4
Verano South / Crosstown Commons
Verano South Pud 1 - Pod
Verano South Pud 1 - Pod A - 1
Verano South Pud 1 - Pod A - Plat No. 1
Verano South Pud 1 - Pod A - Plat No. 3
Verano South Pud 1 - Pod B - Plat No. 1
Verano South Pud 1 - Pod B - Plat No. 3
Verano South Pud 1 - Pod C - Plat No. 1
Verano South Pud 1 - Pod C - Plat No. 3
Verano South Pud 1 - Pod C - Plat No. 4
Verano South Pud 1 - Pod D
Verano South Pud 1 - Pod D - 4 - Rep 2
Verano South Pud 1 - Pod D - Plat No. 2
Verano South Pud 1 - Pod D - Plat No. 2 - Replat
Verano South Pud 1 - Pod D - Plat No. 4 - Replat N
Verano South Pud 1 - Pod E - Plat No. 2
Verano South Pud 1 - Pod G - Plat No. 1
Verano South Pud 1 - Pod G - Plat No. 2
Verdana Groves
Vereda Bobadilla
Vereda Las Cuchillas
Vereda Palestina, Town Of Salento Quindo
Vereda Tomogo
Vereda Zamorano
Verena Park
Vermare
Vermilion Hill
Vermont Gardens
Vernon Court
Vernon Heights
Vernon L Kemp
Vernon On Potomac
Vero Beach Estates
Vero Beach Highlands Unit
Vero Beach Highlands Unit 1
Vero Beach Highlands Unit 2
Vero Beach Highlands Unit 3
Vero Beach Highlands Unit 4
Vero Beach Hotel And Club A Condo
Vero Lake Estates
Vero Lake Estates Unit 1
Vero Lake Estates Unit C
Vero Lake Estates Unit D
Vero Lake Estates Unit E
Vero Lake Estates Unit G
Vero Lake Estates Unit H
Vero Lake Estates Unit H-
Vero Lake Estates Unit H-1
Vero Lake Estates Unit H-2
Vero Lake Estates Unit H-3
Vero Lake Estates Unit H-4
Vero Lake Estates Unit I
Vero Lake Estates Unit J
Vero Lake Estates Unit K
Vero Lake Estates Unit L
Vero Lake Estates Unit M
Vero Lake Estates Unit N
Vero Lake Estates Unit O
Vero Lake Estates Unit P
Vero Lake Estates Unit Q
Vero Lake Estates Unit R
Vero Palm Estates
Vero Park 2
Vero South Prd-Phase One
Vero Tropical Gardens Uni
Vero Tropical Gardens Unit 1
Vero Tropical Gardens Unit 2
Verolago
Verolago Phase 1
Verolago Phase 2
Verolago Phase 5
Veromar
Verona At Deering Bay Con
Verona Estates
Verona Oceanside
Verona Palms
Verona Trace Sub & The Villas At Verona Trace
Verona Woods
Versaille Gardens I Condo
Versailles
Versailles Co-Op
Versailles Gardens
Versailles Gardens Condo
Versailles Plaza Condo
Versailles Pud
Versialles Gardens Ii Con
Vessel
Vest Pocket Lake Worth Farms In
Vestal Subdivision
Vesubio Sub 1st Addn
Via Delfino
Via Flagler Condo
Via Lago
Via Veneto
Via Ventura
Via Ventura Neighborhood
Via Ventura Neighborhood 1
Via Ventura Neighborhood 2
Via Venture Neighborhood
Via Vizcaya
Viburnum Hoa
Viceroy
Viceroy Brickell
Viceroy Brickell Condo
Viceroy Brickell Unit 4014
Viceroy Fort Lauderdale
Viceroy Residences
Vicking
Victor's Point
Victoria Condo
Victoria Crossi
Victoria Crossing
Victoria Falls
Victoria Forest
Victoria Gardens
Victoria Glen
Victoria Highlands Amd Plat
Victoria Isles
Victoria Manor
Victoria Palms Condo
Victoria Parc -Tradition Plat No. 29
Victoria Park
Victoria Park Corr Amen P
Victoria Park Corr Amen Pl
Victoria Park Corr Amen Plat
Victoria Park Place
Victoria Park Re-Amended Plat
Victoria Park Tower Condo
Victoria Plantation
Victoria Pointe
Victoria Square Condo
Victoria Station
Victoria Towers Condo
Victoria Village A Condo
Victoria Village C Condo
Victoria Village E Condo
Victoria Village F
Victoria Village F Condo
Victoria Village G Condo
Victoria Village H Condo
Victoria Village J Condo
Victoria Village K Condo
Victoria Woods 1
Victoria Woods 2
Victoria Woods 3b
Victoria Woods 4
Victorian Apts Of Cape Canaveral Condo
Victorian Village
Victoriana
Victorias Grant
Victorias Landing
Victory Gardens
Victory Gardens Condo
Victory Lakes
Victory Square
Victory Villa
Vienna
Vienna Acres
Vienna Hills
Vienna Woods
View West Condo Ph I
Viewpointe
Viewpointe Condo
Viilage Green 2
Viking
Viking / Prairie
Viking /Prairie
Viking 2
Viking 3
Viking 3/Prairie
Viking 5
Viking Estare
Viking Estates
Viking Estates Subdivision
Viking Prairie
Viking Tr 15
Viking Tr 6
Viking/Prairie
Viking/Prarie
Vikings
Vikings Estates
Vikings Landing Phase Ii
Vikings Lookout
Vikings Prairie
Vila Mara Condo
Vilabella Central Park Condo
Vilamur Condo
Vilazul Seaside
Vilg Homes Country Walk C
Vill At Manchester Farms
Villa 17 Condominium
Villa 56 Condo
Villa Alhambra Condo
Villa Athenas
Villa Bari Condo
Villa Bay Vista Condo
Villa Bekasi En Venta
Villa Bellini Condo
Villa Bello
Villa Belmont
Villa Biarritz Condo
Villa Biscaya Jardines Co
Villa Borghese
Villa Brickell Condo
Villa Calabria Condo
Villa Caleta, La Romana
Villa Caleton
Villa Capri Condo
Villa Carrara Condo
Villa Castille Condo
Villa Catalina Condo
Villa Cayuco
Villa Cortese
Villa Costa Condo
Villa Cresta
Villa D Este
Villa D Este At Pga National
Villa D'Este
Villa Del Rio
Villa Del Sol
Villa Del Sol Condo
Villa Del Sol Condominium
Villa Deste Condo
Villa Di Mare Condo
Villa Domani
Villa Dorada
Villa Dorada Condo No 1
Villa Dorada Condo No 2
Villa Dorada Condo No 5
Villa Doral Condo No 1
Villa Doral Condo No 2
Villa Doral Condo No 3
Villa Doral Condo No 4
Villa Estates
Villa Flora At Boca Pointe
Villa Flora At Williams
Villa Flora Condo
Villa Florini Condo
Villa Grande Condo
Villa Homes At Moors Pb 12
Villa Homes At The Moors
Villa L' Onz
Villa L'Onz
Villa La Cinq
Villa Lago
Villa Lofts Condo
Villa Loring
Villa Lucca Condo
Villa Lucca South Condo
Villa Madrid I Condo
Villa Magna Condo
Villa Majagua
Villa Mare
Villa Mare Condo
Villa Marine
Villa Marquis Condo
Villa Medici
Villa Medici Condo
Villa Miami
Villa Monterrey
Villa Noceti Tuscany Italy
Villa Nova
Villa Nova Condo
Villa Palma 107
Villa Palms Condo
Villa Park
Villa Portofino
Villa Providenza
Villa Regina Condo
Villa Residences Em Hills
Villa Residences Of Emera
Villa Rica
Villa Ridge Condominium
Villa Ridge Sec 3 Codm
Villa Rio Condo
Villa Rosa
Villa Royal Condo
Villa Royale
Villa Rustica
Villa Rustica I Condo
Villa San Remo
Villa San Remo Boca Azul Ph 2
Villa San Remo Condo
Villa San Remo Neighborhood 'F.'
Villa Serein Of Ibis Isle Condo
Villa Sevilla
Villa Sonrisa Condo
Villa Sorrento Pb 133 Pgs
Villa Stel
Villa Tara
Villa Terrace U-8 Of Homosassa
Villa Valencia Condo
Villa Venezia Condo Ph V
Villa Venezia Condo Ph Vi
Villa Veranda Condo
Villa Verde
Villa Vizcaya Condo
Village
Village 7 Pb 53 Pgs 4/18
Village At Abacoa Condo
Village At Blue Lake
Village At Blue Lake Condo
Village At Boca Rio Ph 1
Village At Boca Rio Ph-2
Village At Bright Oaks
Village At Camelback
Village At Canterbury
Village At Creamer
Village At Dadeland Condo
Village At Dorches
Village At Gum Springs
Village At Harbor Beach
Village At Harbor Beach C
Village At Harbor Beach Co
Village At Harbor Beach Condo
Village At Hardings
Village At Harmony Lake
Village At Hawks Cay
Village At Lake Pine
Village At Lorton Valley
Village At Manassas Park
Village At Mount Gilead
Village At North Ridge
Village At Parkers M
Village At Penn State - Homecoming Ridge I
Village At Sailboat Bend
Village At Sherando
Village At Springbrook Farms
Village At Summer Cr
Village At Swinton Square Condo
Village At The Falls
Village At The Falls Cond
Village At The Falls Condo
Village At Town Center
Village At Tuscan Ridge
Village At Valor Crossing
Village At Whiskey M
Village At Woodstream
Village Atfoxwood Acondo
Village Beach Residences
Village Brook
Village By The Bay Condo
Village By The Sea Condo
Village Case
Village Commons
Village Condo
Village Court
Village Crest At Taylor Village
Village Down River
Village East
Village East Condo
Village Garden Condo Apts
Village Gate
Village Grande
Village Grande at English Mill
Village Grande at Little Mill
Village Green
Village Green 4 Condo
Village Green Avon Condo
Village Green Buckingham Cond
Village Green Dorchester Condo
Village Green Hampton Con
Village Green Hampton Condo
Village Green Ii Sussex Bldg
Village Green Kensington Cond Decl Filed 10-17-79
Village Green Kensington Condo
Village Green Of Boca Raton Condo
Village Green Sussex Cond Decl Filed 2-6-80
Village Green Sussex Condo
Village Green Windsor
Village Green Windsor Con
Village Green Windsor Condo
Village Greene
Village Greenes
Village Greens
Village Grove
Village Harbour - The Coves
Village Homes & Condos At
Village Ii
Village Lake Condo
Village Mill
Village Oaks
Village Oaks Condo
Village Of Bayberry
Village Of Becks Pond
Village Of Bynum Run
Village Of Bynum Run Estates
Village Of Campbelltown
Village Of Chesapeake Harbour
Village Of Chewsland
Village Of Cinderberry
Village Of Clarys Forest
Village Of Cloppers Mill
Village Of Cool Branch
Village Of Cross Keys
Village Of Dorsey Search
Village Of Eastridge
Village Of Fox Meadow
Village Of Fox Run
Village Of Golf
Village Of Green
Village Of Green Tre
Village Of Harpers Choice
Village Of Hickory Hollow
Village Of Hickory Ridge
Village Of Idlewild
Village Of Indiantown
Village Of Kings Contrivance
Village Of Kings Creek Co
Village Of Kings Creek Condo
Village Of Lake Pine
Village Of Lake Pine Ii
Village Of Lakecro
Village Of Lawrenc
Village Of Little M
Village Of Long Reach
Village Of Meadow Creek
Village Of Medford
Village Of Mill Run
Village Of Montgomery Run
Village Of Morattico
Village Of Moreland
Village Of North Palm Beach
Village Of Notting
Village Of Oak Grove
Village Of Oakland Mills
Village Of Olde Mill
Village Of Owen Brown
Village Of Painters Mill
Village Of Pawnee
Village Of Quail Ridge
Village Of Red L C
Village Of River Hill
Village Of Rose Tr
Village Of Sandalwood Lak
Village Of Sandalwood Lake
Village Of Sandalwood Lakes 1
Village Of Sandalwood Lakes 2
Village Of Sandalwood Lakes 3
Village Of Sandalwood Lakes North
Village Of Sandalwood Lakes North Repl
Village Of Sandalwood Lakes South
Village Of Shannon
Village Of Stoneybrook
Village Of Tall Oaks
Village Of Thomas Run
Village Of Trewellyn
Village Of Turnberry
Village Of Turnberry Ph Ii
Village Of Union Deposit
Village Of Waxpool
Village Of Westove
Village Of Westover
Village Of Wilde Lake
Village On The Lake Condo
Village Palm Subdivision
Village Park
Village Park At Deerfield Beach
Village Park At Oakland
Village Park At Oakland C
Village Park At Oakland Condo
Village Place At Gainesville
Village Royale Condo
Village Royale Condo 1
Village Royale Condo 2
Village Royale Condo 4
Village Royale Condo 7
Village Royale Condo 8
Village Royale Emerald Green
Village Royale Emerald Green Condo
Village Royale Forest Gree
Village Royale Forest Green Condo
Village Royale Greendale Condo
Village Royale Greenhill Condo
Village Royale Greentree Condo
Village Royale Greenway Condo
Village Royale Greenwood
Village Royale Greenwood Condo
Village Royale On The Gre
Village Royale On The Green Condo
Village Royale On The Green Condo / Greenhaven
Village Royale On The Green Condo Complex
Village Royale On The Greenview
Village Sandalwood Lakes South
Village Scene Tr P
Village Shires
Village Spires Development Site
Village Square
Village Square Commons
Village Square Condo
Village Square Condos
Village Stuart Condo
Village Toms River
Village Townhouse-Pompano Beach
Village Townhouses
Village Townhouses Jacara
Village Townhouses Jacaran
Village Townhouses-Jacara
Village Townhouses-Jacaranda
Village Towns
Village Walk
Village Walk Condo
Village Walk Ii
Villageatwildquail
Villagebrook Tr Pk
Villageofvalleyglen
Villager Townhomes
Villages At Aberdeen
Villages At Aura
Villages At Berkley
Villages At Bristol
Villages At Broadlands Condo
Villages At Country Creek
Villages At Courthouse Square
Villages At Crosskeys
Villages At Falls Church
Villages At Greenfield
Villages At Harmony Ph 1c-
Villages At Hays Mill Creek
Villages At Herring Creek
Villages At Hillview
Villages At Leonardtown
Villages At Locust Grove
Villages At Millwood
Villages At Pepper Mill
Villages At Red Mill Pond
Villages At Rivers
Villages At Round Hill
Villages At Saybrooke
Villages At Spring Hill
Villages At Woodholme
Villages Of Berkley Square
Villages Of Bloomingdale Condominium 1
Villages Of Dorchester
Villages Of Elk Neck Woodholme
Villages Of Five Points-West
Villages Of Hillsboro
Villages Of Hillsboro Sec
Villages Of Hillsboro Sec 1
Villages Of Homeland
Villages Of Mantua
Villages Of Maple Dale
Villages Of Marlborough
Villages Of Mount Vernon
Villages Of Oriole
Villages Of Oriole International Club
Villages Of Oriole Abbey
Villages Of Oriole Abbey Condo
Villages Of Oriole At Deauville
Villages Of Oriole Bonair
Villages Of Oriole Bonaire
Villages Of Oriole Deauville Condo
Villages Of Piedmont
Villages Of Piedmont Ii
Villages Of Potomac
Villages Of Renaissance
Villages Of Salem Station
Villages Of Savannah
Villages Of Urbana
Villages Of West Lake Unit No. 67
Villages Of White Marsh
Villages Of Windsor
Villages Of Windsor 2
Villages Of Winterset
Villages Of Wisp
Villages Of Woodlake 1
Villages Oriole Abbey Condo
Villages/Southern Oaks Un
Villagesatdelawarrun
Villagesatwashingtsq
Villagewalk Of Wellington
Villagewalk Of Wellington 1
Villagewalk Of Wellington 3
Villagewalk Of Wellington 3b
Villagewalk Of Wellington 4
Villaggio
Villaggio Di Las Olas Condo
Villaggio Enclave
Villaggio In The Grove
Villaggio In The Grove To
Villaggio Isles Parcel A-1 Repl
Villaggio Isles Parcels
Villaggio Reserve
Villagio At Palmetto Bay
Villagio Del Mar
Villamar
Villamar At Toscana Isles
Villamar At Toscana Isles Pud Pl 2
Villamar Phase 1
Villamay
Villanova
Villaridge
Villas
Villas 1 Condo
Villas At Bay Crossing
Villas At Bent Creek
Villas At Bonaventure
Villas At Bonaventure In Tr 37 N
Villas At Bonaventure In Tr 37 S
Villas At Bristol Park Co
Villas At Carmel
Villas At Carmel Condo
Villas At Carmel Condo No
Villas At Carmel Condo No 4
Villas At Carmel Condo No1
Villas At Carriage Hills
Villas At Circle's Edge
Villas At Circles Edge Co
Villas At Coral Springs
Villas At Countryside
Villas At Cutler Bay Cond
Villas At Cutler Ridge
Villas At Emerald Dunes C
Villas At Emerald Dunes Condo
Villas At Five Ponds
Villas At Harbor Isles
Villas At Harbor Isles Co
Villas At Harbor Isles Condo
Villas At Kings Landing
Villas At Lakeview
Villas At Lakeview Condo
Villas At Lakeview, Fourt
Villas At Lucerne Lakes I
Villas At Mangrove Bay Condo
Villas At Nautica One Con
Villas At Nautica Three C
Villas At Nautica Two Con
Villas At Newfound Harbor, The
Villas At Secret Lake Cond
Villas At Sunset Trace At Martin Downs (Aka Martin
Villas At The Hammocks Co
Villas At Trexler Pk
Villas At Walden
Villas At Woodland Greens
Villas At Woodmont Tr 73
Villas At Woodmont Tr 73 Condo
Villas By The Sea 1 Condo
Villas By The Sea 2 Condo
Villas By The Sea 3 Condo
Villas By The Sea 4 Condo
Villas De Asturias Condo
Villas De Marbella Condo
Villas De San Diego
Villas De Tuscany Condo
Villas De Tuscany Condo B
Villas De Venezia Condo
Villas Del Alhambra Condo
Villas Del Campo Sub
Villas Del Mar Unit 2
Villas Lake Anita Louise
Villas Of Amberwood Condo
Villas Of Bethany West
Villas Of Boca Delray Con
Villas Of Boca Delray Condo
Villas Of Bonaventure
Villas Of Bonaventure At
Villas Of Burwick
Villas Of Deerwood Phase
Villas Of Deerwood Replat
Villas Of Golf View Harbou
Villas Of Golf View Harbour Condo
Villas Of Green Glen Ii
Villas Of Green Glen Ii-B
Villas Of Hobe Sound Condo
Villas Of Maxatawny
Villas Of Miami Lakes Con
Villas Of Ocean Dunes
Villas Of Ocean Dunes 4
Villas Of Palm Bay
Villas Of Palomino Condo
Villas Of Pinecrest Condo
Villas Of Plantation
Villas Of Positano Condo
Villas Of Riverside Condo
Villas Of Sandpiper Bay
Villas Of Sandpiper Bay Unit 2
Villas Of Sheridan Condo
Villas Of Sunrise Bay Condo
Villas Of West Bird Condo
Villas Of West Miami Cond
Villas Of Westridge Ph 5a
Villas Of Willow Bend
Villas Of Windmill Point I
Villas On Broad Creek
Villas On Waters Edge
Villas San Diego
Villas San Miguel Condo
Villas Thurston
Villas University Square
Villas Willow Cove Codm
Villas/Lower
Villatel Village
Ville De Capri / Polo Club
Ville De Capri / Polo Club
Villlage Of North Palm Beach Unincorporated
Vilnis Condo
Vilone Village
Vincent Estates
Vincent Overlook
Vincentown Village
Vine Gardens Condo
Vineland
Vineland City
Vineland City
Vinewood
Vineyard Farms
Vineyards
Vineyards At Nassau Valley
Vineyards Of Plantation C
Vineyards Of Plantation Condo
Vinik No 2
Vinleand
Vint Hill
Vintage Estates
Vintage Farm
Vintage Lighthouse Point
Vintage Oaks
Vintage Oaks Estates
Vintage Redland
Violet Hill
Violetville
Virgina Beach
Virginia Beach Resort
Virginia Center
Virginia Commons
Virginia Forest
Virginia Heritage At Lee's Park
Virginia Hills
Virginia Kaye
Virginia Knolls
Virginia Oaks
Virginia Park
Virginia Run
Virginia Run The Estates
Virginia St Co-Op
Virginia Terr
Virginia Village
Virginian Apartments
Visconti Condo
Viscose
Viscose Village
Vision 1 As In Pb 35 Pgs 60 And 61
Vision One
Visions At Fountainbleau
Visions Condominium
Vista Alegre Condo
Vista Alegre Townhomes Co
Vista Alegre Townhomes Vi
Vista Alta
Vista Cana
Vista Del Lago
Vista Del Lago Condo
Vista Del Lago Condo V
Vista Del Lago Condo Vii
Vista Del Mar
Vista Del Mar Condo Bldgs A-I
Vista Estates
Vista Gardens
Vista Gardens F/K/A Vista Royale Gardens
Vista Gardens I Condo
Vista Gardens Plat 1>
Vista Harbor
Vista Harbor Condo Bldgs M-T
Vista Lago
Vista Lago At The Hammock
Vista Lake Condo
Vista Lakes Village N-3
Vista Oaks West
Vista On The Bay Condo
Vista Pines
Vista Pines Condo
Vista Plantation Phase I & Ii
Vista Ridge
Vista Royal
Vista Royale Phase Il Bldgs 83-111
Vista Royale Phase Iv Bldgs 83-111
Vista Salerno Revised
Vista St Lucie
Vista St Lucie Buildings 9 Thru 20
Vista St. Lucie
Vista Sub 1st Addn Amende
Vista Townhouse Sec A
Vista Trace
Vista Trace 1 Condo
Vista Trace 2 Condo
Vista Trace 4 Condo
Vista Trace 7 Condo
Vista Trace 8 Condo
Vista Trace Condo
Vista Verde Clusters Unit
Vista Verde Sec 1
Vista Verde Townhouse Sec
Vista Verde Twnhs Sec E
Vista Verdetownhouse Sec B
Vista Woods
Vistablue Singer Island Condo
Vistanna Villas
Vistas
Vistas At Bowie
Vistas At Bowie New Town
Vistas At Bowie Town Ctr
Vistas At Green Hill
Vistas At Lake Arbor
Vistas At Lansdowne
Vistas At Laurel Lakes
Vistas At Milestone
Vistas Of Boca Lago Condo
Vistas Of Vienna Condominiums
Vistazo At Boca Raton
Vita At Grove Isle
Vita At Grove Isle A Condo
Vita At Grove Isle Condo
Vita Grove Isle
Vitalia
Vitalia At Tradition
Vitalia In Tradition
Vitran At Naranja Estates
Vitran Homes At Morningsi
Vittoria Gardens
Vivant
Vive Rio Barranquilla
Vivero I Casa De Campo
Vivero I 54, Casa De Campo, Dominican Republic
Viveroy Brickell
Vizcaya 1
Vizcaya 2
Vizcaya 3
Vizcaya 4
Vizcaya At The Hammocks R
Vizcaya Falls
Vizcaya Falls Plat 1
Vizcaya Falls Plat 2
Vizcaya Falls Plat 3
Vizcaya Gardens
Vizcaya Gardens At Palm-Aire
Vizcaya Gardens Condomini
Vizcaya Lakes
Vizcaya Lakes Condo
Vizcaya Palm Aire
Vizcaya Towers At Palm-Aire
Vizcayne North Condo
Vizcayne South Condo
Vk1042 Viking Estates
Vk1043 The Viking Estates
Vk1074 The Viking Estates
Vk11 The Viking Estates
Vk1223 Listing Agreement
Vk1298 The Viking Estates
Vk1314 The Viking Estates
Vk1315 The Viking Estates
Vk16 The Viking Estates
Vk18 The Viking Estates
Vk19 The Viking Estates
Vk2003 The Viking Estates
Vk2047 The Viking Estates
Vk2050 Viking Estates
Vk2051 The Viking Estates
Vk2052 The Viking Estates
Vk2053 The Viking Estates
Vk2058 The Viking Estates
Vk2059 The Viking Estates
Vk22 The Viking Estates
Vk2203 The Viking Estates
Vk236 The Viking Estates
Vk240 The Viking Estates
Vk243 The Viking Estates
Vk245 The Viking Estates
Vk248 Viking Estates
Vk250 The Viking Estates
Vk253 The Viking Estates
Vk256 Viking Estates
Vk261 Viking Estates
Vk263 Viking Estates
Vk265 Viking Estates
Vk270 Viking Estates
Vk287 The Viking Estates
Vk288 The Viking Estates
Vk29 The Viking Estates
Vk2910 The Viking Estates
Vk292 Viking Estates
Vk2939 Viking Estates
Vk2959 The Viking Estates
Vk296 Viking Estates
Vk297 Viking Estates
Vk298 The Viking Estates
Vk299 Viking Estates
Vk3 Viking Estates
Vk3066 The Viking Estates
Vk3069 The Viking Estates
Vk3069 Viking Estates
Vk3071 Viking Estates
Vk3072 The Viking Estates
Vk3077 The Viking Estates
Vk316 Viking Estates
Vk32 The Viking Estates
Vk321 Viking Estates
Vk359 The Viking Estates
Vk362 The Viking Estates
Vk367 The Viking Estates
Vk38 Viking Estates
Vk4 The Viking Estates
Vk42 The Viking Estates
Vk43 The Viking Estates
Vk433 The Viking Estates
Vk447 The Viking Estates
Vk457 The Viking Estates
Vk461 Viking Estates
Vk465 The Viking Estates
Vk467 The Viking Estates
Vk470 The Viking Estates
Vk471the Viking Estates
Vk5 The Viking Estates
Vk501 The Viking Estates
Vk518 The Viking Estates
Vk735 Viking Estates
Vk736 Viking Estates
Vk762 The Viking Estates
Vk763 The Viking Estates
Vk796 The Viking Estates
Vk87 Viking Estates
Vk929 Viking Estates
Vlg Grande At Bear
Voken Tract
Voshell Cove
Voss Oak Lake Estates
Voyager
Voyager Condo
Vue At Brickell Condo
Vue Condo
Vue Condominium
Vue Residences & Beach C
Vulcan Materials Company
Vulcan Materials Company Plat
W 1/2 Of Se 1/4 Of Sw 1/4 Of Ne 1/4 Of Sw 1/4
W 612.33 Ft Of N 355.75 Ft
W A Daniel Sub
W Atlantic City
W D Hornes Sub
W Flagler Pk
W Fort Lauderdale
W Fort Lauderdale Residenc
W Fort Lauderdale Residences Hotel
W Ft Lauderdale Residence
W Hazleton
W Little River Annex
W Little River Rev
W Miami Shores Sec B
W Pompano Beach
W Residences Abu Dhabi
W T Hardees Sub
W W Spilman Division
W. Cornwall Township
W. Ocean City
Wabash Landing
Waddells
Wade's Grant
Wadsworth
Wagamons West Shores
Waggaman Heights
Wagner Subdivision
Wagner's Farm
Wagners Farms
Wagon Wheel Estates
Waite Sub
Waiting Rock
Wakefield
Wakefield Addition
Wakefield Chapel Estates
Wakefield Chapel Woods
Wakefield Forest
Wakefield Valley
Wakeland Manor
Walbrook
Walbrooke Manor
Walden
Walden Chase
Walden Glen
Walden Place
Walden Pond At Woodmont
Walden Townhomes
Walden Woods
Walden Woods Condominium Phase I
Waldin Acres
Waldin Park Estates
Waldin Terrace
Waldman Plat
Waldman Plat Mirabella
Waldo
Waldon Woods
Waldorf
Waldorf Astoria Miami
Waldorf Astoria Miami Res
Waldorf Astoria Res Miami
Waldorf Astoria Residences
Wales Of Harford
Walfield
Walk In The Water Village Unit 03
Walker Mcc Bond
Walker Mill
Walker Square
Walkers Branch Estates
Walkers Choice
Walkers Mill Tr Pk
Walkers Ridge
Walkers Sub
Wallace Stevens
Wallenpaupack Lake Estates
Wallian Co-Op Apts Inc
Wallingford Way
Wallville
Walmar Manor
Walney Village
Walnick Manor
Walnut Bank Farms
Walnut Creek
Walnut Creek Replat No 1
Walnut Creek Townhomes
Walnut Estates
Walnut Gardens Condo
Walnut Grove
Walnut Grove Estates
Walnut Grove Mobile Home Park
Walnut Heights
Walnut Hill
Walnut Hill Estates
Walnut Hills
Walnut Knoll
Walnut Lake
Walnut Meadows
Walnut Point Heights
Walnut Ridge
Walnut Ridge Estat
Walnut Ridge Ests
Walsh Addition
Walter Heights
Walters Woods
Waltham Condo
Waltham Woods
Walther
Waltherson
Walton Park
Waltons Landing
Wanee Lakes Subdivision
Wankoma Village
Waples Mobile Home Park
Waples Pond Acres
Wapleton Condominium
Ward #2
Ward 1
Ward 10
Ward 27
Ward 28
Ward 4
Warden Glen Subdivision
Wardens
Wardour
Wards Meadow
Ware Neck
Waretown
Waretown - Barnegat Beach
Waretown - Bay Haven
Waretown - Dogtown
Waretown - Grand Bay Harbor
Waretown - Greenbriar Oceanaire
Waretown - Holiday Harbor
Waretown - Laurelwyck
Waretown - Pebble Beach
Warfield
Warfield Condominiums
Waring Station
Warm Mineral Springs Unit
Warm Spring Estates
Warm Spring Ridge
Warminster Hgts
Warner
Warner Meadows
Warners
Warren
Warren County
Warren E Carson Est
Warren Lodge
Warren Park Ests
Warren Village
Warren Way
Warrens Park
Warrenton Chase
Warrenton Gardens
Warrenton House Condo
Warrenton Lakes
Warrington Hunt
Warrington Mews
Warrington Resub
Warrlinda Village
Warsaw
Warther
Warwick
Warwick Condos
Warwick Crossing
Warwick Gardens
Warwick Greene
Warwick Hills
Warwick Landing
Warwick Park
Warwick Village
Washburns 2nd Addn
Washburns Sub
Washington
Washington Heights Sub
Washington Center Condo
Washington County
Washington Court Villas
Washington Crossing
Washington Dc
Washington Forest
Washington Grove
Washington Heights
Washington Heights Add
Washington Heights Subdivision
Washington Hgts
Washington Highlands
Washington Hill
Washington House
Washington Mill Loft
Washington Oaks
Washington Overlook
Washington Palms
Washington Palms Condo
Washington Park
Washington Park (Salerno)
Washington Park 5th Add
Washington Park Addition
Washington Park Condo
Washington Park First Add
Washington Park Fourth Ad
Washington Park Fourth Add
Washington Park Hallandale Add
Washington Park Second Ad
Washington Park Second Add
Washington Park Third Add
Washington Place
Washington Sq
Washington Sq West
Washington Square
Washington Square Condo
Washington Suburban Home
Washington Trail
Washington Twn Ctr
Washington Twp
Washington Village
Washington Woods
Washingtonian Center
Washingtonian Village
Wassergarten Wendenschloss
Watchung-Putnam
Water Bridge
Water Bridge 1 Condo
Water Bridge 2 Condo
Water Bridge 5 Condo
Water Bridge 6 Condo
Water Bridge West Condo
Water Cana
Water Club
Water Club 3 North Palm B
Water Club 3 North Palm Beach Condo
Water Club North Palm Beach Condo
Water Club Towns
Water Edge Estates
Water Glades
Water Glades Condo
Water Oak Point
Water Pointe
Water Ridge
Water Street Condominiums
Water's Edge
Water's Edge At Deerfield
Water's Edge At Deerfield Beach
Water's Landing
Waterbend At Jonathans Landing
Waterbend At Jonathans Landing Condo
Waterberry Sec 04
Waterbury Condo
Watercrest
Watercrest At Parkland
Watercrest-42 Acres
Waterfall Village
Waterford
Waterford Courtyards
Waterford Courtyards Addi
Waterford Courtyards Addition
Waterford Cove
Waterford Creek
Waterford Estates
Waterford Green
Waterford Heights
Waterford Lakes Phase I Subdivision
Waterford Landing
Waterford Meadows
Waterford Point Condo
Waterfords Edge
Waterfront
Waterfront 25min Ocean
Waterfront Bay Indian Rive
Waterfront Bay Ocean River
Waterfront Greens
Waterfront On The Ocean At Juno Beach Co
Waterfront Square
Waterfront Sw Rla
Watergarden Condo
Watergate
Watergate At Landmark
Watergate Condominium No
Watergate Condominium No 1
Watergate Condominium No 2
Watergate Condominium No 4
Watergate Condominium No 6
Watergate Mobile Home
Watergate North
Waterloo Court
Waterloo North
Waterloo South
Waterman Park
Waterman's Bluff
Watermans Court
Watermans Estates
Watermark
Watermark At Westphalia Town Center
Watermark Iii Condo
Watermen Homes 1st Addn
Waters Edge
Waters Edge At Deerfield
Waters Edge At Deerfield Condo
Waters Edge At North Lake
Waters Edge At Peppertree
Waters Edge At Wisp
Waters Edge At Woods Landing
Waters Edge Condo
Waters Edge Of Coral Gabl
Waters Edge Of Coral Spri
Waters Edge Of Coral Springs
Waters Edge Towers Condo
Waters House
Waters Landing
Watersedge
Watersedge At The Lakes Of Delray
Watersedge At The Lakes Of Delray Condo
Watersedge At The Lakes Of Delray Condo A Thru H
Waterset Ph 3a-3 & Covingt
Watershed
Watershed Park
Waterside
Waterside / Bramalea Unicorp Boca Raton
Waterside At Boca Trail
Waterside At Wisp
Waterside Estates
Waterside Luxury Townhome
Waterside Luxury Townhomes Condo
Waterside On The Intracoa
Waterside On The Intracoastal
Waterside Reserve
Waterside Towers Condo
Waterside Townhomes Sec 1
Waterside Townhomes Sec 4
Waterside Village
Waterside Village Of Palm
Waterside Village Of Palm Beach Condo
Waterside Village Pud
Waterside Village Three C
Waterside Village Three Condo
Waterside Village Two Con
Waterside Villas
Watersong Pud One
Watersong Pud Plat No One
Watersong South Pud One
Waterstone
Waterstone Phase Five
Waterstone Phase Four
Waterstone Phase Iii
Waterstone Phase One
Waterstone Phase Three
Waterstone Phase Two
Waterstone Villas
Waterview
Waterview Apts Condo
Waterview At Woodland Park
Waterview Condo
Waterview Estates
Waterview Isles
Waterview Lodge Co-Op
Waterview Lodge No 2 Co-Op
Waterview Towers Condo
Waterville
Waterway @ Hollywood Beac
Waterway @ Hollywood Beach Condo
Waterway Beach Condos
Waterway Club
Waterway Club No 1, 2 & 8 Cond As In Dec
Waterway Colony
Waterway Condo
Waterway East Condos
Waterway Estates Golf Park
Waterway Isles Condo
Waterway Lane
Waterway North Condo
Waterway Plaza Condo
Waterway West Condos
Waterway/Lk Okeechobee
Waterways
Waterways At Delray Ph 2, Ph 3
Waterways At Delray Ph 4
Waterways Marina Condo
Waterways Taheri Pud
Waterwood Patio Homes Phase Ii
Waterworks
Watkins Meadows
Watkins Mill
Watkins Mill Station
Watkins Mill Town Center
Watkins Place
Watson Court
Watsons Glen
Watt
Wauer Property Division
Waugh
Wave Condo
Wave Condominimum
Waveland Sub
Waverly
Waverly At Las Olas
Waverly At Las Olas Condo
Waverly At Northampton
Waverly Condominiums
Waverly Crossing
Waverly Grove
Waverly Growers Dev. Pb 39 Pgs 7-13
Waverly Hills
Waverly Hundred
Waverly Place
Waverly Place 2-19 D
Waverly Place Amended Pla
Waverly Taylor
Waverly Village
Waverly Woods
Waverly Woods West
Wawaset
Wawaset Heights
Wawaset Park
Way Side Sub
Waycroft - Woodlawn
Wayland Manor
Waylands
Wayne Gardens
Wayne Heights
Waynesboro
Waynesboro Borough
Waynesboro Heights
Waynesbrooke East
Waynewood
Waynewoods
Wayside Park
Wayside Village
Waysons Woods Manufactured Home Community
Wea-Villa
Weant
Wear H M And D F Subdivision
Weather Vane Farms
Weatherby
Weatherby Meadows
Weatherhill Farms
Weatherly
Weatherly Borough
Weatherstone
Weatherstonecrossing
Weavers Knoll
Webb Manor
Webber Springs
Webbs 1st Add To Calla
Weber Heights
Weber Park
Webers Crossing
Webster And Omohundro Subdivision
Webster Terr
Webster Village
Wedgefield
Wedgewood
Wedgewood Condominium
Wedgewood Estates
Wedgewood Forest
Wedgewood Greene
Wedgewood Greens
Wedgewood Hills
Weeki Wachee Woodlands
Weeks D P Resubdivision Pb
Weems
Weidlein Division
Weidlings Sub
Weildlings Subdivision
Weir Farm
Weismans
Weitzer Aventura Place Co
Weitzer Country Homes
Weitzer Hammocks Homes Se
Weitzer Lago Mar Homes
Weitzer Serena Lakes Esta
Weitzer Serena Lakes Town
Weitzer Serena Lakes West
Weitzer Shauna Meadows Se
Weitzer Sub
Weitzer Sub 1
Weitzer Sub 2
Weitzer Sub 3
Weitzer Sub Pl 3
Weitzer Sub Pl1
Welbon
Welbrook
Welches Pond
Weldon
Weldon Condominium
Weldon Condominium G
Weldon Condominium K
Welleby Nw Quadrant
Welleby S W Quadrant
Welleby Shores Condominiu
Welleby Townhome 1 Condo
Welleby Unit 2
Welleby Unit 8
Welleby Unit Eight
Welleby Unit Four
Welleby Unit Six
Welleby Unit Thirteen
Weller's Corner
Wellersburg
Wellesley At Boynton Beac
Wellesley At Boynton Beach
Wellesley At Hidden Meadows
Wellesley At Lake Clarke
Wellesley At Lake Clarke Shores
Wellesley Hills
Wellesley Manor
Wellesley Park Condo
Wellham Heights
Wellington
Wellington Aero Club Of T
Wellington Aero Club Of The Landings At Wellington
Wellington Arms Condos
Wellington At Bayside Lake
Wellington Chase On The Rappahannock
Wellington Condo
Wellington Condominium
Wellington Condos
Wellington Court
Wellington Downs
Wellington Estates
Wellington Ests
Wellington Greens
Wellington Hills
Wellington Manor
Wellington Of Wellington
Wellington Parc
Wellington Towers Condo
Wellington Tr 42b
Wellington Tr 43
Wellington Trace
Wellington Valley
Wellington View
Wellington Woods
Wellington Woods Ii
Wellington/Cloverhill
Wellingtons Edge Par 76 Ph 1
Wellingtons Edge Par 76 Ph 2a
Wellingtons Edge Par 77 Ph 1
Wellingtons Edge Par 78 P
Welllington Beach
Wellness Ridge
Wells Twp
Wellspring Hills
Welltown Acres
Wellwood
Welsh Ayres
Welworth Condo
Welwyn Manor
Welwyn Park
Welwyn Park 3rd Add
Wendover
Wendover Commons
Wendover Condo
Wendover Square
Wentworth Estates
Wentworth Green
Wentworth Place
Wes Mountain
Wesley Chapel Woods
Wesley Heights
Wesley Woods
Wesmond
Wessynton
West Acres
West Annapolis
West Arlington
West Ave Condo
West Baltimore
West Bay At Jonathans Landing Condo
West Bay Gardens Condo
West Bay Park
West Bay Plaza Condo
West Biscayne
West Boynton 02b
West Boynton 1
West Boynton 2a
West Branch
West Breeze Estates
West Brunswick
West Buena Vista
West Carver Ranches Add N
West Carver Ranches Add No 1
West Cherry Grove
West Chester
West Chester Boro
West Chevy Chase Heights
West Cocalico Twp
West Creek
West Creek Village
West Dade Land Sub
West Dania Heights
West Deen Point
West Deerfield Beach
West Donegal
West Donegal Twp
West Dover
West End
West End Condos
West End Historic District
West End Lancaster
West End Park
West End Park Amd Pl
West End Roatan Island Hn
West End Terrace
West End Townhomes North
West Esplanade
West Fairfax
West Fairmount
West Falls
West Falls Church
West Fields
West Flagler Center
West Flagler Center Le Je
West Flagler Heritage Condo No 1
West Flagler Heritage No
West Flagler Pk
West Flagler Pk Sec B
West Fontaine Condo
West Forest Park
West Friendship
West Garden Sub
West Garden Sub 1st Addn
West Gardens Village Cond
West Gate Estates Northern
West Gate Of Lomond
West Glen
West Grass Ridge
West Grove
West Halethorpe
West Hanover Township
West Harlem
West Harlem 21-26 B
West Hempfield
West Hempfield Twp
West Hialeah
West Hialeah Heights
West Hialeah Heights Amd
West Hialeah Hgts
West Hills
West Hollywood Hills
West Hyattsville
West Inverness
West Irvin Heights
West Jensen Pud Phase 1b Parcels 6.0 6.4-6.8
West Kensington
West Lake
West Lake Forest
West Lake Village
West Lake Village Plat
West Lake Villas/Spring Lake Ii
West Lakes
West Lakes Boca Raton Inc
West Lakes Gardens
West Lakes Gardens 1st Ad
West Lakes Gardens 1st Add
West Lakes Of Boca Raton
West Lakes Of Boca Raton Inc
West Lampeter Twp
West Langley
West Lanham
West Lansdowne
West Larkin Park
West Lawn
West Lebanon
West Lebanon Twp
West Lewinsville Heights
West Little River
West Lucaya Village Pb 25
West Mahanoy Twp
West Manchester
West Manchester Twp
West Manheim
West Manheim Twp
West Market
West Mc Lean
West Meadows
West Miami Part 2
West Miami Shores Sec D
West Miller Heights Sec 1
West Miller Heights Sec 2
West Miller Heights Sec 3
West Miller Heights Sec 4
West Moorland
West Moorland Amd
West Mulberry Heights
West Nithsdale
West Norfolk
West Oak Lane
West Oaks Corner
West Ocean City
West Ocean Farms
West Orange
West Ox Cluster
West Palm Beach
West Palm Beach Gardens
West Palm Gardens
West Palm Gardens Villas
West Palm Villas Iii Cond
West Park
West Park At Brambleton
West Park Village
West Park-Hotel Site
West Park-West Parcel
West Passyunk
West Penn
West Pennsboro
West Perrine
West Perrine Addn
West Perrine Homes
West Perry S/D
West Philadelphia
West Poinciana Villas Con
West Poplar
West Powelton
West Providence Township
West Rehoboth
West Ridge Hills
West Ridgewood Ranch Estat
West Riding
West River
West River Plantation
West River Sec Croissant Park
West Severna Park
West Shady Side
West Shenandoah
West Sherman
West Shores
West Shores At New Milford
West Side
West Side Heights Delray
West Spring
West Springfield
West Springfield Mews
West Sunrise Corporate Pa
West Towson
West Trail Park
West Trenton
West Twin River
West Valley Oaks
West Vienna Woods
West View
West View Estates
West View Lake Townhomes
West View Shores
West Village
West Village Of Shirlington
West Vincent
West White Plains
West Wildwood
West Wind
West Wind Condo
West Winds Homes
West Windsor Ests
West Wynd
West Wynn
West York
West York Boro
Westbard Square
Westbay
Westbird Village Condo
Westbriar
Westbriar Condominiums
Westbriar Country Club Estates
Westbriar Plaza
Westbrook
Westbrook Condo Apts
Westbrook Condo Apts Inc
Westbrook Isles Condominium
Westbrook Park
Westbrooke
Westbrooke Gardens 1st Ad
Westbrooke Hills
Westbrooke Ph 03
Westbrooke Twin Homes Con
Westbury
Westbury A Condo
Westbury Acres
Westbury E Condo
Westbury Glen
Westbury H Condo
Westbury Heights
Westbury J Condo
Westbury L Condo
Westbury Pub
Westchester
Westchester Arms Co-Op
Westchester At Stratford
Westchester Condos
Westchester Lakes
Westchester Luxury Condo
Westchester Manor
Westchester Park
Westchester Park Ii
Westchester Part 1
Westchester Part 3
Westchester Point Condo
Westchester Square
Westchester Townhouses
Westchester West
Westend At Armstrong Village
Westend Heights
Westend Pk Amd Pl
Westerlee Subd
Westerley
Westerly
Western
Western Acres 1st Addition
Western Gateway
Western Miami Sec B
Western Palm Bay
Western Shores
Westervelt
Westfarm
Westfield
Westfield At West Palm Be
Westfield At Wpb
Westfield Leas
Westfield Sec
Westfield Sec B Resub Por
Westfield Subdivision
Westfield Terrace
Westfields
Westfork 1 Plat
Westfork I Plat
Westgate
Westgate At Hunters Run Condo
Westgate Farms
Westgate Hills
Westgate Lake Manors
Westgate Residence Condo
Westhampton
Westhampton Mews
Westhampton Townhouses P
Westhaven
Westhaven Condo
Westhaven Heights 1st Add
Westhaven Hgts 2nd Addn
Westhaven Hgts 4th Addn
Westhaven Hgts 6th Addn
Westhill
Westhover
Westinghouse Vlg
Westlake
Westlake Park
Westlake Plat 2
Westlake Towers
Westlake Village
Westlake Village Plat
Westland Condo
Westland Courts Condo
Westland Gardens
Westland Gardens Condo
Westland Manor Condo
Westland Manors East Cond
Westland Plaza Gardens Co
Westland South Condo
Westland Village Condo Ii
Westlandia Condo Ph I
Westlawn Corr Plat
Westlee
Westleigh
Westlu Meadows
Westmaren
Westmaren Condo
Westmarket
Westminister Heights
Westminster Election District
Westminster Square
Westmont
Westmoor
Westmoore At Moorefield
Westmore
Westmore Land 2nd Add
Westmoreland
Westmoreland Fruit Farm
Westmoreland Hills
Westmoreland Park
Westmoreland Shores
Westmoreland Square
Westmoreland Terrace
Westmount
Weston 55 Plus Condo
Weston Estates
Weston Estates. Botaniko
Weston Hills
Weston Hills Cc- Poinciana
Weston Hills Country Club
Weston Hills/Hunters Point
Weston Village
Westover
Westover Crossing
Westover Fostoria
Westover Hills
Westover Woods
Westowne
Westowne Village
Westphalia
Westphalia Overlook
Westphalia Row
Westphalia Town Center
Westphalia Woods
Westport
Westport 1st Section
Westport 2nd Section
Westridge
Westridge At Westphalia
Westridge Condominium
Westridge Estates
Westridge Hills
Westridge Ii East
Westridge Pk
Westridge Shores
Westshire
Westside
Westside At Shady Grove
Westside At Shady Grove Metro
Westside Hunt
Westside Mhp
Westside Station
Westtown Chase
Westtown Reserve
Westview
Westview (15)
Westview At Ballston Metro
Westview Condominium 4
Westview Condominium No 8
Westview Condominium No E
Westview Condominium No Eight
Westview Condominium No F
Westview Condominium No Four
Westview Condominium No O
Westview Condominium No One
Westview Condominium No Seven
Westview Condominium No T
Westview Gardens Apartmen
Westview Harbor
Westview Hills
Westview Lennar
Westview Manor
Westview North
Westview Park
Westview Ridge
Westview Sec 1 Part 1
Westview Sec 2 Part 1 Ame
Westview Sec 2 Part 2
Westview Sec 3 Part 2
Westview Sec One Part Two
Westview South
Westview Square
Westview Village Addition
Westville Grove
Westvue
Westwind Gardens
Westwind Lakes Garden Hom
Westwind Lakes Sec 1
Westwind Lakes Sec 2
Westwind Lakes Sec 4
Westwind Lakes Sec 5
Westwind Lakes Sec 6
Westwinds
Westwood
Westwood Acres North
Westwood Acres South
Westwood At Cypress Run
Westwood At Cypress Run Condo
Westwood Community 3
Westwood Community 4
Westwood Community 4-A
Westwood Community 5
Westwood Community 5 78-39 B
Westwood Community 5-A
Westwood Community 6
Westwood Community 7
Westwood Commy 4 77-45 B
Westwood Court
Westwood Estates 1st Addn
Westwood Ests 3rd Addn
Westwood Ests 4th Addn
Westwood Ests Sec 2 2nd A
Westwood Gardens 1
Westwood Gardens 3
Westwood Gardens Condominium
Westwood Heights
Westwood Hills
Westwood Lake
Westwood Lake 10th Addn
Westwood Lake 1st Addn
Westwood Lake 2nd Addn
Westwood Lake 3rd Addn
Westwood Lake 4th Addn
Westwood Lake 6th Addn
Westwood Lake 9th Addn
Westwood Manor Estates
Westwood Manor Subdivision
Westwood Mews
Westwood Park
Westwood Park Dec 2
Westwood Park Sec 1
Westwood Park Sec 3
Westwood Park, Sec 4 59-3
Westwood Terrace
Westwood Village
Westwoods Of Cherry Grove
Westwyk
Wetherby
Wethersfield
Wexford
Wexford Court
Wexford Farms
Wexford Place A Condo
Wexford Village
Weyanoke
Weybridge Iii
Weybridge Townhomes
Weyburn Park
Weyhill Estates
Weymouth Woods
Whales Tail
Whaleys Crossing
Wharton
Wharton Run
Whartons Bluff
Wheatland
Wheatland Hills
Wheatland Station
Wheatley Hills
Wheatley Walk
Wheatleys Pond
Wheaton
Wheaton Hills
Wheaton Forest
Wheaton Heights
Wheaton Hills
Wheaton Out Res. (1)
Wheaton Out Res. (2)
Wheaton Outside
Wheaton Towne
Wheaton Woods
Wheatsheaf Village
Wheel Of Fortune
Wheeler Place
Wheeling Estates
Wheja Sub
Whelan Crossing
Whelan Ridge
Whetstone
Whetstone Run
Whetzel Land
Whisem Unit A
Whisem Unit B
Whiskey Bottom
Whiskey Creek Club Estates
Whiskey Run
Whiskey Run Estates
Whisper Condo
Whisper Creek
Whisper Trace
Whisper Trace Par 8 Arvid
Whisper Walk
Whisper Walk Parkshore
Whisper Walk /Parklane
Whisper Walk Condos
Whisper Walk Parklane
Whisper Walk Sec C Condo
Whisper Walk Sec E Condo
Whisper Walk Section C
Whisper Walk/Summerwinds
Whisperhill
Whispering Run
Whispering Creek
Whispering Hills
Whispering Lakes Phase 2
Whispering Meadows
Whispering Oaks
Whispering Palms 1
Whispering Palms 5
Whispering Palms Unit 5
Whispering Pine Mhp
Whispering Pines
Whispering Pines Est Sec
Whispering Pines Estates
Whispering Pines Ests Sec
Whispering Pines Heights
Whispering Pines Subd, Plat No 2
Whispering Ridge
Whispering Sound 01-04a
Whispering Sound 04a Danforth
Whispering Sound 4a Danforth
Whispering Trails 4
Whispering Valley
Whispering Wood
Whispering Woods
Whispering Woods A
WhisperingWoods
Whisperwood
Whisperwood Cluster
Whistling Pines
Whitacre
Whitaker Walk
Whitaker Woods
White Birch Farms
White Church
White City
White City Subdivision
White Cove
White Egret Condo
White Fences (A Of E)
White Fences Equestrian Estates
White Fences Equestrian Estates 1
White Fences Equestrian Estates 2
White Flint Park
White Flint Station
White Hall
White Hall Forest
White Hall Forest-Plat 7
White Hall Plat 7
White Haven
White Horse Garden
White Horse Park I
White Horse Park Ii
White Horse Park Iii
White Horse Park Ph 3
White House Beach
White House Heights
White Marlin Beach Sec 2
White Marsh
White Meadow Lake
White Neck Creek
White Oak
White Oak Country Est
White Oak Manor
White Oak Reserve
White Oak Trailer Park
White Oak Village Sub
White Oaks
White Oaks Estates
White Oaks Farm
White Oaks Park
White Pine Acres
White Plains
White River Estates
White Rock
White Rock Acres
White Sand
White Sand Harbor
White Sand Harbour
White Sands
White Sands Beach Homes I
White Springs
White Springs At Providence
White Stone
White Swan
White Tail Deer Est.
White View Subdivision
White's Mill
Whitefield Meadows
Whitehall
Whitehall At Belair
Whitehall Beach
Whitehall Commons
Whitehall Condo
Whitehall Condo 01-14
Whitehall Condo At Camino
Whitehall Condo At Camino Real
Whitehall Condo Of The La
Whitehall Condo Of The Lands Of The President
Whitehall Condos
Whitehall Farm
Whitehall Gardens
Whitehall Manor
Whitehall Terrace
Whitehall Village
Whitehall West
Whitehaven
Whitehead Manor
Whitehorse
Whitehurst
Whiteland Woods
Whitemarsh Chase
Whitemarsh Reserve
Whitemarsh Reserve Pud Ph 02
Whitemarsh Village
Whiteoak
Whiteoak Farms
Whites Creek Manor
Whitetail
Whitetail Resort Community
Whitetail Woods
Whitetail Woods Ii
Whitewater Village
Whitewood
Whitfield Estates
Whitfield Gardens
Whitfield Green
Whitfield Woods
Whitfields
Whitford
Whitford Hill
Whitford Hills
Whitford Village
Whitham Orchards
Whiting
Whitley Park Condominium
Whitman
Whitman Park
Whitman Sq
Whitman Square
Whitmore Estates
Whitney Condo
Whitney Park
Whitson Woods
Whittemore Park
Whittier
Whittier Acres
Whittier Echo Glen
Whittier Pond
Whittier Tower
Whittier Towers
Whittier Towers Apts Assoc Inc
Whittingham
Whitworth Agr Pud
Whitworth Agr Pud South
Wicklow
Wicklow Heights
Wicksfield
Wicomico Church
Wicomico Shores
Wiconisco
Wide Road Acres
Wide Waters
Wide Waters Subdivision
Widewater
Widewater Village
Widlwood Crest
Widow Woods
Wight Bay
Wilbur
Wilburdale
Wilburn
Wilbuwe
Wild Cherry Knoll
Wild Deer Crossing
Wild Goose Farms
Wild Meadows
Wild Oaks
Wild Quail
Wilde Acres
Wilde Lake
Wilder
Wilderness Acres
Wilderness Lakes
Wilderness Park Estates
Wilderness Ph 02
Wilderness Run
Wilderness Shores
Wildewood
Wildewood Technology Par
Wildewood Village
Wildewoode
Wildflower Pond
Wildflower Ridge
Wildlife
Wildman Arms
Wildwod Crest
Wildwood
Wildwood Crest
Wildwood Beach
Wildwood City
Wildwood Cove
Wildwood Crest
Wildwood Estates
Wildwood Forest
Wildwood Groves
Wildwood Hills Estates
Wildwood Manor
Wildwood Of Deer Creek
Wildwood Park
Wildwood River Villas
Wildwood River Villas Con
Wildwood Valley
Wildwood0
Wildwoods
Wildwwod Crest
Wilelinor Estates
Wiley
Wilhelm Park
Wilkes-Barre Park
Wilkinson Plaza
Will-O-The Wisp
Willa Park
Willard Manor
Willerburn Acres
Willet Heights
William & Mary
William Carlsan's Subdivision
William H Evans Sub
William R Willis
Williams Estates
Williams Island
Williamsburg
Williamsburg At Heritage Ridge Condo
Williamsburg Estates
Williamsburg Gardens
Williamsburg Heights
Williamsburg Manor North
Williamsburg Village
Williamsburg Villas Condo
Williamsport
Williamstown
Williamstown Borough
Willie Johnson's Subdivision
Willies Woods
Willinston Highlands Golf & Country Club
Willis Gliderport 2
Williston Highlands
Williston Highlands Golf
Williston Highlands Golf &
Williston Highlands Golf & Country Club Ests
Williston Highlands Unit 5 Replat
Williston Highlands Unit 7
Williston Hlnds
Willistown Acres
Willistown Chase
Willistown Knoll
Willoby
Willola Heights Unit 1
Willoughby
Willoughby (Aka Willoughby Cay)
Willoughby (Aka Willoughby Glen)
Willoughby 01
Willoughby 05
Willoughby 11
Willoughby 18
Willoughby 18 Willoughby Cay
Willoughby Court
Willoughby Crescent
Willoughby Farms
Willoughby Of Chevy Chase
Willoughby Townhomes
Willoughby Townhomes Pud
Willoughby Woods
Willoughbys Ridge
Willow Bend
Willow Bend Estates
Willow Bend Farm
Willow Branch East
Willow Brook
Willow Cove Manors
Willow Cove Townhomes
Willow Creek
Willow Creek Estates
Willow Creek Farms
Willow Farms
Willow Gardens
Willow Gardens Condo
Willow Gate
Willow Gate Farm
Willow Glen
Willow Green
Willow Greene No
Willow Greene So
Willow Grove
Willow Grove Mill
Willow Hills
Willow Hills- Resub Parc
Willow Lake
Willow Lawn Cottages
Willow Manor
Willow Manor Farms
Willow Oak
Willow Oak Farms
Willow Oaks
Willow Oaks At Fair Lakes
Willow Park
Willow Penn
Willow Pines West
Willow Point
Willow Pointe
Willow Ridge
Willow Rock
Willow Run
Willow Run Farm
Willow South
Willow Springs Acres
Willow Stream
Willow Street
Willow Wood
Willow Wood Estates
Willow Wood Midrise
Willow Woods
Willowbend At Martin Downs (Aka Martin Downs Parce
Willowbrook
Willowbrook At Moore
Willowcrest
Willowgate At Pat Pk W
Willowood
Willowrun
Willows Add 01
Willows Of Potomac
Willows The First Add
Willows The Second Add
Willowwood
Willowwood Midrise
Wilm
Wilm #01
Wilm #02
Wilm #03
Wilm #04
Wilm #05
Wilm #08
Wilm #09
Wilm #10
Wilm #11
Wilm #13
Wilm #14
Wilm #15
Wilm #16
Wilm #17
Wilm #19
Wilm #20
Wilm #21
Wilm #22
Wilm #23
Wilm #25
Wilm #26
Wilm #27
Wilm #6.01
Wilm #6.02
Wilm Manor
Wilmar Village
Wilmington
Wilshire
Wilshire Condo
Wilshire Estates
Wilshire Hills
Wilshire Hunt
Wilson Boulevard
Wilson Bridge
Wilson Bridge Condos
Wilson Maze
Wilson Park
Wilson Place
Wilsons Grove
Wilt
Wilton
Wilton Commons Condominium
Wilton East Condo
Wilton Estates
Wilton Estates Resub
Wilton House
Wilton Manors
Wilton Pines Townhomes
Wilton Place Condo
Wilton Springs
Wilton Station Res Condo
Wilton Terrace Condo
Wilton Village Condo
Wilton West Condominium
Wilton Woods
Wiltondale
Wiltons Corner
Wiltshire House
Wiltshire Walk
Wimberly Add
Wimberly Add To Davie
Wimbledon
Wimbledon At Jacaranda Co
Wimbledon At Jacaranda Condo
Wimbledon Iv-5 Condo
Wimbledon Townhouse I-17
Wimbledon Townhouse Iii-7
Wimbledon Villas Of Via V
Wimbledon Villas Of Via Ve
Wimbledon Villas Of Via Verde
Winbledon
Wincast Arms North Condo
Winchelsea
Winchester
Winchester Chase
Winchester City
Winchester Club Condo
Winchester Court
Winchester Courts
Winchester Estates
Winchester Farms
Winchester Landing
Winchester On The Severn
Winchester Park
Wind Condo
Wind Dancer
Wind Rush Farms
Wind Song Farms
Windbrook
Windbrook-Bradens Addn
Windbrooke
Windchime Lakes
Windemeer Farm Estates
Windemere
Windemere - Pineapple Plantation
Windemere House Condo
Windemere Woode
Winderly
Windermere At Pga National
Windermere Condo Number O
Windermere Condo Number Six
Windermere Sound Ph2
Windgate
Windgate At Avenir
Windgate Condo
Windgate Farms
Windgate I
Winding Brook
Winding Creek
Winding Creek Estates
Winding Creek Village
Winding Lake At Welleby C
Winding Lake Two At Welleb
Winding Lakes Estates
Winding Oaks
Winding Ridge
Winding Run
Windings
Windjammer
Windjammer Condo
Windlass Run
Windlestrae
Windley Key Mobile Home P
Windmeadowssouthphaseone
Windmill Lake Estates
Windmill Lakes Ii Condo
Windmill Lakes V Condo
Windmill Ranch Estates
Windmill Square
Windmill Vil West
Windmill Village By The Sea Condo
Windmill Village By The Sea Condo Condominium
Windmill Woods
Windover Meadow
Windridge
Winds Of Nobe Condo
Windsong At Boca Del Mar
Windsong At Boca Del Mar Condo
Windsong Estates
Windsong Lakes Condo
Windsong Lakes Village
Windsor
Windsor Mill
Windsor At Perry Hall Farms
Windsor At Westside
Windsor At Westside Ph 1
Windsor At Westside Ph 2
Windsor At Westside Ph 2a
Windsor At Westside Ph 3
Windsor Boro
Windsor Cay Phase 1 Pb 80
Windsor Cir
Windsor Commons
Windsor Condo
Windsor Condos
Windsor Court At Spruce Creek
Windsor Crest Condominiums
Windsor Crossing
Windsor Est
Windsor Estates
Windsor Farms
Windsor Forest
Windsor Green
Windsor Haven
Windsor Hills
Windsor Hills Ph 4
Windsor Island
Windsor Island Resort Phas
Windsor Island Resort Phase 2b
Windsor Knolls
Windsor Manor
Windsor Meadows
Windsor Mill
Windsor Oaks
Windsor Palms
Windsor Park
Windsor Park At Abacoa Pl
Windsor Park At Abacoa Pl No 3
Windsor Park Est
Windsor Park North Condom
Windsor Park South Condominiums
Windsor Parke / Polo Club
Windsor Plaza
Windsor Plaza Condo
Windsor Ponds
Windsor Ridge
Windsor Square
Windsor Terrace
Windsor Terrace Condo
Windsor Twp
Windsor Way
Windsor Way 2
Windstone
Windstone, Harbour Bluff, River's End
Windswept At Lewes
Windswept Club Condo
Windswept Estates
Windward At Jonathans Landing
Windward Beach Estates
Windward Condo
Windward Condow
Windward Estates Sec 1
Windward Ests Sec 2
Windward Ests Sec 3
Windward Harbour At Solomons
Windward Ii Condo
Windward Key
Windward Lakes Condo
Windward Manor No 2
Windward Manor No 3
Windward Palm Beach
Windward Palm Beach 2
Windward Palms
Windwater Ph Ii & Iii
Windwood
Windwood Bay Phase One
Windwood Condo - Jaywood
Windwood Coves
Windwood Fly In Resort
Windwood Seas Condo
Windwood Unit I
Windy Heights, The New
Windy Hill
Windy Hill At Lincolnia
Windy Hill Road
Windy Hills
Windy Plaza
Windybush
Windycreek
Winewood
Winfield Gardens South
Winfield Gardens South Co
Winfield Gardens South Condo
Winfield Heights
Winfield Park Unit 1
Winfield Park Unit 2
Winfield Woods
Wingate Plat 1
Wingate Plat 10
Wingate Ridge
Wingfoot Condo
Wingspread
Wingspread Farms
Winkler
Winmill
Winona Park
Winona Park 1st Addn
Winpenny Tell
Winshire Plat 1>
Winslett
Winslow Chase
Winslow Woods
Winsome Commons
Winsor Manor 2nd Addn
Winston Condo
Winston Govans
Winston Park
Winston Park Section One
Winston Park Section Thre
Winston Park Section Three
Winston Park Section Two-
Winston Park Section Two-A
Winston Park Unit 07
Winston Park Unit 2 First
Winston Park Unit 4
Winston Park Unit 6
Winston Park Unit 7
Winston Park Unit One
Winston Park Unit Three
Winston Park Unit Two
Winston Tower 300 Condo
Winston Towers
Winston Towers 100
Winston Towers 100 Ccondo
Winston Towers 100 Condo
Winston Towers 200
Winston Towers 200 Condo
Winston Towers 300
Winston Towers 400 Condo
Winston Towers 500
Winston Towers 500 Condo
Winston Towers 600 Condo
Winston Towers 700 Condo
Winston Trails Par 11
Winston Trails Par 11 Ph 2
Winston Trails Par 12
Winston Trails Par 16
Winston Trails Par 17
Winston Trails Par 18
Winston Trails Par 3
Winston Trails Par 5
Winston Trails Par 6
Winston Waterway
Winston Waterways No 2
Winston Woods
Winta Park
Winter Brook
Winter Haven Cra - Florenc
Winter Haven Towers Condo
Winter Hill
Winter Park (A/67 & B/86 & Misc 3/220)
Winter Place
Winter Quarters
Wintergate At Longmead Crossing
Wintergreen
Wintergreen Mountain Village
Wintergreen Resort
Winterlakes Tr H 1st Rep
Winterlakes Tract H 1st Replat
Winterpark
Winterplace
Winterport Cluster
Winters Ridge
Winters Run Manor
Winterset
Winterset Farms
Winterstown Boro
Wishpering Woods
Wismer
Wisp
Wisp Hotel
Wisp Resort
Wisperren Oaks
Wissahickon
Wissinoming
Wister
Wisteria Court Condo
With Balcony!!!
Witney C Condo
Witney D Condo
Wittington Condo
Wittman
Woha Puerto Cancun
Wohlshire
Wolf Creek
Wolf Run Lane
Wolf Trap Woods
Wolfe Creek
Wolfe Pointe
Wolford Woods
Wolfsville
Wolftown
Wolftrap Estates
Wolftrap Meadows
Wolftrap Vale
Wolverton At Century Village Condo
Wonderly Estates Sec 3
Wood Creek
Wood Creek Golf Comm
Wood Crest
Wood Duck Cove
Wood End
Wood Family Subdivision
Wood Farms
Wood Glen
Wood Hue I Condo
Wood Hue Ii
Wood Hue Ii Condo
Wood Hue Iii Condo
Wood Hue Iv Condo
Wood Manor
Wood Mill
Wood Pointe Plat 3
Woodaire Estates
Woodberry
Woodberry Forest
Woodberry Manor
Woodbine
Woodbine Borough
Woodbine Forest
Woodbine Par A
Woodbine Par C
Woodbine Par D
Woodbine Par E
Woodbine Par H
Woodbine Woods
Woodborne Preserve
Woodbourne Heights
Woodbriar Estates
Woodbridge
Woodbridge At Meadow Woods
Woodbridge Center
Woodbridge Condo
Woodbridge Estates Subdivision
Woodbridge Farms
Woodbridge Lakes
Woodbridge Meadows
Woodbridge Mobile Village
Woodbridge Mobile Village Unrec Co-Op
Woodbridge Valley
Woodbrook
Woodbrook Village
Woodburn
Woodburn Estates
Woodburn Village
Woodburne Estates
Woodbury
Woodbury Acres
Woodbury Estates
Woodbury Gardens
Woodbury Heights
Woodcliff Estates
Woodcliffe Park
Woodcock Farm
Woodcreek
Woodcreek Condo
Woodcrest
Woodcrest Condo
Woodcrest Mnr
Woodcrest Terrace Co-Op
Woodcroft
Wooded Acres
Wooded Ridge
Wooded Run Estates
Wooden Bridge
Woodfall
Woodfield
Woodfield Country Club
Woodfield Estates
Woodfield Hunt Club
Woodfield Hunt Club Ii
Woodfield Pd Phase 1
Woodfield Pd Phase 2
Woodfield Pd Phase 4
Woodfield Preserve
Woodford Collins
Woodfords Grant
Woodgate
Woodgate Condominium 28
Woodgate First Addition
Woodgate North
Woodglen Condo
Woodglen Estates
Woodhaven
Woodhaven Amended Plat
Woodhaven Condo
Woodhaven East
Woodhaven East Condo
Woodhollow
Woodholme
Woodholme Ii
Woodlake
Woodlake Apts Condo
Woodlake Isles
Woodlake Isles North Condo
Woodlake Kings Grant
Woodlake Shores
Woodlake Towers
Woodlake Village Townhome
Woodlake Village Townhomes Condo
Woodland
Woodland Shores
Woodland Acres
Woodland Addn
Woodland Beach
Woodland Condominium
Woodland Estates
Woodland Estates So
Woodland Farms
Woodland Green
Woodland Greens
Woodland Heights
Woodland Hills
Woodland Iii S/D
Woodland Lakes
Woodland Manor
Woodland Park
Woodland Park Add
Woodland Park Amd Plat
Woodland Park Of Wildewood
Woodland Park Station
Woodland Point Sub
Woodland Station
Woodland Village
Woodland Villas 1st Add
Woodland Villas 1st Add 7
Woodlands
Woodlands At Bethany
Woodlands At Goose Creek
Woodlands At Nottingham
Woodlands Condominium Apartment Building 3
Woodlands Country Club
Woodlands Hill
Woodlands North
Woodlands Of Foxhall
Woodlands Of Palm Springs
Woodlands Of Pepper Creek
Woodlands Of Westlake
Woodlands Sec Eight
Woodlands Sec Five
Woodlands Sec One-Phase O
Woodlands Sec One-Phase One
Woodlands Sec Seven
Woodlands Sec Six
Woodlands Third Sec
Woodlane Condos
Woodlawn
Woodlawn Estates
Woodlawn Heights
Woodlawn Terrace
Woodlawn Wpb In
Woodlea Manor
Woodlea-Conestoga
Woodleaf
Woodlet Condo
Woodley
Woodley Gardens
Woodley Gardens Coop
Woodley Meadows
Woodley North
Woodley Park
Woodlyn Crossing
Woodlyn West
Woodlynn Preserve
Woodmark Of L
Woodmark Of Lake Ridge
Woodmere
Woodmere Estates
Woodmere Pines
Woodmere Racquet Club A Co
Woodmere Sub
Woodmill
Woodmont
Woodmont Apt Homes 67a
Woodmont Estates
Woodmont Gardens
Woodmont North
Woodmont Overlook
Woodmont Pod
Woodmont Pods B F & G
Woodmont Springs
Woodmont Tract 47
Woodmont Tract 56
Woodmont Tract 57
Woodmont Tract 64
Woodmont Tract 65
Woodmont Tract 67
Woodmont Tract 69
Woodmont Tract 70
Woodmont Tracts 72 A & 72
Woodmoor
Woodmoore Towne Centre
Woodmore
Woodmore Estates
Woodmore Meadows
Woodmore North
Woodmore Overlook
Woodmore South
Woodmore Towne Centre
Woodridge
Woodridge At Lake Linganore
Woodridge Estates
Woodridge Farms
Woodridge Sub
Woodrock
Woods
Woods At Arnell Creek
Woods At Burton Pond
Woods At Deer Creek Sub
Woods At Princeton W
Woods At Prncton Wlk
Woods At River Run
Woods At Seaside
Woods At Walls Creek
Woods Condo
Woods Cove
Woods Edge
Woods Edge Mhp
Woods Edge Townhome Condominiums
Woods Haven
Woods Landing
Woods Landing Condo Ph I
Woods Manor East
Woods Mill
Woods Of Barnitz
Woods Of Bayview
Woods Of Myrtle Point
Woods Of Rolling Hills
Woods Of Rue Purchase
Woods Of Saxony
Woods Of Shannon
Woods On Herring Creek
Woods Walk 1
Woodscape Townhomes
Woodsdale
Woodsdale Manor
Woodsedge
Woodshire Village
Woodside
Woodside Apts Condo
Woodside Estates
Woodside Estates Plat 1>
Woodside Forest
Woodside In Kendall Condo
Woodside Manor
Woodside Park
Woodside Square
Woodside Village
Woodson Square Condos
Woodstock
Woodstock Add 1
Woodstock Addition
Woodstock Addition Number
Woodstock Addition Number Four
Woodstock Lodge Condo
Woodstock Villas
Woodstone
Woodstream
Woodstream East Plat Eig
Woodstream East Plat One
Woodstream East Plat Thr
Woodstream Village
Woodstream Village Plat
Woodsyde Estates
Woodview
Woodville
Woodwinds
Woodyard
Woodycrest
Woolford
Wor Wic Est
Worcester Acres
Worldgate
Worldgate Condo
Worman Estates
Wormans Mill
Wormleysburg
Worth Court
Worth Court Wpb 1st Add In
Worthington
Worthington Farms
Worthington Heights
Worthington Meadows
Worthington Overlook
Worthington Park
Worthington Reserves
Worthington Valley
Worthington Woodsyde
Worthmore Park
Worton
Wrenfield
Wrennwood
Wright Farm
Wright's Landing
Wrightstown
Wrightsville
Wyatts Hill
Wychwood Glen
Wyckoffs Mill
Wycliffe
Wycliffe - Huntington
Wycliffe Par C
Wycliffe Tr C
Wycliffe Tr F
Wycliffe Tr G
Wycliffe Tr I
Wycliffe Tr J
Wycliffe Tr K
Wycliffe Tr N
Wycliffe- Andover
Wycliffe- Cambridge
Wye Creek
Wye Island Farms
Wye Knot Farms
Wye Mills
Wye Oak
Wyman Park Hampden
Wyn Homesites No 1
Wyn Homesites No 3
Wynans Woods
Wyncote
Wynd Wood Park
Wyndale
Wyndam
Wyndam Hill
Wyndemere
Wyndemere Ii
Wyndham At Town Center
Wyndham Circle
Wyndham Common
Wyndham Hill
Wyndham Hills
Wyndham Hills South
Wyndham Lakes
Wyndham Lakes Central
Wyndham Lakes East
Wyndham Lakes North
Wyndham Lakes Plaza
Wyndham Lakes Plaza 163-21
Wyndham Lakes South
Wyndham Lakes West
Wyndham Place
Wyndham Woods
Wyndhurst Manor
Wyndmoor
Wyndwood Park
Wynfield
Wynfield At Annville
Wynfield At Millersville
Wyngate
Wyngate Townhomes
Wynken Blynken & Nod Estat
Wynkenblynken & Nod Est
Wynmere Hunt
Wynmoor
Wynmoor - Bermuda Village
Wynmoor - Lucaya Village 1-B Condo
Wynmoor Andros Village C
Wynmoor Aruba Village A Condo
Wynmoor Bermuda Village A Condo
Wynmoor Bimini Village G Condo
Wynmoor Lucaya Village
Wynmoor Village
Wynn Wood
Wynndemere
Wynnefield
Wynnefield Heights
Wynnewood
Wynnewood Acres 2
Wynnewood Acres 5
Wynnewood Park
Wynnewood Valley
Wyntre Brooke Condos
Wynwood
Wynwood Atriums Condo
Wynwood Estates
Wyoming
Wyomissing
Wyomissing Hills
Wyomissing Meadows
Wyomissing Park
X
Xanadu By The Sea
Xanadu Estates
Xavier Plat No 1
Xx
Xxxx
Xxxxx
Xxxxz
Yacht & Country Club Of Stuart
Yacht & Racquet Club Of Boca Raton
Yacht & Racquet Club Of Boca Raton Condo
Yacht Club
Yacht Club At Aventura
Yacht Club At Portofino
Yacht Club At Portofino C
Yacht Club At Sequoia Village
Yacht Club Beach
Yacht Club Condo (The)
Yacht Club East Condominiums
Yacht Club Estates
Yacht Club Island
Yacht Club On The Intraco
Yacht Club On The Intracoastal Condo
Yacht Club On The Intracoastal Condominium
Yacht Harbor
Yacht Harbor Apartments C
Yacht Harbor Est
Yacht Harbor Manor
Yacht Harbour Condo
Yacht Harbour Estates
Yacht Harbour Landings Condo
Yacht Harbour Villas Condo
Yacht Haven Estates
Yacht View Condo
Yale Heights
Yamato Terrace
Yancey Sub
Yarari
Yardley Commons
Yardley Condominium
Yardley Condominium E
Yardley Condominium F
Yardley Hunt
Yardley Hunt Estates
Yardley Oaks
Yardley Point
Yardley Preserve
Yardley Run
Yardley Walk
Yardville Estates
Yardville Heights
Yarmouth At Century Village Condo
Yates
Yates Gardens
Ye Little Wood Estates
Yeadon
Yearling Path Poa
Yeatman Sub
Yellowhouse
Yellowstone Park Amen Plat
Yerbal 3924 Floresta Bueno
Yes
Yoe
Yoe Boro
Yogi-By-The-Sea Condo
Yolanda Villas Condo
Yollanda Villas
Yonah Mountain Lake
York
York Beach
York City
York College
York County
York Haven
York Haven Boro
York Manor
York New Salem
York Street
York Twp
Yorkana Mhp
Yorkdales Carallton Isle
Yorkdales Carallton Isle Condo
Yorklyn
Yorkshire
Yorkshire Acres
Yorkshire Estates
Yorkshire Knolls Plat 9
Yorkshire Park
Yorkshire Village
Yorktown
Yorktown At Heritage Ridge
Yorktown Condo
Yorktown Condominium
Yorktown Crossing
Yorktown Heritage Ridge
Yorktown Village
Yorktowne
Yorktowne Square
Yorkville
Yotel
Yotel Pad
Yotel Pad Condominium
Yotelpad Miami
Yough Mt. Resort
Youghiougheny Mountain
Youngs Farm Estates
Yuba Condo
Yucca Gardens Condo
Yvette Condo
Z - Not In List
Z - Not In List (See Remarks)
Z Not In A Development
Z Not In Dev
Z-Not In Development
Zacarias Subdivision
Zamora Estates
Zan Mar Village
Zarbafi Estates
Zarcero Alajuela C R
Zeniths First Sub
Zenteno Sub
Zephyrhills Colony Company
Ziba Project
Ziladen Properties
Zimmerman Nicholas Sub
Zion Ridgecrest
Zona West
Zurich Condo
Zzz 124123 T240
Zzz | Unplatted
a




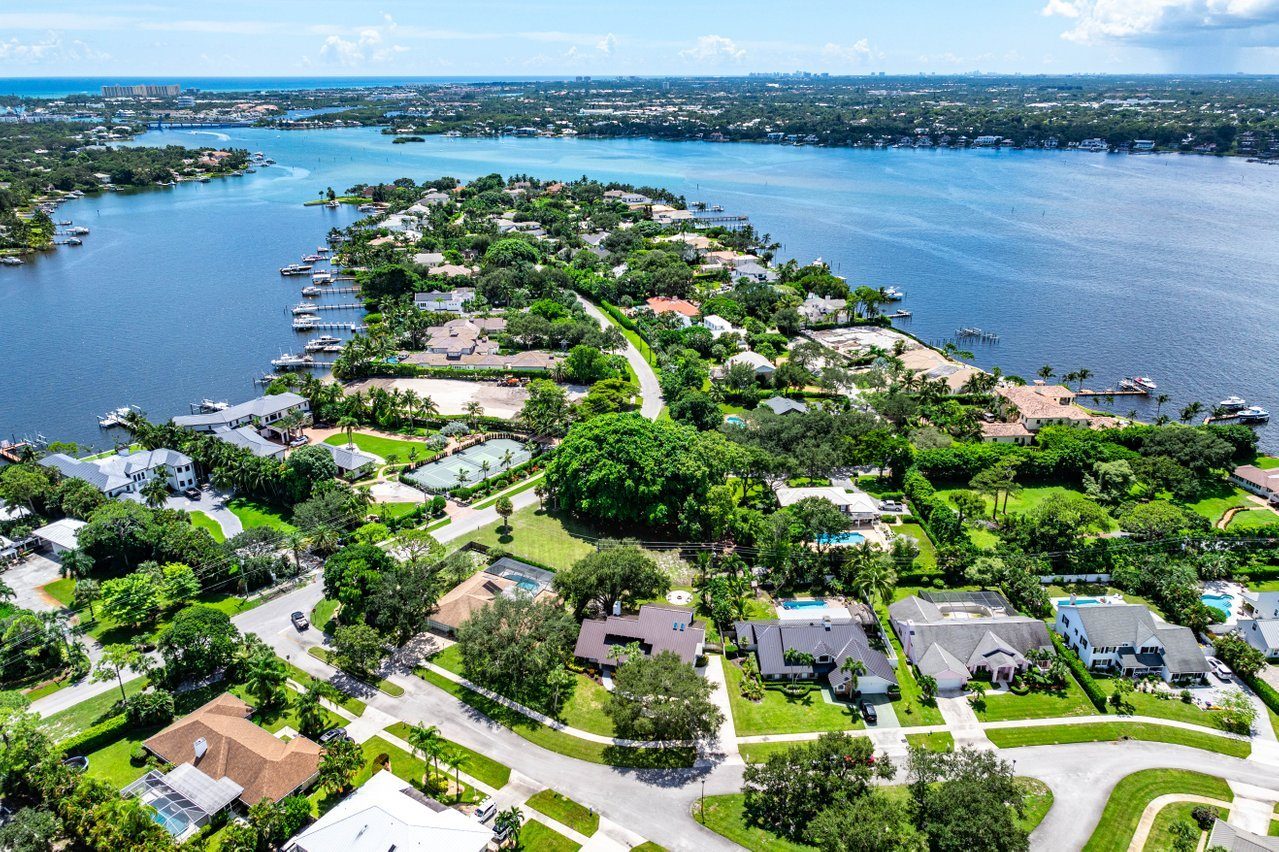
 The data relating to real estate for sale on this web site comes in part from the Broker Reciprocity Program of the South Jersey Shore Regional Multiple Listing Service. Real Estate listings held by brokerage firms other than Jack And Jill Team eXp Realty LLC are marked with the Broker Reciprocity logo (a little black house) and detailed information about them includes the name of the listing brokers.